Q2’22のFPD製造装置メーカー売上はQ2’20以降の最低値を記録~Q3’22は回復の見通し
冒頭部和訳
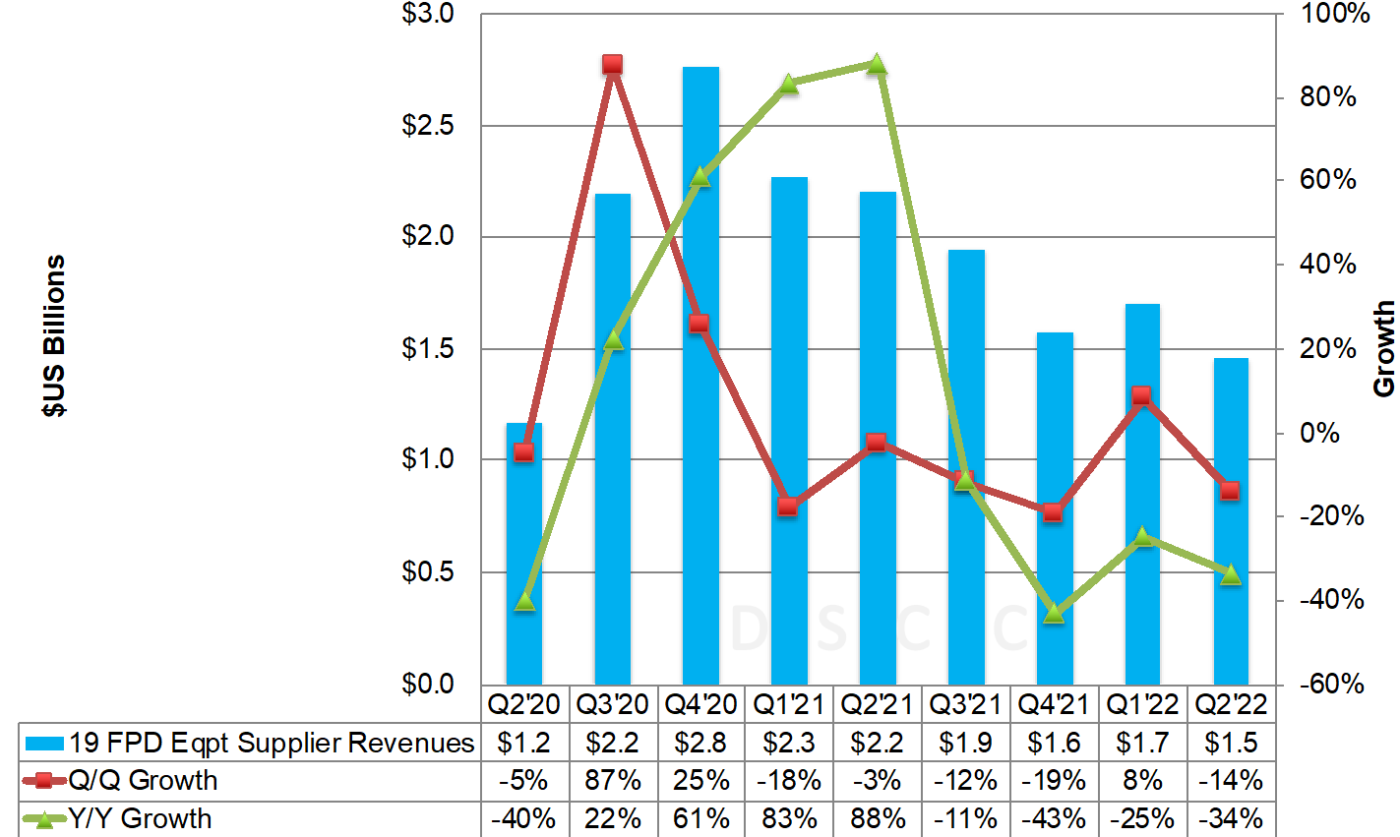
DSCCは Quarterly Display Supply Chain Financial Health Report (一部実データ付きサンプルをお送りします) にて、大手FPD製造装置メーカー19社の財務状況を調査・集計・比較しているが、Q2’22のFPD製造装置の売上は前期比14%減、前年比34%減の15億ドルとなり、Q2’20以降で最も低かったことが明らかになった。過去4四半期連続で2桁の減少率となっている。
図: FPD製造装置メーカー大手19社の売上推移
好材料としては、Q3’22には以下の生産ライン設置により売上が大幅に跳ね上がることが挙げられる。
- BOE B12
- China Star T9
- EDO Fab 2
- HKC H5
- LGD AP4/E6 しかしQ4’22までに多くの遅延が発生の見込み
- Sharp SIO
事実、DSCCのQ3’22版 Quarterly Display Capex and Equipment Market Share Report (一部実データ付きサンプルをお送りします) において、Q3’22の売上が設置ベースで前期比128%増になる見通しが明らかになっている。
Q2’22 Display Equipment Supplier Revenues Fall to Lowest Since Q2’20, Should Rebound in Q3’22
In DSCC’s Quarterly Display Supply Chain Financial Health Report (一部実データ付きサンプルをお送りします), we examine, aggregate, compare and contrast 19 of the largest display equipment suppliers financials and found that their display equipment revenues fell 14% Q/Q and 34% Y/Y to $1.5B, the lowest since Q2’20 and they have now fallen at double-digit rates for the past four straight quarters.
Display Equipment Revenues for 19 Leading Suppliers
The good news is that revenues should bounce significantly in Q3’22 on fab installs at:
- BOE B12;
- China Star T9;
- EDO Fab 2;
- HKC H5;
- LGD AP4/E6 although we have seen a number of delays to Q4’22;
- Sharp SIO.
In fact, on an install basis, we showed Q3’22 revenues rising 128% Q/Q in our Q3’22 Quarterly Display Capex and Equipment Market Share Report (一部実データ付きサンプルをお送りします).
In display equipment revenues, AMAT was #1 for the third consecutive quarter while ULVAC overtook Canon for #2 likely helped by a FMM VTE tool install at EDO, which was likely installed earlier than other tools. Nikon jumped from #4 to #3, ahead of Canon which mirrors our Quarterly Display Capex and Equipment Market Share Report, on wins at AUO FVO, BOE B17 and SDC A2. Companies gaining at least a point of market share included ULVAC, Nikon, AP Systems, DMS, HB Solution, Charm and ICD. Companies losing at least a point of share included Canon which lost nearly 14 points, V Tech. and SCREEN. In terms of display equipment growth, 10 companies had Q/Q growth in display equipment revenues with nine seeing declines. Charm, ICD and HB Solution all had triple digit Q/Q growth while six companies had greater than 50% Q/Q declines including Canon and SCREEN. Of the 19 companies we are tracking, eight earned at least 50% of their revenues from display equipment, the same as last quarter. The blended share fell to 6.9%, tied for the lowest we have seen over the past two years.
Display capex from 13 publicly traded companies fell 9% Q/Q to $5.0B, which was up 4% Y/Y. BOE had the highest capex in the quarter at $1.3B, with China Star and LG Display also over $1.0B. Adding in private company spending, we show total capex down 33% Q/Q and 18% Y/Y to $5.44B. For the companies where we capture both quarterly revenues and capex, we see that capital intensity has risen for three straight quarters to 18% after declining for two straight quarters. This is mostly due to lower display supplier revenues as prices fall.
Looking at total company performance:
- Revenues fell 5% Q/Q and 3% Y/Y to $21.3B. Despite the decline, Q2’22 results were the fifth highest quarterly total to date on the strength of continued strong demand for semiconductor equipment. On a Y/Y basis, revenues were down for the first time after seven straight positive growth quarters. The top five companies dominate with a 91% - 93% share over the last 10 quarters and have had the same rankings in 10 of the last 11 quarters. Canon and AMAT both gained more than two points of market share while SCREEN and Nissin lost the most share.
- 11 of the 19 companies had Q/Q growth with eight declining. Charm Eng. had the highest Q/Q growth followed by ICD and HB Solution.
- Margins were pretty stable with gross margins and display equipment operating margins slightly up likely due to price increases, operating margins, pre-tax and net margins slightly down and EBITDA margins flat. Margins are elevated relative to 2020 and 1H’21.
- Gross margins rose from 44.1% to 44.3%;
- Operating margins fell from 19.7% to 19.0%;
- Display equipment operating margins rose from 11.4% to 12.2%;
- EBITDA margins were flat at 23.0%;
- Pre-tax profit margins fell from 19.3% to 18.6%;
- Net margins fell from 15.0% to 14.7%.
- Bookings for 11 companies rose 1% Q/Q while falling 5% Y/Y to $517M, the second lowest total since Q2’20. Only AP Systems, Invenia, ULVAC and Wonik IPS enjoyed growth.
- Backlog fell 11% Q/Q to $1.2B, a new low but only slightly below Q2’21 and Q3’21 values. Only Jusung, KC Co and Wonik IPS saw increases in backlog values. V Technology had the highest backlog at $252M but is their lowest backlog value since at least 2015.
- Liquidity is not an issue for our list of companies with only five companies having positive net debt/equity including AMAT.
- Operating cash flow rebounded in the quarter rising 327% Q/Q to $3.3B with large gains at AMAT, Canon and TEL. AMAT had the highest operating cash flow followed by Canon, TEL, SCREEN and ULVAC. Only ICD and AVACO had negative operating cash flow.
- Free cash flow went positive rising from -$78M in Q2’21 to $2.4B in Q2’22 on large gains at AMAT, AP Systems, Canon, SCREEN, TEL and Wonik IPS. It was still 35% below peak values in Q2’21, however. AMAT, Canon, TEL, SCREEN and Wonik IPS accounted for 99% of industry free cash flow.
For more information on this content, please contact info@displaysupplychain.co.jp.
本記事の出典調査レポート
Quarterly Display Capex and Equipment Market Report
一部実データ付きサンプルをご返送
ご案内手順
1) まずは「お問い合わせフォーム」経由のご連絡にて、ご紹介資料、国内販売価格、一部実データ付きサンプルをご返信します。2) その後、DSCCアジア代表・田村喜男アナリストによる「本レポートの強み~DSCC独自の分析手法とは」のご説明 (お電話またはWEB面談) の上、お客様のミッションやお悩みをお聞かせください。本レポートを主候補に、課題解決に向けた最適サービスをご提案させていただきます。 3) ご購入後も、掲載内容に関するご質問を国内お客様サポート窓口が承り、質疑応答ミーティングを通じた国内外アナリスト/コンサルタントとの積極的な交流をお手伝いします。