米国の消費者物価指数 (CPI) から読むTV動向
冒頭部和訳
米国の消費者物価指数 (CPI) は過去40年間以上の期間で最も高いポイントに到達して以降、夏の間にゆっくりではあるが着実な下落を示したが、2021年後半に始まったTV用LCD価格の急激な下落が小売価格へとつながる流れは現在も続いていることが、米国労働統計局 (BLS) 発表の最新のCPIデータから明らかになった。
BLSは数百単位のカテゴリーのCPI統計を発表しており、現在のデータセットは1996年までさかのぼるが、CPIは1982年-1984年に対して指数化されている。CPIには300を超えるサブインデックス (下位指数) が含まれており、それぞれに経済全体に対するサブインデックスの重要度を示すウェイティング (重み付け) がなされている。たとえば、食料品はCPIの14%を構成しており、ガソリンのウェイティングは4%となっている。TVのウェイティングはわずか0.096%である。
2022年7月の全体的なCPIは296.2で、2021年7月からわずかに低下したが、同年8月からは8.3%上昇した。これは、1982年-1984年に100ドルで購入できた標準的な財のバスケット (消費者が購入する代表的な財・サービスの組み合わせ) を、今日の消費者が購入するには296.17ドル必要になることを意味する。2022年7月のTVのCPIは1.221だった。これは、1982年-1984年に100ドルだった (理論上の) TVが、今日では1.22ドルで買えることを意味する。月次ベースで見ると、全体的な価格は横ばいだったが、TV価格は3.1%下落している。
以下のグラフは、本稿の読者様が消費者物価指数の定義として認識しているであろうCPIと、CPIのTVサブインデックスの前年比変動率を示している。TVのCPIは1997年-2021年の期間、FPD時代のほぼ全体を通して-10%を下回った。2005年-2017年の10年以上の期間は常に-10%を下回っており、-20%を下回ることも多かった。
US TV Inflation in Free Fall
With the headline inflation numbers in the US showing a slow but steady decrease in the summer months from their highest point in more than 40 years, the steep declines in LCD TV panel prices that started in the second half of 2021 are continuing to flow through to retail, according to the most recent data from the US Bureau of Labor Statistics (BLS) Consumer Price Index (CPI).
The BLS publishes CPI statistics for hundreds of categories, and its current data set goes back to 1996, but the CPI is indexed to 1982-1984. The CPI includes more than 300 sub-indexes, each with a weighting that indicates the importance of the sub-index to the overall economy. For example, food items comprise 14% of the CPI, and gasoline is weighted at 4%. Televisions have a tiny weighting of only 0.096%.
The July 2022 overall CPI stood at 296.2, down slightly from July but up 8.3% from August 2021. This means that a standard basket of goods that could be purchased for $100 in 1982-1984 would cost $296.17 for a consumer today. The CPI for TVs in July 2022 was 1.221, which means that a (hypothetical) TV that cost $100 in 1982-1984 would cost $1.22 today. On a M/M basis overall prices were flat while TV prices were down 3.1%.
The chart here shows the Y/Y change in the CPI, which readers may recognize as the more familiar headline definition of inflation, and in the CPI sub-index for TV. In the period from 1997-2021, the CPI for TV has spent nearly the entire flat panel display era below -10%. For a period of more than ten years from 2005 to 2017, the CPI for TV was always below -10% and often below -20%.
Y/Y % Change in US Consumer Price Index
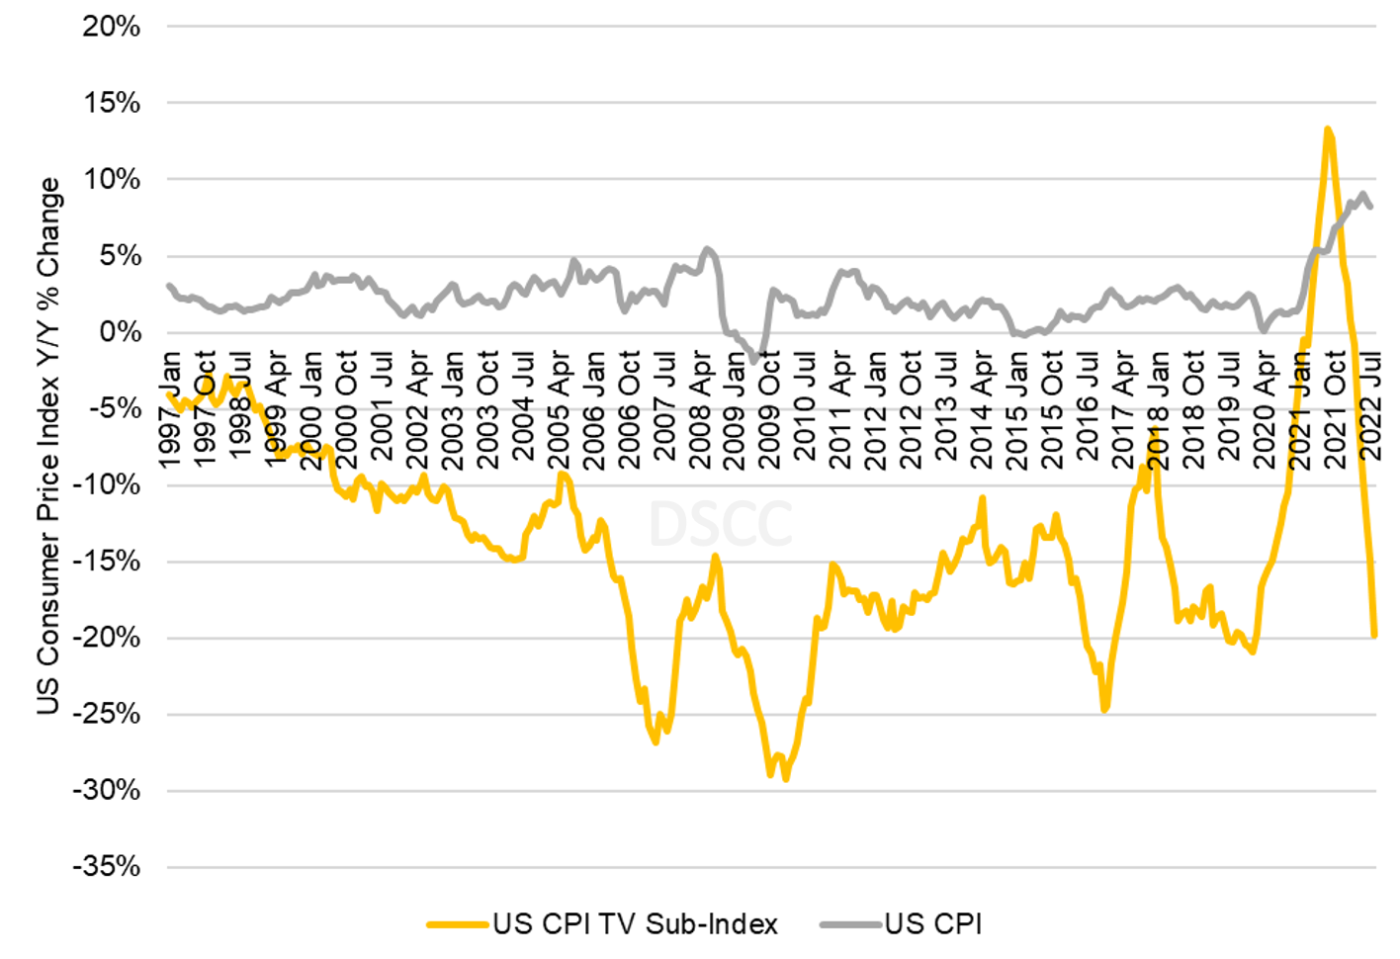
The general CPI in June 2022 increased by 8.3%, while the CPI sub-index for TVs in June 2022 decreased by 19.8% Y/Y, the lowest value since January 2020. TVs in the US are again at their lowest price ever, about 9% lower than the prior low of 1.340 set in October 2020. TV inflation peaked in August 2021 at 13.3% which was the highest level ever, but it has dropped rapidly in the year since then. The August price decrease of 3.1% represents a rate of -32% on an annualized basis.
As you might expect, TV prices are related to LCD panel prices. The unprecedented increase in TV prices in 2021 was a direct result of the unprecedented increase of more than 100% in panel prices. The pattern of TV prices (TV CPI) follows the pattern of panel prices (PPI) with a lag of 5 months. A regression of these two parameters gives the following relationship:
TV CPI Y/Y % = 0.212 * (PPI Y/Y%, T – 5 months) - 12%
The regression equation implies that when panel prices are flat Y/Y, TV prices will decline by 12%. For every 10% decline in panel prices, an additional 2% decline in TV prices will occur.
Y/Y % Change in US TV Prices and LCD TV Panel Prices
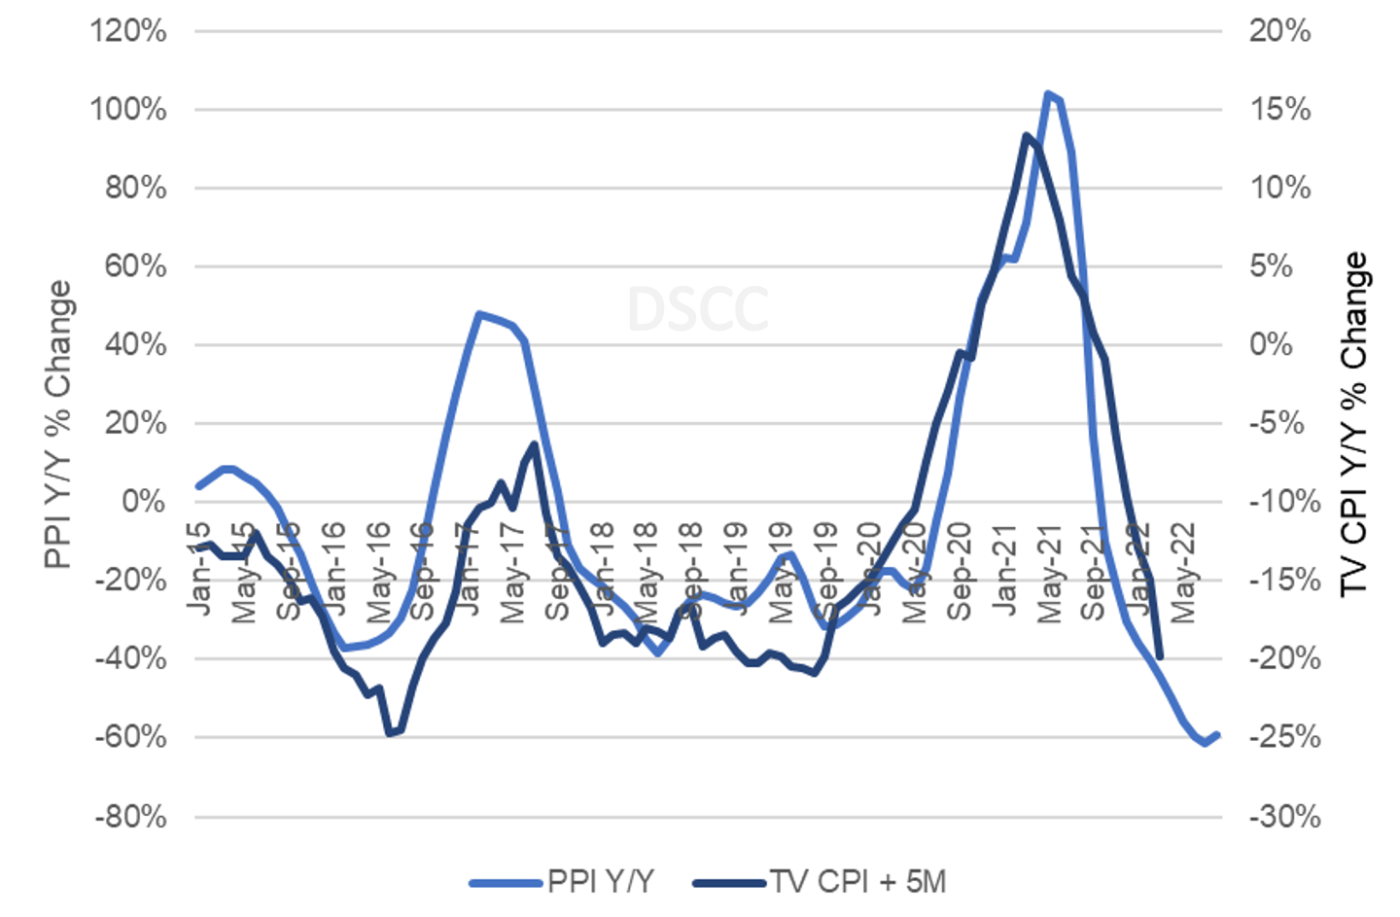
Because of the time lag, the regression equation implies a prediction of TV inflation for the next five months, and as shown on the chart it is expected to go even lower, hitting -25% just in time for the US holiday season. As shown on the first chart, TV inflation (or more appropriately said, deflation) has rarely reached such a level, only in 2007 and 2009.
Inflation for TV prices in the US may not have a strong effect on demand, based on the historical example – past examples of TV deflation did not lead to a surge in demand in the US. However, now that a full year has passed since the economy started opening up, lower TV prices might help the US increase Y/Y sales numbers.
As summer turns to fall and we approach the holiday season, it looks like a good time to buy a new TV.
