Q2'25のFPDメーカー業績レビュー~低迷した四半期で利益が減少
出典調査レポート Quarterly Display Supply Chain Financial Health Report の詳細仕様・販売価格・一部実データ付き商品サンプル・WEB無料ご試読は こちらから お問い合わせください。
これらCounterpoint Research FPD部門 (旧DSCC) 発の分析記事をいち早く無料配信するメールマガジンにぜひご登録ください。ご登録者様ならではの優先特典もご用意しています。【簡単ご登録は こちらから 】
冒頭部和訳 (AI翻訳)
業界内のフラットパネルディスプレイ (FPD) メーカー全社が2025年第2四半期の業績を発表したことを受け、業界プロファイルを更新しました。カウンターポイントリサーチ (FPD調査部門) が発行した Quarterly Display Supply Chain Financial Health Report は、上場パネルメーカー13社を対象とし、各社の財務情報開示に基づいています。
2025年第2四半期は、前四半期比および前年同期比で利益が減少しました。大手LCDパネルメーカーは、液晶テレビ用パネル価格の小幅下落の影響を受け、小型LCDおよびOLEDディスプレイに注力するパネルメーカーは、依然として収益性の低下に苦しんでいました。LCDとOLEDの両方で供給過剰に陥ったことで、設備投資は過去10年間で最低水準に達し、複数の企業が多額の負債の返済に充てました。
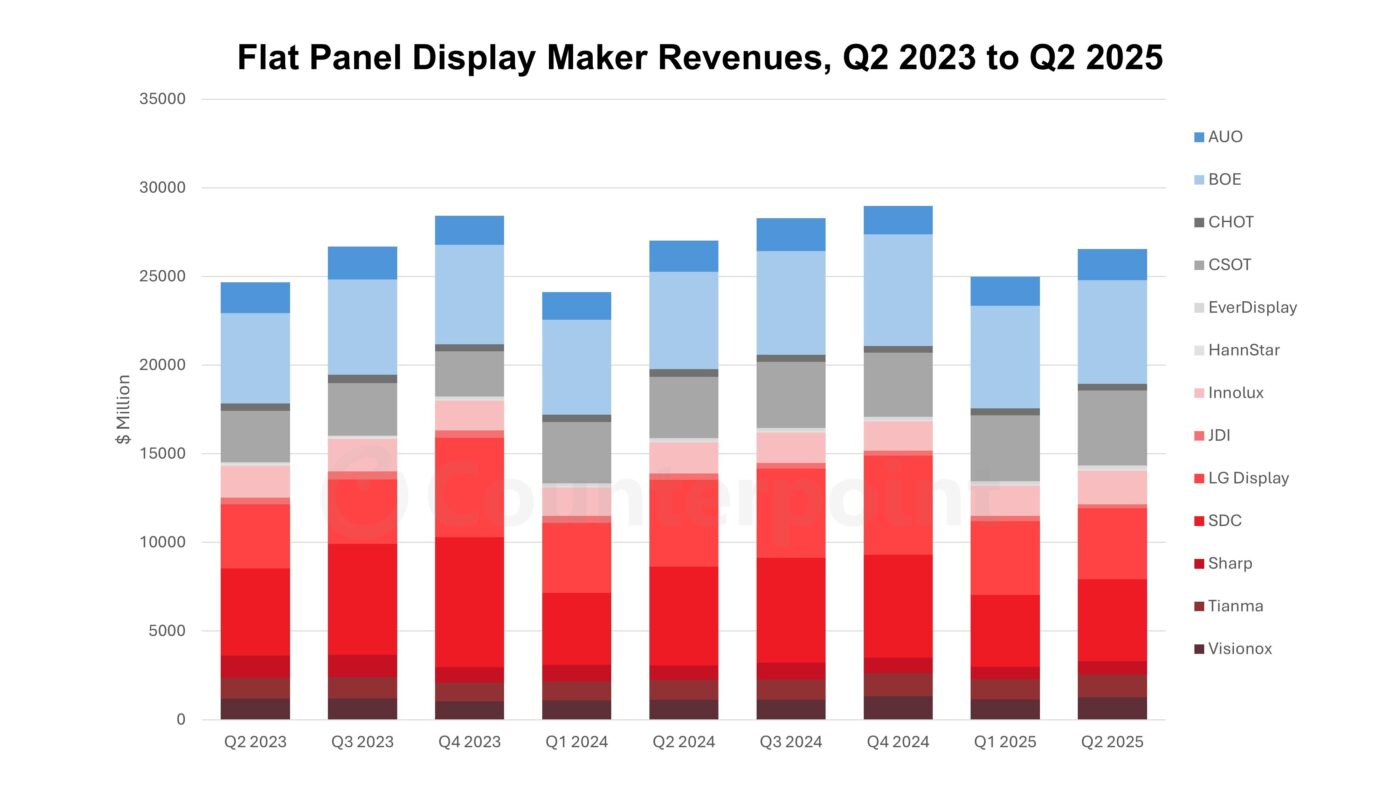
このセクションの最初のグラフは、FPDメーカーの四半期売上高を示しています。スマートフォンの季節的な回復により、売上高は前四半期比6%増の256億ドルとなりました。しかし、前年同期比では2%の減少となりました。上位7社のパネルメーカーのうち6社は前期比で売上高が増加しましたが、例外はLGディスプレイです。LGディスプレイは広州の第8.5世代LCD工場をChina Starに売却したため、売上高が減少しました。サムスンディスプレイの売上高は前期比14%増加しましたが、BOEの売上高は前期比1%増にとどまり、BOEの市場シェアのリードは5%未満に縮小しました。上位4社のパネルメーカー(BOE、CSOT、SDC、LGD)で業界売上高の73%を占めています。
Q2 2025 Flat Panel Display Financials Review: Profits Trimmed in a Slow Quarter
※ご参考※ 無料翻訳ツール (Google)
Now that all of the industry’s flat panel display makers have reported their Q2 2025 financial results, we have updated our industry profile. Counterpoint Research’s Quarterly Display Supply Chain Financial Health Report covers the 13 publicly traded panel makers and is based on company financial disclosures.
In the second quarter of 2025, profits fell both sequentially and annually. Large LCD panel makers were hurt by a modest decrease in LCD TV panel prices, while panel makers focused on smaller LCD and OLED displays continued to struggle with profitability. With the industry in oversupply in both LCDs and OLEDs, capital investment hit its lowest point in a decade, and several companies used cash to pay down heavy debt loads.
The first chart in this section shows quarterly revenues for FPD makers. A seasonal recovery in smartphones brought a modest 6% sequential increase in revenues to $25.6 billion. But in YoY terms, revenues declined 2%. Six of the top seven panel makers had sequential revenue increases, with the exception being LG Display, which sold its Guangzhou Gen 8.5 LCD fab to China Star and thus lost its revenues. Samsung Display revenues increased 14% QoQ while BOE revenues increased only 1% QoQ, so BOE’s market share lead was trimmed to less than 5%. The top four panel makers (BOE, CSOT, SDC and LGD) represented 73% of industry revenues.
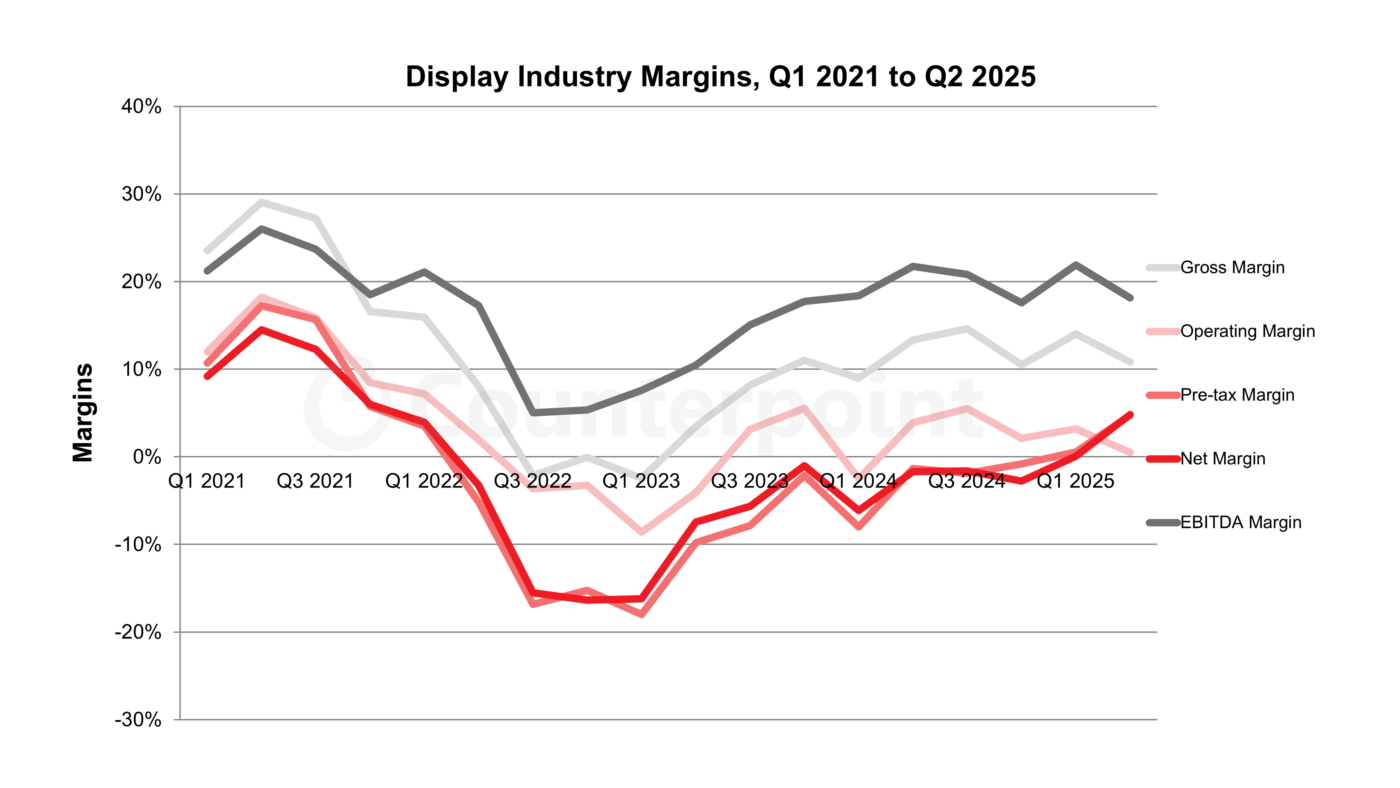
The recovery from the post-pandemic downturn is clearly shown in the next chart of industry margins. The pandemic-fueled upcycle peaked in Q2 2021, and the industry bottomed out between Q3 2022 and Q1 2023. Margins improved from Q1 2023 to Q3 2024, with a correction in Q1 2024, and have been oscillating around for the last four quarters. The pre-tax and net margins in Q2 2025 jumped, even while operating margins deteriorated due to LGD’s extraordinary gain from the sale of the Guangzhou unit.
Note that while operating margin figures include SDC, all other metrics exclude SDC because Samsung does not provide a full income statement at the business segment level. SDC’s positive OPM% brings up the industry average substantially, but SDC’s operating margin dropped from a recent peak of 19% in Q3 2024 to 7% in Q2 2025, bringing the industry OPM down. The flat panel display industry totaled an operating profit of only $112 million, with only 5 of the 12 panel makers reporting operating profits in Q2 2025, and 7 reporting losses. Excluding SDC, total industry operating results were a loss of more than $200 million.
Gross profits declined sequentially for 7 of 10 panel makers; only JDI, AUO and Innolux increased gross profits QoQ. Despite a 31% QoQ decrease, BOE’s gross profits still represented 45% of the industry total (which excludes SDC, CSOT and Sharp, which do not report gross profits of their display businesses). Four panel makers focused on small displays – HannStar, EverDisplay, Visionox and JDI – continued to have negative gross profits.
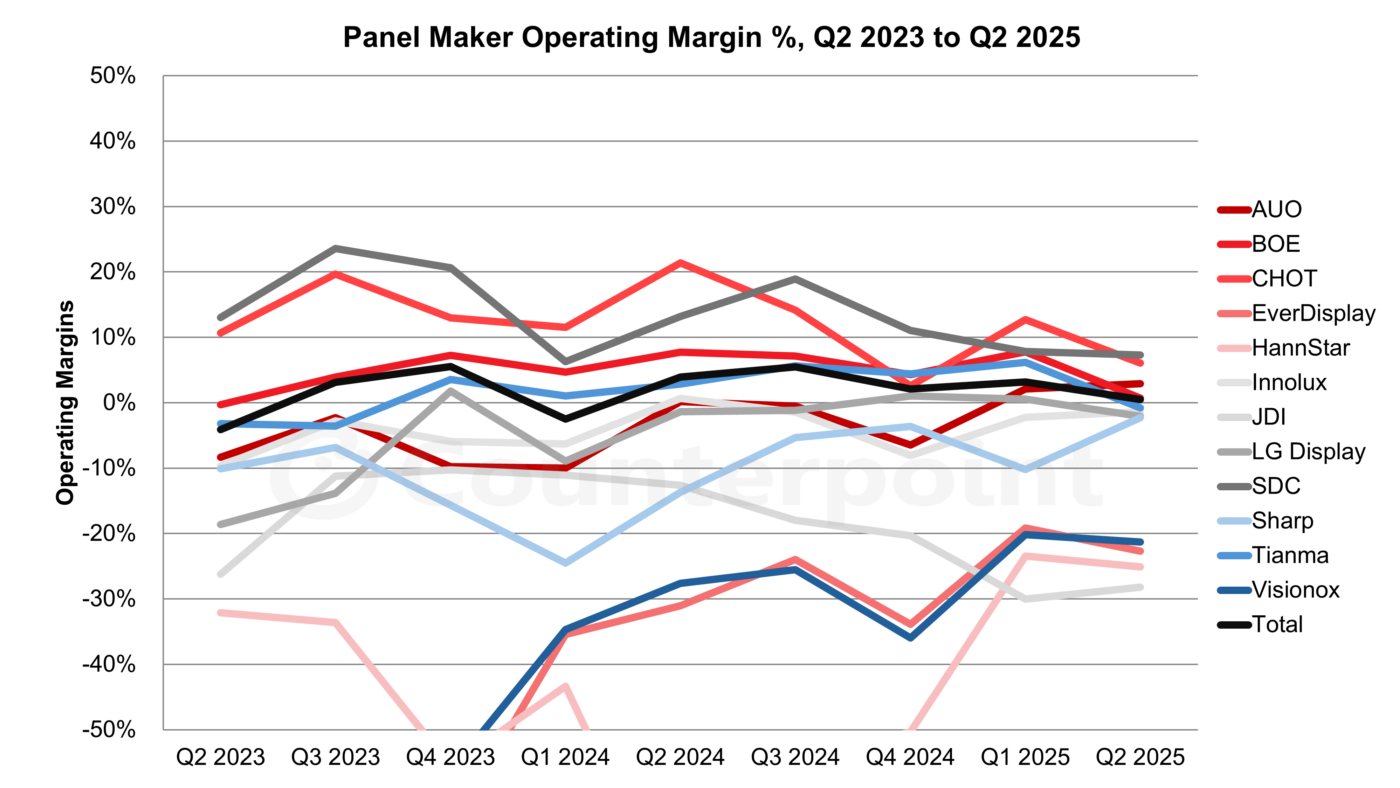
The next chart showing operating margins demonstrates the huge range of operating margins in the industry. With LCD TV panel prices falling in Q2, CHOT’s margin declined, and once again, SDC had the highest operating margin in the industry. But no company managed to get a double-digit % operating margin, the first time that has happened since the pandemic-stricken Q1 2020.
Only 2 of the 12 companies saw operating profit margins improve, with the other 10 companies worsening QoQ. The exceptions were AUO, squeezing out a 3% OPM% after 2% in Q1 2025, and Sharp, improving from a -10% OPM in Q1 2025 to a -2% OPM in Q2 2025.
Net profit figures exclude Samsung and Sharp, which do not report net profits of their display business segments. Among the 11 companies that report net results, 6 reported a net profit in Q2 2025, with 4 of the 5 in the loss column all concentrating on small panels – EverDisplay, HannStar, JDI and Visionox. The industry net profit was boosted by a big extraordinary gain from LG Display on the sale of its Guangzhou LCD fab; we estimate the gain at KRW 1.3 trillion ($900 million), partially offset by interest charges and other non-operating costs. The industry in total reported $770 million in net profits in the first quarter, the second consecutive quarter of net profits after 11 consecutive quarters of net losses. But without the Guangzhou gain, the industry would have reported a net loss.
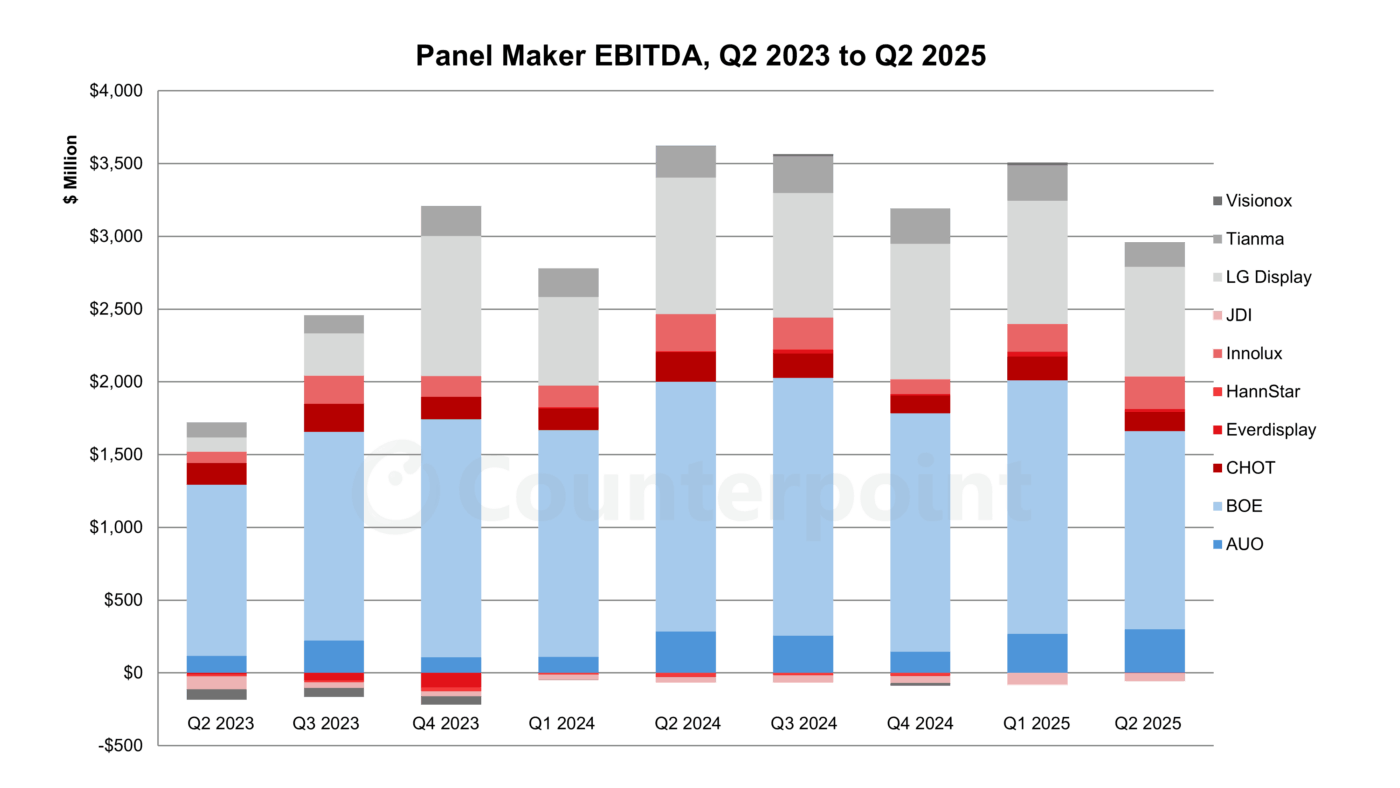
EBITDA by company is shown in the next chart. EBITDA for the industry decreased by 15% QoQ and 18% YoY to $2.9 billion. As for operating profits, most companies in the industry reported reduced EBITDA. On both a percentage of revenue and in the absolute value, the four companies with the worst EBITDA performance – EverDisplay, HannStar, Japan Display and Visionox – all focus on small screen displays.
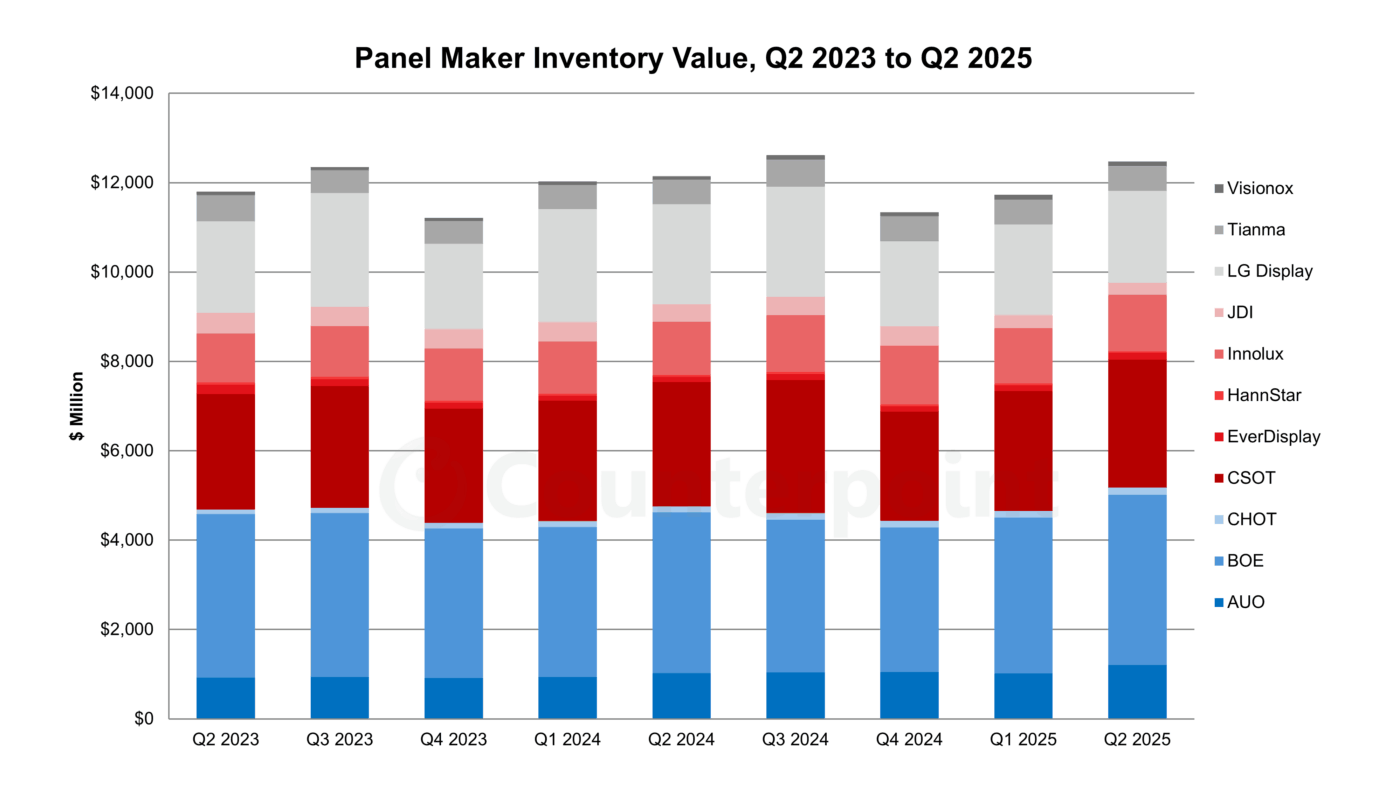
Turning to company balance sheets, inventories increased by 6% sequentially in Q2 2025 to what looks like a seasonal high point. Inventory days were flat QoQ at 63. Although inventory was at the upper part of its recent range, it does not appear to be in a problem area yet.
Operating cash flow for the industry decreased by 39% QoQ to its lowest level since Q1 2023. Both BOE and LG Display saw large decreases in OCF, $600 million and $750 million, respectively. The $700-million increase in industry inventory was a major factor in the OCF decline.
After two positive quarters, free cash flow turned negative in Q2 2025 because of the greatly reduced operating cash flow and despite anemic capital expenditure. The industry has had positive free cash flow for six of the previous eight quarters.
Five of the ten panel makers who report display business cash flow reported positive FCF.
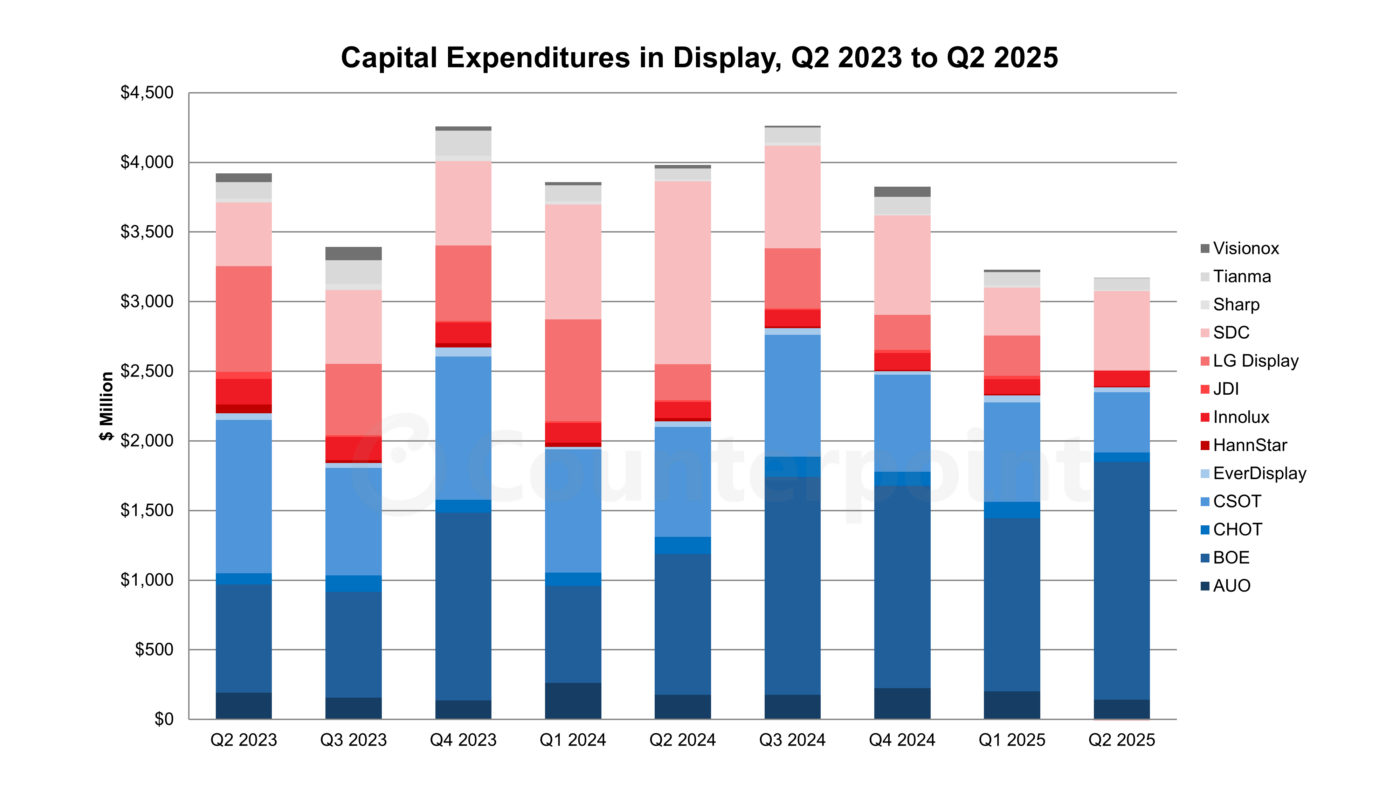
The negative FCF appears even worse when considering the recent pattern of low capital expenditures. Capex for these 13 panel makers declined by 8% QoQ and 26% YoY to $3.0 billion, the lowest level since 2015. BOE continued to lead the display industry capex with $1.7 billion, representing nearly 60% of the industry’s capex.
The industry saw its best-ever upswing of the Crystal Cycle in 2020-2021 and its worst-ever downswing in 2022-2023. The recovery that started in 2023 centered on companies that concentrate on LCD panels for large-area applications, including the Taiwan panel makers but also CHOT, BOE and CSOT in China. By managing utilization and avoiding any buildup of excess inventory, these companies have been able to stabilize revenues and profitability. With LCD panel prices decreasing in Q3 2025, we are unlikely to see improvements in operating results for LCD makers in the third quarter, but also unlikely to see big losses.
Meanwhile, although Q2 results were disappointing, Samsung Display remains uniquely profitable in making OLED display panels. Other companies that focus on OLED or small LCD, including HannStar, Tianma, EverDisplay and Visionox, have all made modest progress in improving profitability but have a way to go. Japan Display, unique in this group, has not improved and looks like it may finally collapse.
