Q3’23のFPDメーカー業績レビュー (BOE、CSOT、CHOT、EDO、Tianma、Visionox) ~中国FPDメーカーの勝者と敗者
関連調査レポート Quarterly Display Supply Chain Financial Health Report の詳細仕様・販売価格・一部実データ付き商品サンプル・WEB無料ご試読は こちらから お問い合わせください。
これらDSCC Japan発の分析記事をいち早く無料配信するメールマガジンにぜひご登録ください。ご登録者様ならではの優先特典もご用意しています。【簡単ご登録は こちらから 】
冒頭部和訳
中国の上場FPDメーカー全6社が先週、Q3’23の財務実績報告を行ったが、業績は各社さまざまだった。大型LCDに重点を置くメーカー (BOE、CSOT、CHOT) は価格上昇の恩恵を受けたが、OLEDを含む小型FPDに重点を置くメーカー (Tianma、Visionox、EverDisplay) の業績は低迷した。
各メーカーからの第3四半期の財務実績報告は簡略化された内容だったが、これは中国の標準的な報告実務に従ったものである。第1四半期 (および第3四半期) の報告は損益計算書と貸借対照表のみで、キャッシュフロー計算書や事業セグメント業績は含まれていない。年度中盤の中間決算や年次報告書には詳細が記載される。DSCCでは各社のEBITDAの推測にあたり、第3四半期報告の減価償却費の代わりに第2四半期の減価償却費を推定値として使用している。過去を振り返ると、四半期毎の減価償却費の変化はごくわずかなものだった。
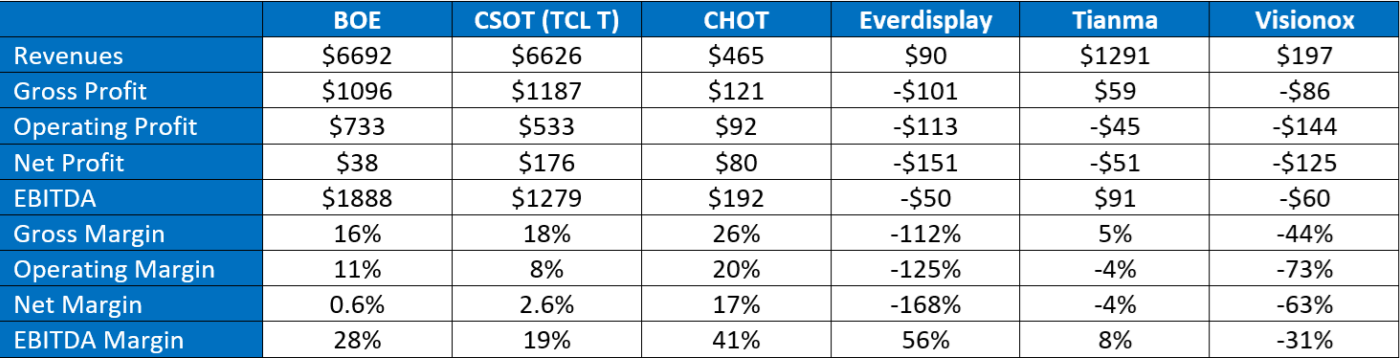
下表は上場FPDメーカー6社のQ3’23業績をまとめたものである。メーカー別の詳細は以下の通りである。
Panel Maker Q3’23 Earnings: BOE, CSOT, CHOT, EDO, Tianma and Visionox. Winners and Losers Among China Panel Makers
※ご参考※ 無料翻訳ツール (DeepL)
All six of the publicly traded panel makers in China released their financial reports for the third quarter of 2023 last week, and the results showed diverging fortunes. The companies focused on large-area LCD (BOE, CSOT, CHOT) benefited from rising prices, while panel makers focused on small displays including OLED (Tianma, Visionox, EverDisplay) fared worse.
Following China’s standard reporting practices, the companies reported only abbreviated financial reports for Q3. The Q1 (and Q3) reports include a P&L and balance sheet only, no cash flow statement and no business segment results. Companies include more detail in their mid-year Interim results and in Annual Reports. To estimate EBITDA, in lieu of reported depreciation for Q3 we use the Q2 depreciation as an estimate. Historically, depreciation costs vary only slightly from quarter to quarter.
The table here gives a summary of results for these six publicly traded panel makers for Q3’23. Detailed results by company follow.
Income Statement Highlights for Q3’23 in US$ Millions
BOE
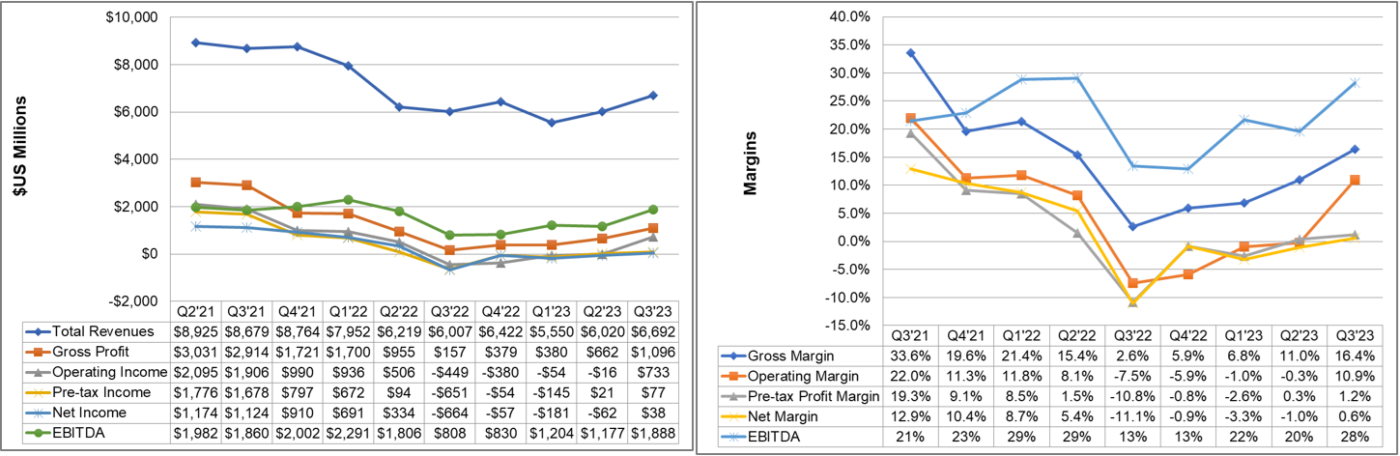
BOE reported a net profit of CNY 272M ($38M) on revenues of CNY 48.5B ($6.7B). Revenues were up 11% Q/Q and 11% Y/Y. BOE reported an operating profit of CNY 5.3B ($733M), compared to an operating loss of CNY 112M in Q2’23 and an operating loss of CNY 3.1B in Q3’22. BOE net income was much better than consensus analyst expectations of a loss of CNY 147M, but revenue was 10% below consensus expectations of CNY 54.1B. EBITDA was CNY 13.7B, up 28% Q/Q and 60% Y/Y and better than consensus expectations of CNY 11.7B.
Corporate gross margin increased from 11% in Q2'23 and 3% in Q3'22 to 16% in Q2'23. Operating margin improved from 0 to +11% and net margin improved by 1.6% Q/Q while EBITDA margin improved by eight points Q/Q to 28%.
BOE Income Statement and Margins
BOE does not disclose Display revenues in its Q3 earnings release. Display represented 84.7% of corporate revenues in 1H’23, down from 86.8% in 1H’22.
BOE inventory increased by 4% Q/Q but with higher revenues inventory days decreased Q/Q from 62 to 60. BOE continues to hold a substantial cash reserve, but cash decreased 1% Q/Q and 19% Y/Y to CNY 74.9B; in US$ cash decreased by 4% Q/Q to $10.3B because of currency effects. BOE debt increased by CNY 2.1B and equity increased by CNY 0.4B, so debt/equity edged up from 74% to 75% while net debt/equity increased from 35% to 37%.
BOE reported cash flow from operations of CNY 6.8B ($941M), up 8% Q/Q but down 14% Y/Y. BOE depreciation in Q2'23 was CNY 8.4B and assumed to be the same in Q3'23. For the fifth consecutive quarter, capital expenditures were less than depreciation. BOE capex in the quarter was CNY 5.5B ($760M), down 2% Q/Q and 11% Y/Y. BOE reported positive free cash flow of CNY 1.31B ($181M), the third consecutive quarter of positive FCF.
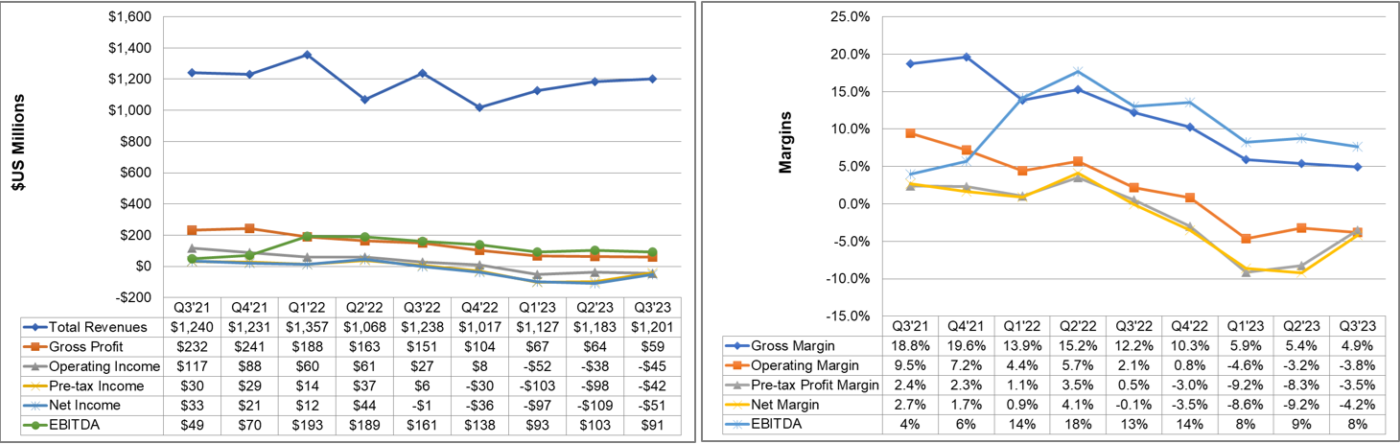
CSOT (TCL Technologies)
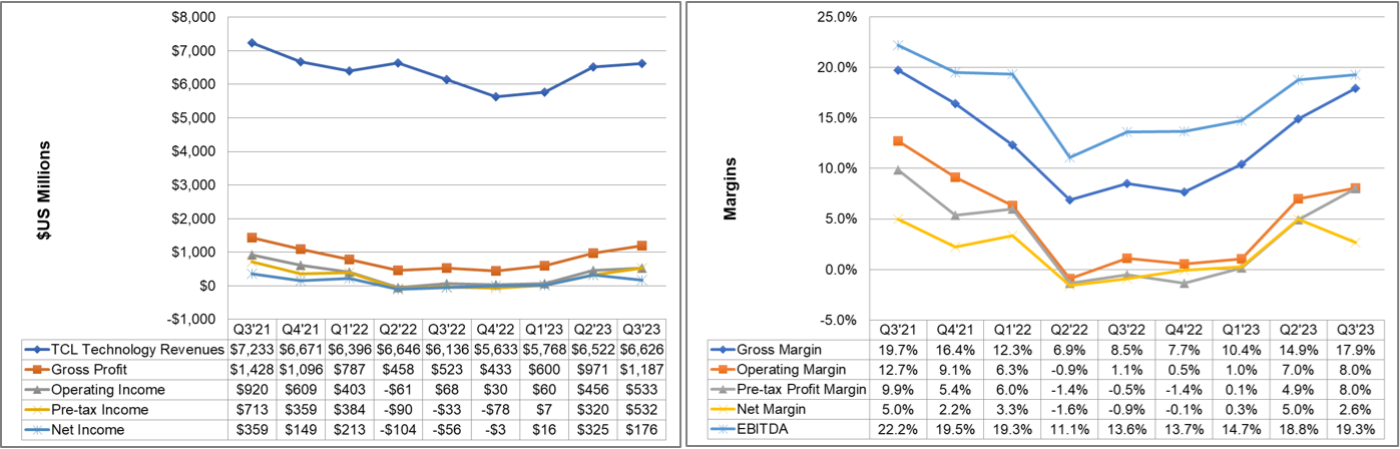
At a corporate level, TCL Technologies reported a net profit available to common stockholders in Q1’23 of CNY 1.27B ($176M) on revenues of CNY 48.0B ($6.6B). Net income was worse than consensus expectations of CNY 1.33B and revenues fell short of consensus expectations of CNY 49.98B. Revenues increased 2% Q/Q and 8% Y/Y in $US. Net income compares to a net loss in Q3'22 of CNY 382M and is down 46% Q/Q from a net profit in Q2'22 of CNY 2.2B.
TCL margins across the board improved Y/Y, and all margins except net margin improved Q/Q. TCL gross margin improved from 15% in Q2'23 to 18% in Q3'23 while TCL's operating margin improved from 7% in Q2'23 to 8% in Q3'23. Net margin fell Q/Q from 5.0% to +2.6% but EBITDA margin improved Q/Q from 18.8% to 19.3%.
TCL Technology Income Statement and Margins
TCL inventory increased 9% Q/Q and inventory days increased from 42 to 46. TCL debt increased by CNY 2.4B while equity increased by CNY 5.5B. Debt/equity improved from 106% to 104% and net debt/equity decreased from 75% to 72%.
TCL capital expenditures in Q3'23 were CNY 5.6B ($772M). TCL reported cash flow from operations of CNY 5.7B, down 3% Q/Q but up 22% Y/Y. Free cash flow turned positive at CNY +132MB ($19M). This was the first positive quarter of FCF after six consecutive quarters of negative FCF. TCL does not report segment results in its Q3 release. In Q2'23, Display segment revenue was 45% of corporate revenue.
CHOT (Caihong Display)
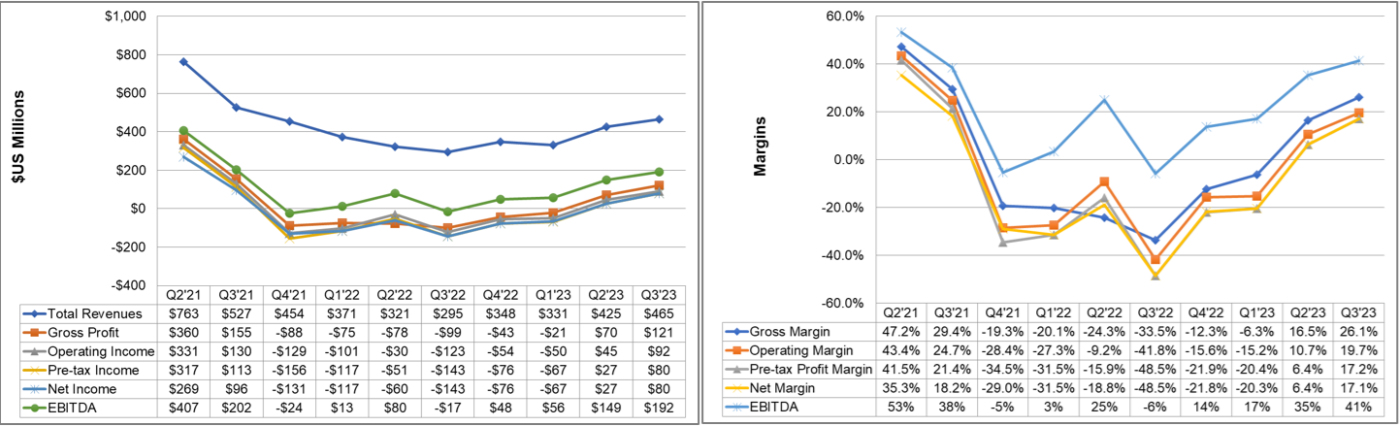
Caihong Display, the parent company of CHOT, reported a net profit of CNY 576M ($80M) on revenues of CNY 3.67B ($465M). Revenues were up 10% Q/Q and 58% Y/Y. CHOT reported an operating profit of CNY 663M ($92M), compared to an operating profit of CNY 318M in Q2’23 and an operating loss of CNY 843M in Q3’22. This was the second consecutive quarter of operating profits and net profits after six consecutive quarters of operating and net losses for CHOT.
Margins improved both Q/Q and Y/Y. Gross margin jumped from 17%in Q2'23 to +26% in Q3'23. This compares with -34% in Q3'22. Operating margin jumped Q/Q from +10.7% to +19.7%, and the Y/Y improvement was even bigger as CHOT reported -42% operating margin in Q3'22. EBITDA margin continued to be strong at +41%, up from +35% in Q1'22 and from -6% in Q3'22.
CHOT Income Statement and Margins
Inventory increased by 9% Q/Q and inventory days increased from 27 to 30. CHOT debt decreased by CNY 4.3B (-$677M including FX changes) while equity increased. Debt/equity was reduced from 86% to 63% and net debt/equity decreased from 45% to 25%. CHOT reported cash flow from operations of CNY 1.0B ($135M), up 133% Y/Y. Free cash flow turned positive at CNY +118M ($16M), the first positive quarter, after six consecutive quarters of negative FCF. CHOT capital expenditures in Q3'23 were CNY 860M ($119M).
EverDisplay (EDO)
Everdisplay reported a net loss in Q3’23 of CNY 1.09B (-$151M) on revenues of CNY 651M ($90M). Everdisplay reported an operating loss of CNY 815M (-$113 M), compared to an operating loss of CNY 528M in Q2'23 and an operating loss of CNY 310M in Q3'22. Revenues increased 20% Q/Q in $US but decreased 59% Y/Y. The net loss compares to a net loss of CNY 870M in Q2'23 and a net loss of CNY 505M in Q3'22. Since Everdisplay went public in Q1'21, it has reported 11 consecutive quarters of net losses and operating losses.
EDO gross margin worsened from -85% in Q2'23 to -112% in Q3'23. EDO has never reported a positive gross margin. EDO net margin worsened Q/Q from -165% to -168% and EBITDA margin worsened Q/Q from -14% to -56%.
EDO Income Statement and Margins
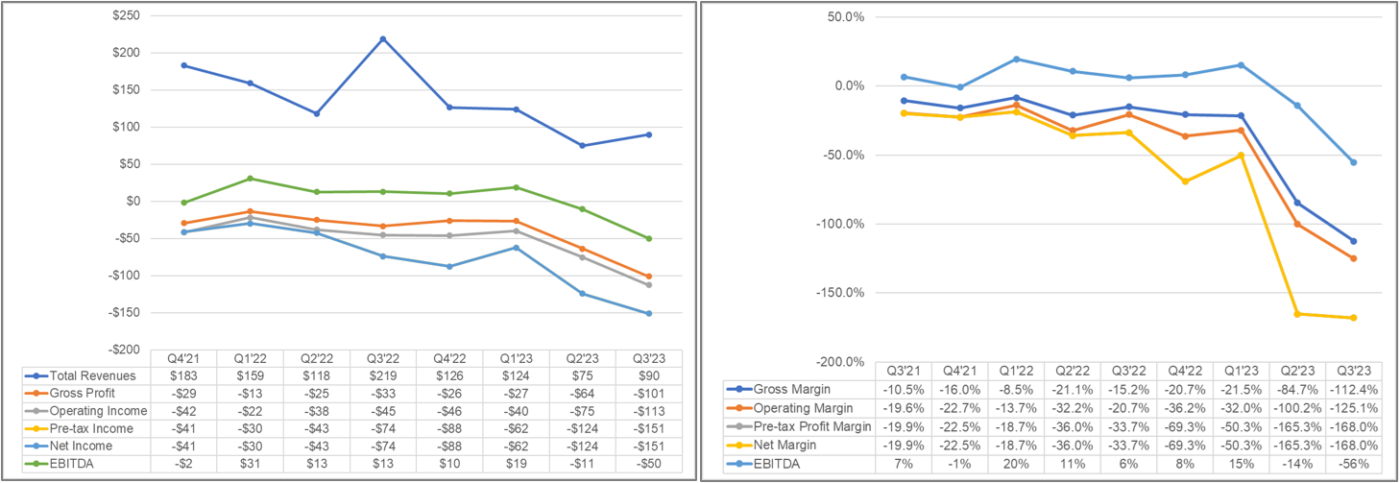
EDO inventory decreased 25% Q/Q while inventory days decreased from 255 to 155 with higher shipments. EDO debt increased by CNY 590M but by only $19M in US$ to $1.98B while equity decreased by CNY 1.09B. Debt/equity increased from 95% to 107% and net debt/equity increased from 78% to 88%.
EDO depreciation/amortization in Q3'23 was CNY 450M ($63M) and EBITDA was a loss of CNY 362M (-$50M). This compares with an EBITDA loss of CNY 60M in Q2'23 and an EBITDA loss of CNY 40M in Q3'22. EDO capital expenditures in Q3'23 were CNY 240M ($34M). EDO reported cash flow from operations of CNY -140M, compared to CNY -170M in Q2'23 and CNY +350M in Q3'22. Free cash flow continued to be negative at CNY -300M (-$53M). EDO has never reported positive FCF.
Tianma
Tianma reported a net loss in Q3’23 of CNY 366M (-$51M) on revenues of CNY 8.7B ($1.2B). Revenues increased 2% Q/Q in $US but decreased 3% Y/Y. The net loss compares to a net loss of CNY 765M in Q2'23 and a net loss of CNY 9M in Q3'22. Tianma has reported five consecutive quarters of net losses.
Revenues fell 4% short of consensus expectations of CNY 9.1B and net income was much worse than consensus expectations of a loss of CNY 174M. Tianma reported an operating loss of CNY 329M (-$45M), much worse than consensus expectations of an operating profit of CNY 107M. The Q3'23 operating loss was slightly worse Q/Q from an operating loss of CNY 266M in Q2'23 and worse than an operating profit of CNY 182M in Q3'22.
Tianma gross margin edged down from +5.4% in Q2'23 to +4.9% in Q3'23. Tianma net margin improved Q/Q from -9.2% to -4.2%% but EBITDA margin worsened Q/Q from 9% to 8%. Tianma's operating margin worsened from -3.2% in Q2'23 to -3.8% in Q3'23. Tianma reported its third consecutive operating loss after seven full years of operating profits.
Tianma Income Statement and Margins
Tianma inventory decreased by 14% Q/Q and inventory days decreased from 48 to 40. Tianma debt decreased by CNY 8.3B while equity decreased by CNY 1.1B. Debt/equity decreased Q/Q from 131% to 106% and net debt/equity increased from 100% to 74%. Tianma Depreciation/Amortization for Q3'23 is estimated at CNY 992M ($137M) and capital expenditures were CNY 1.23B ($169M).
Tianma reported positive cash flow from operations of CNY 2.21B ($305M), compared to CNY 733M in Q2'23 and CNY 0.9B in Q3'22. Free cash flow turned positive at CNY 985M ($136M). Tianma's Display business segment accounted for 97.9% of revenues in 1H'23, compared to 98.23% in 1H'22.
Visionox
Visionox (GVO) reported a net loss in Q3’23 of CNY 905M (-$125M) on revenues of CNY 1.43B ($197M). GVO reported an operating loss in Q3’23 of CNY 1.04B ($144M), compared to an operating loss in Q2'22 of CNY 1.10B and an operating loss in Q3'22 of CNY 627M. Revenues decreased 28% Q/Q and 5% Y/Y in $US. The net loss compares to a net loss of CNY 1.08B in Q2'23 and a net loss of CNY 809M in Q3'22. Visionox has reported 11 consecutive quarters of net losses.
GVO gross margin worsened from -36% in Q2'23 to -44% in Q3'23. GVO has reported negative gross margins in seven of the last 10 quarters. GVO net margin degraded Q/Q from -56% to -63%% and EBITDA margin worsened Q/Q from -26% to -31%.
Visionox Income Statement and Margins
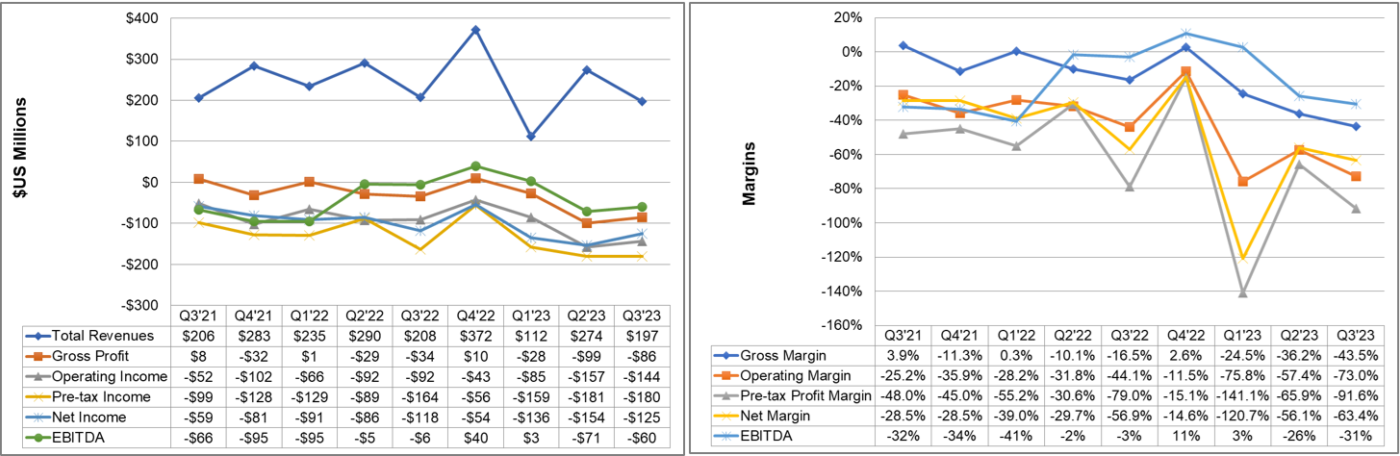
GVO inventory decreased 6% Q/Q, but inventory days increased from 28 to 35 with lower shipments. GVO debt decreased by 35% or CNY 5.7B while equity decreased by 24% or CNY 3.1B. Debt/equity decreased from 124% to 105% and net debt/equity increased from 86% to 55%. One half of GVO's total debt of CNY 10.7B is current debt or the current portion of long-term debt, due within one year.
GVO Depreciation/Amortization for Q3'23 was CNY 604M ($83M) and capital expenditures were CNY 692M ($96M). GVO reported negative cash flow from operations of CNY -240M (-$33M), compared to CNY +276M in Q1'23 and CNY 1232M in Q3'22. Free cash flow was negative CNY -931M (-$129M).
関連調査レポート Quarterly Display Supply Chain Financial Health Report の詳細仕様・販売価格・一部実データ付き商品サンプル・WEB無料ご試読は こちらから お問い合わせください。
