世界FPD投資額予測を更新 (2025年の製造装置メーカーシェア予測)
出典調査レポート Quarterly Display Capex and Equipment Market Share Report の詳細仕様・販売価格・一部実データ付き商品サンプル・WEB無料ご試読は こちらから お問い合わせください。
これらCounterpoint Research FPD部門 (旧DSCC) 発の分析記事をいち早く無料配信するメールマガジンにぜひご登録ください。ご登録者様ならではの優先特典もご用意しています。【簡単ご登録は こちらから 】
記事のポイント
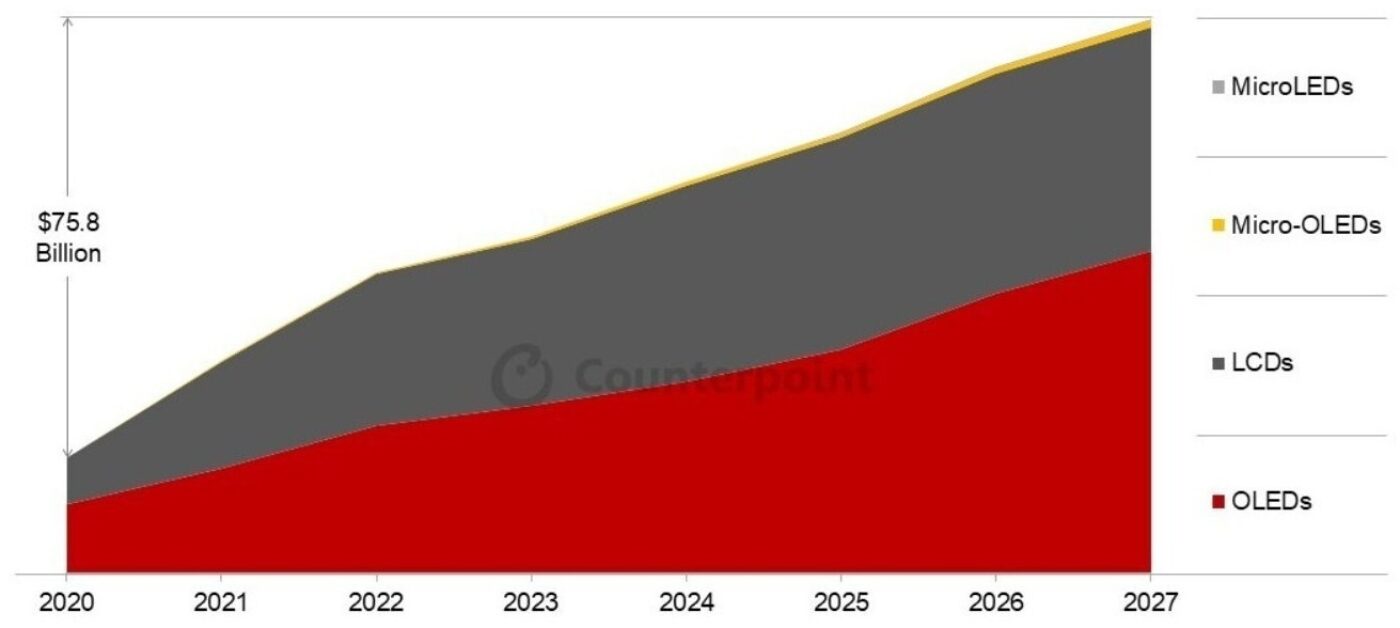
- 2020年-2027年のFPD設備投資額は760億ドル規模が見込まれている。
- OLEDは今後も設備投資の主要部分を占め、2025年は前年比31%増の成長が見込まれている。
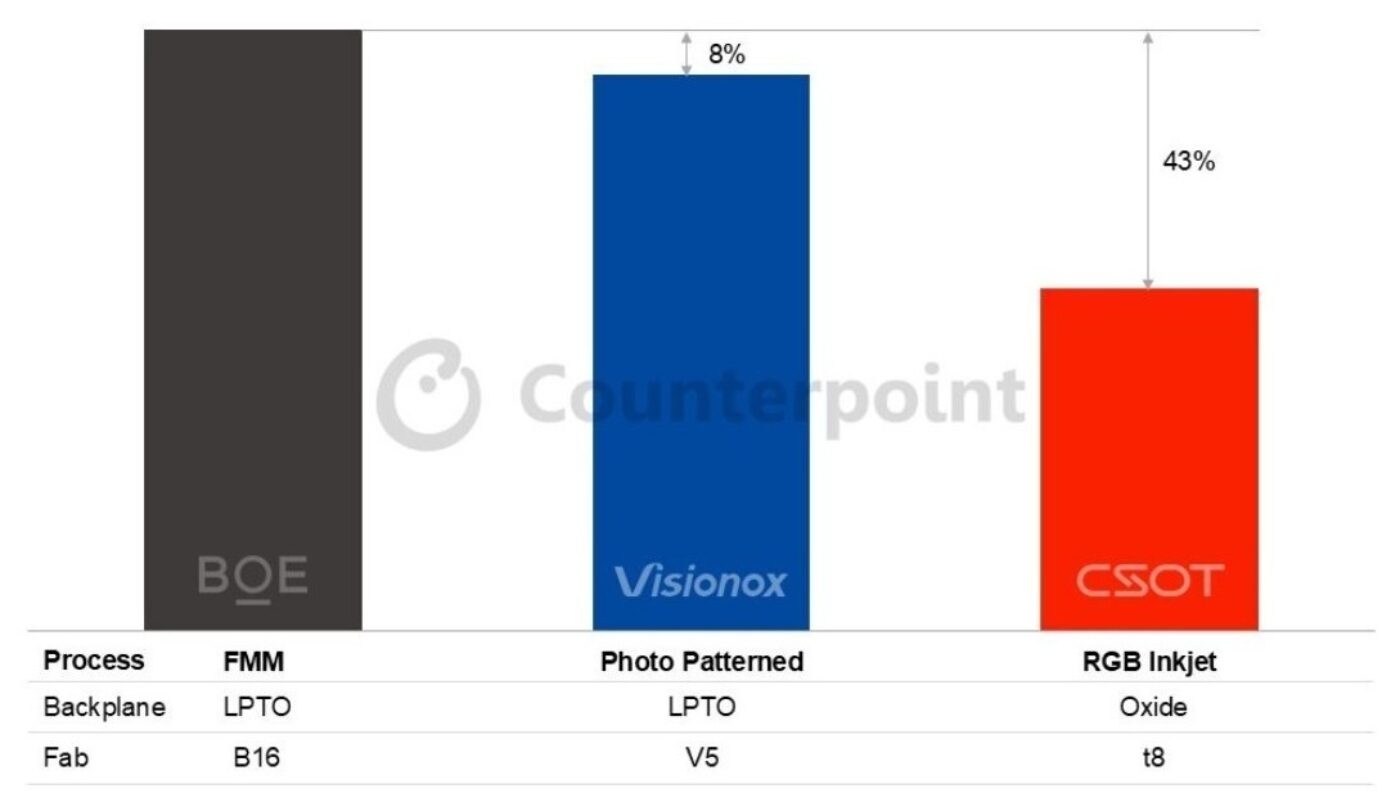
- VisionoxとCSOTは現在注目を集める新たなOLED成膜方式を採用すると見られる。ただし、フォトパターニングOLEDとファインメタルマスク (FMM) の設備投資の差はごくわずかである。
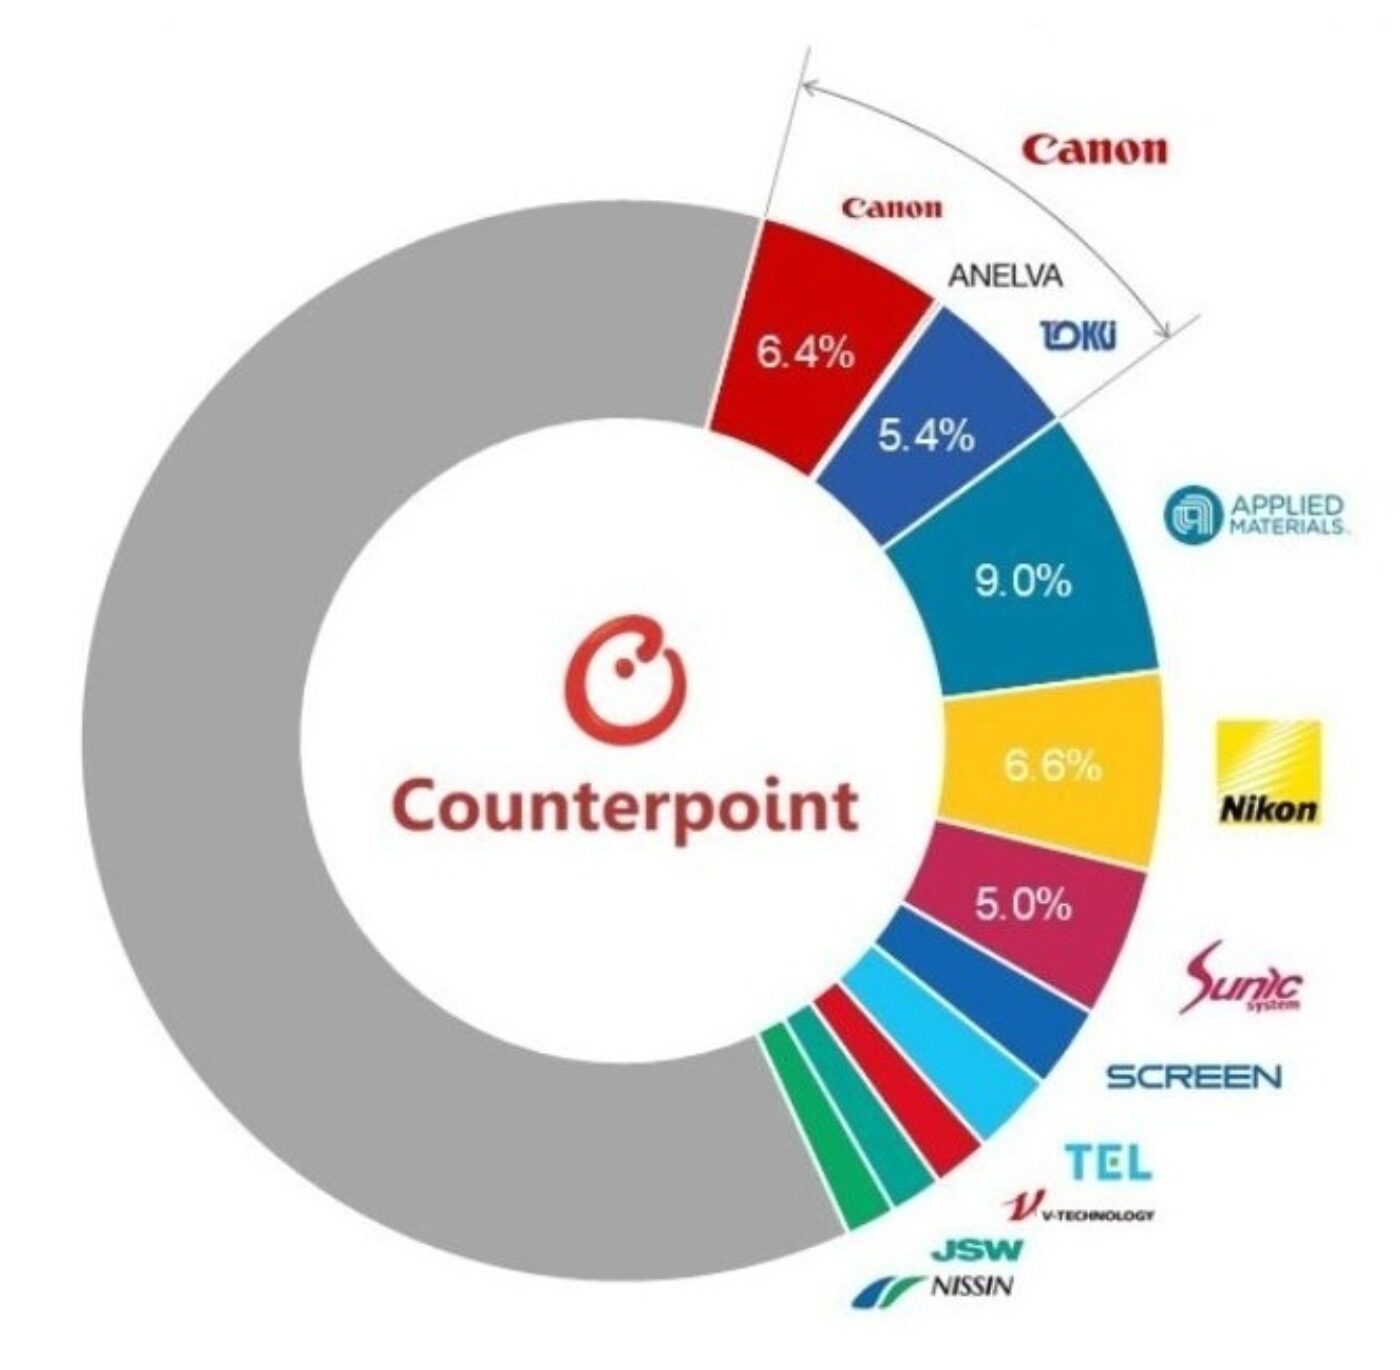
- Canon (TokkiとAnelvaを含む) 、Applied Materials、NikonがFPD製造装置市場で引き続き主導的地位を維持し、出荷額シェアは合計で28%になると予測されている。
OLEDとLCDの需要がIT、自動車、スマートフォンの各用途に加えてXR (AR/VR/MR) など新興分野でも拡大しており、FPDメーカー各社は設備投資を拡大している。Counterpoint Researchの「Display 360 Service」の一部である Quarterly Display Capex and Equipment Market Share Report 最新版によると、2020年-2027年の世界FPD設備投資額は累計758億ドルに達すると予測されている。
技術別および主要新プロセス別の設備投資額
こうした大規模設備投資をけん引する主要技術はOLEDであり、LCDとMicro-OLEDが続く。2025年にはOLED関連設備投資の前年比31%増が見込まれる一方、LCD投資は前年比45%減が予測されている。2025年から2027年にかけて、OLEDは第8.7世代IT用OLEDおよび第6世代の新技術にけん引され、総投資額の80%を占めると見込まれる一方、LCDのシェアはわずか17%に低下すると予測されている。
FPD設備投資推移 (2020年-2027年累積ベース)
これまで、第6世代 (1500×1850 mm) 生産ラインを保有するOLEDメーカーの大半は、歩留まりの安定とファインメタルマスク (FMM) 技術の進展を背景に、成膜方式を変更することなく第8.7世代 (2290×2620 mm) へと拡張してきた。
しかし、中国の第8.7世代FPDメーカーは、FMM以外の技術を採用する方向に進んでいる。シニアアナリストのJayden Leeは「VisionoxのV5ラインはフォトパターニングOLED技術を採用しており、CSOTのt8ラインはRGBインクジェットOLEDを採用する見込みである。従来のFMMとは異なり、この蒸着方法の変更は、次世代OLEDにおける競争優位性とコスト優位性を両立させるための取り組みと見られている」とコメントしている。
Counterpoint Researchは Quarterly Display Capex and Equipment Market Share Report で設備投資状況を詳細に追跡しており、各プロセス技術のメリットとデメリットを示している。FMM、マスクレス (フォトパターニング) 、RGBインクジェット技術に関する最近の調査結果について、Jayden Leeは「BOEが採用しているFMMと、Visionoxが採用しているフォトパターニングプロセスの設備投資額には、現時点では大きな差は見られない。ただし、これらのプロセスに対する全体的な設備投資には、時間の経過とともに影響を及ぼす留意点がいくつか存在する。TCL CSOTのインクジェット技術は低コストという点で優れているが、主要製品カテゴリーへの拡大にはインクジェット解像度の向上が求められる。この点は、中国拠点のFPDメーカーが韓国の同業他社に対抗し続けるために不可欠な要素となる」と説明している。
主要企業のプロセス比較
主要FPD製造装置メーカーが設備投資をけん引
FPD製造装置サプライチェーンは半導体製造装置とは異なり、長大かつ断片化している。Counterpoint Researchでは、このサプライチェーンにおける170社以上の装置メーカーを把握している。日本の装置メーカーが長らくこの分野を支配してきたが、世代交代のたびに新興メーカーの台頭とともに業界集約の兆しが見られるようになっている。こうした動きの背景には、地政学的な環境の変化や、現地メーカーを支える中国ベースのサプライチェーンの台頭がある。
Canon (TokkiとAnelvaを含む) は2025年の出荷額が前年比9%増で市場シェア12%を獲得し首位を維持すると見られている。Applied Materials の市場シェアはやや低下し9%となる見込みだが、出荷額ベースで引き続きFPD製造装置メーカー第2位を維持する見通しだ。Nikonも市場シェア縮小の見通しで、今年の出荷額は前年比22%減と予測されている。
Sunic、Nissin、Screen、Viatron、Suzhou Xinda は市場全体より高い成長率を示しており、先行メーカーから急速にシェアを奪っている。上位20社の内訳を見ると、日本が8社、韓国が7社、中国が4社、米国が1社となっている。
2025年 FPD製造装置メーカー別 出荷額シェア予測
同レポートには、Counterpoint ResearchのOLED/LCD/Micro-OLEDの生産ラインスケジュール、OLED/LCDの生産能力、LCD/OLED/Micro-OLEDの製造装置市場規模、市場シェア、80の異なるセグメントに関する予測を掲載している。生産ラインおよび装置タイプ別の受注実績と出荷数を提示するとともに、FPD製造装置メーカー130社以上の四半期別出荷額も提供している。また、主要プロセス別の典型的プロセスフローの情報も含まれている。
出典調査レポート Quarterly Display Capex and Equipment Market Share Report の詳細仕様・販売価格・一部実データ付き商品サンプル・WEB無料ご試読は こちらから お問い合わせください。
[原文] Global Display Equipment Spending to Climb to $76 Billion During 2020-2027
- Display equipment spending is expected to reach a cumulative $76 billion during 2020-2027.
- OLED will continue to contribute the lion’s share of these capex investments, with 31% YoY growth in 2025 alone.
- Visionox and CSOT are expected to adopt a new deposition method for OLED, which is currently the talk of the town. However, the capex difference between Photo Patterned OLED and Fine Metal Mask (FMM) is negligible.
- Canon (including Tokki and Anelva), Applied Materials and Nikon are expected to continue leading the display equipment market, with a combined revenue share of 28%.
With the growing demand for OLED and LCD displays from the IT, automotive and mobile phone sectors, as well as emerging categories such as XR (AR/VR/MR), display manufacturers have been ramping up their equipment capex. Global display equipment spending for the 2020-2027 period is expected to reach a cumulative $75.8 billion, according to the latest Quarterly Display Capex and Equipment Market Share Report, part of Counterpoint Research’s Display 360 Service.
Spending by technologies and key new processes
The major technologies driving these significant capex investments are OLED, followed by LCD and Micro-OLED. In 2025, OLED-related equipment spending is expected to increase by 31% YoY, while LCD spending is projected to decline by 45% YoY. From 2025 to 2027, OLED is forecasted to account for 80% of total investments, driven by new Gen 8.7 IT OLED and Gen 6 technologies, while LCD is expected to slip to a meagre 17% share.
Until now, most OLED manufacturers with Gen 6 (1500x1850 mm) fabs have expanded to Gen 8.7 (2290x2620 mm) without changing the method of deposition, backed by stable yields and advancements in Fine Metal Mask (FMM) technology.
However, China’s Gen 8.7 panel suppliers are looking to adopt technologies other than FMM. Senior Analyst Jayden Lee said, “Visionox’s V5 fab has selected Photo Patterned OLED technology, while CSOT’s t8 line is likely to adopt RGB Inkjet OLED. Unlike conventional FMM, this shift in evaporation methods is seen as an effort to secure both a competitive edge and cost advantages for next-generation OLED panels.”
Counterpoint Research closely tracks the capex investments and highlights the advantages and disadvantages of different process technologies in its quarterly Display Capex Report. Highlighting recent research findings on FMM, mask-less (Photo Patterned) and RGB Inkjet technologies, Lee noted, “At this point, we don’t see a significant capex difference between the FMM and Photo Patterned processes adopted by BOE and Visionox, respectively. However, there are some caveats that will influence the overall capex investments for these processes over time. TCL CSOT’s approach with inkjet scores well on lower costs but will need to improve inkjet resolution moving forward to scale across key categories. This will be critical for China-based display vendors to continue challenging their South Korean counterparts.”
Key equipment makers capturing display capex investments
The display equipment supply chain is long and fragmented, unlike that of semiconductor fab equipment. We track more than 170 different equipment vendors in the display equipment supply chain. Japanese equipment makers have been dominating this industry, but signs of consolidation have emerged with each generation, along with the rise of new suppliers, thanks to the geopolitical climate and the rise of China-based supply chains to support local manufacturers.
Canon (including Anelva and Tokki) is expected to continue leading the market, with its revenues projected to grow 9% YoY and capture 12% market share in 2025. Applied Materials will see its market share slip a bit to 9% but it will remain the second-largest display equipment maker in terms of revenue. Nikon will also see its market share erode, with revenues forecasted to decline 22% YoY this year.
Sunic, Nissin, Screen, Viatron and Suzhou Xinda are among the companies growing faster than the market and rapidly capturing share from incumbents. Among the top 20 companies, 8 are from Japan, 7 from South Korea, 4 from China, and 1 from the US.
The above-mentioned report includes all of Counterpoint’s content on OLED, LCD, and Micro-OLED fab schedules, OLED and LCD capacity, and LCD, OLED, and Micro-OLED equipment market sizes, market shares, and forecasts for 80 different segments. All design wins and units by fab by equipment type are shown and quarterly revenues are provided for over 130 different display equipment suppliers. Also included are typical process flows for each major process.