トランプ関税で電子機器サプライチェーンが大きくシフト~中国からの輸入急減でベトナムが最大の勝者に
これらCounterpoint Research FPD部門 (旧DSCC) 発の分析記事をいち早く無料配信するメールマガジンにぜひご登録ください。ご登録者様ならではの優先特典もご用意しています。【簡単ご登録は こちらから 】
トランプ関税で電子機器サプライチェーンが大きくシフト、中国からの輸入急減でベトナムが最大の勝者に
世界の電子機器サプライチェーンが、トランプ大統領の関税政策への対応に追われている。輸入は2025年第1四半期の急増に続いて第2四半期も力強いペースで推移したが、中国依存からは大きく転換している。この記事の分析は米国国際貿易委員会 (US ITC) 発表の輸入データに基づいているが、電子機器サプライチェーンはすでに関税引き上げに対応し、中国からベトナム、インドなど他国への輸入シフトが進んでいることが示唆されている。
米国統一関税表 (HTS) はすべての製品を関税コード毎に詳細に規定しており、その第85類にはTV、スマートフォン、その他大半の電子機器が含まれる (ただしPCは第84類に分類される) 。2023年および2024年のデータでは典型的な季節的パターンが確認でき、年内の各四半期で輸入量が増加、第4四半期にピークを迎え、その後第1四半期に減少する傾向が見られる。
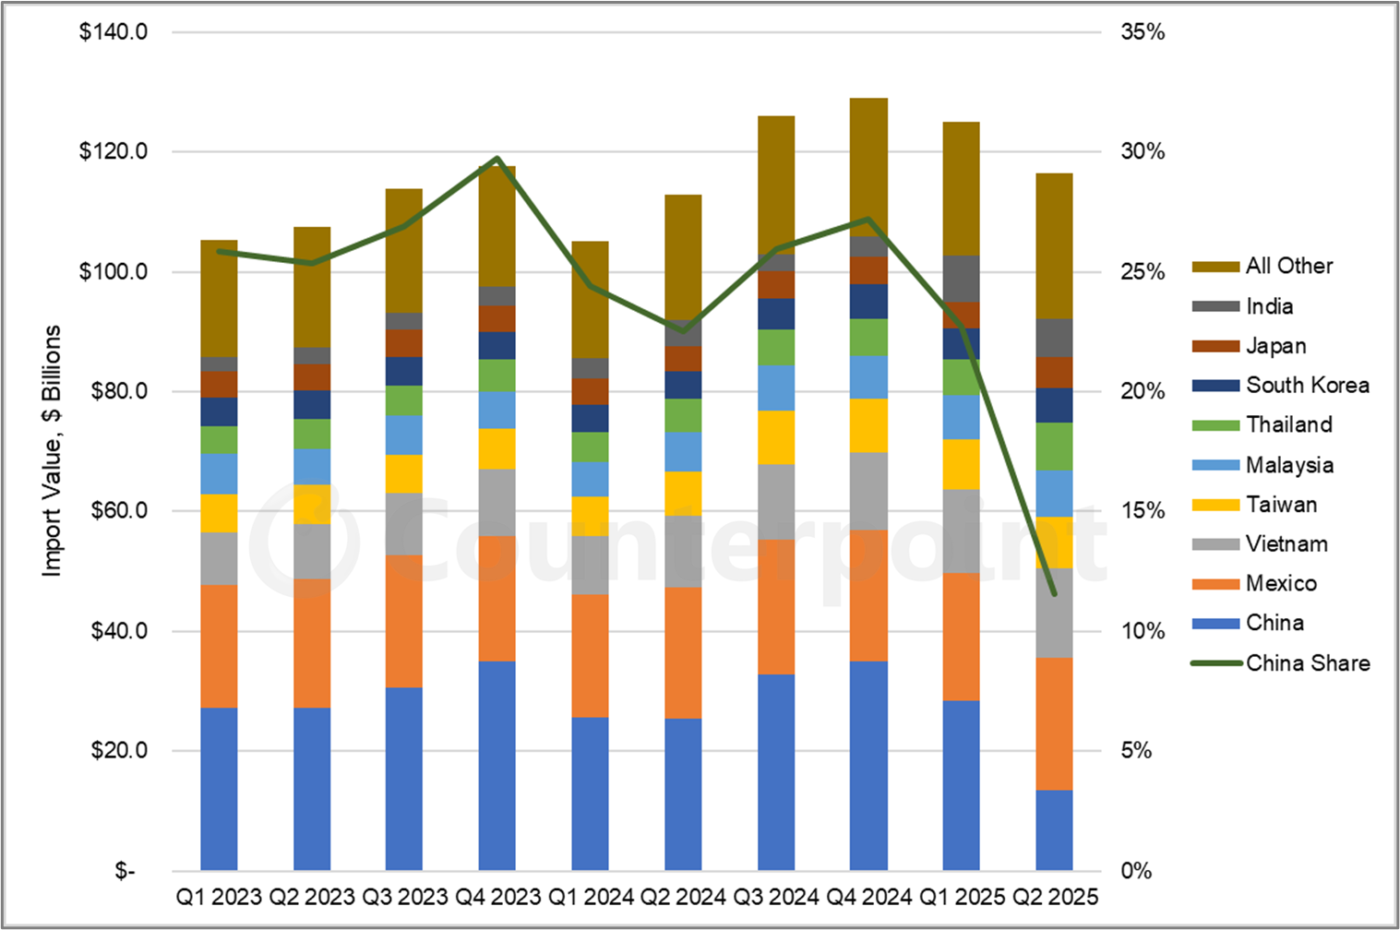
米国はQ2'25に、第85類に分類される製品を1170億ドル分輸入したが、これは前期比で7%減少、前年比では3%の増加である。国別に見ると、中国からの輸入が前期比52%減、前年比47%減となった一方、メキシコからの輸入は前期比3%増、前年比では横ばいだった。その一方で、米国向け第85類製品の輸出上位国リストで第3位から第9位に位置する国々からの輸入は、2025年第2四半期に大幅に増加している。
- ベトナム:前年比26%増の150億ドル
(ベトナムは中国を抜いて第85類輸入で第2位に浮上) - 台湾:前年比17%増の86億ドル
- タイ:前年比 46%増の81億ドル
- マレーシア:前年比16%増の77億ドル
- インド:前年比48%増の63億ドル
- 韓国:前年比21%増の56億ドル
- 日本:前年比27%増の53億ドル
米国のHTS第85類品目 輸入額推移 (相手国別)
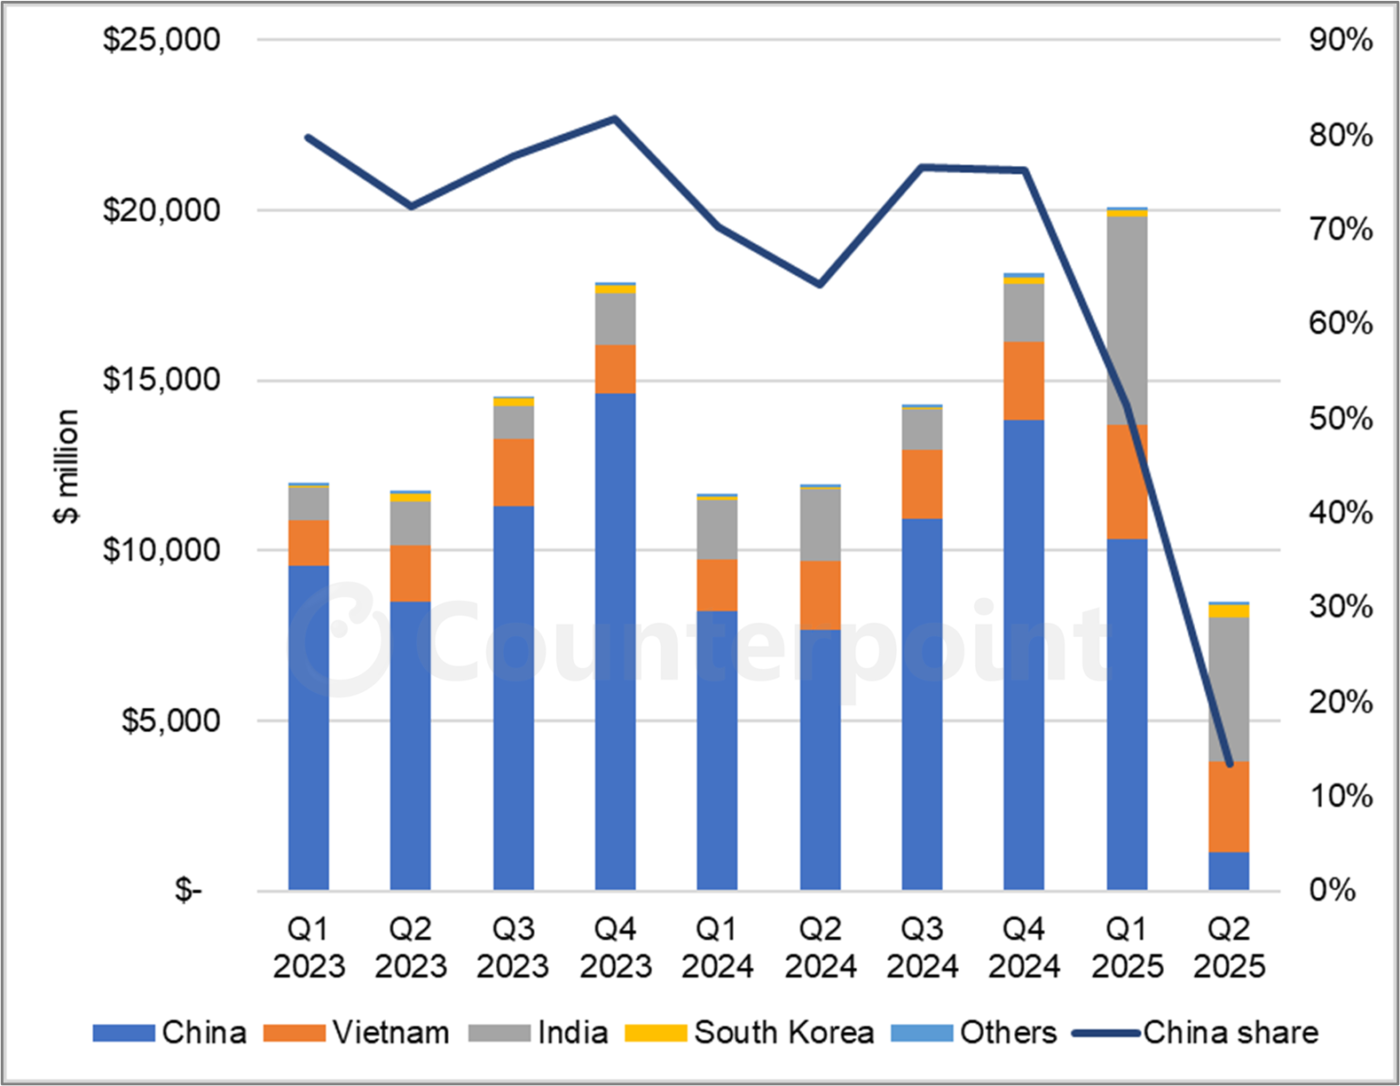
電子機器のうち最大の収益を生むカテゴリーはスマートフォンだが、スマートフォン輸入の数量と金額の推移を示すのが以下の2つのグラフである。
第85類のグラフと同様、2023年および2024年の四半期パターンを見ると、第4四半期にかけて増加しピークを迎え、その後第1四半期に減少する傾向が示されている。ところが、2025年のこれまでのパターンは大きく異なっている。スマートフォン輸入は第1四半期に前倒しとなり、第2四半期には急落した。四半期毎の数値を合算すると、数量ベースでは前年比3%増とほぼ近い水準となったが、金額ベースでは2025年上半期のスマートフォン輸入は前年比21%増となり、これはiPhoneなど高価格帯スマートフォンが多数輸入されたことを示唆している。主要国のQ2'25の数値は以下の通りである。
- 中国:数量は前年比84%減の390万台、金額は前年比85%減の11億ドル
- ベトナム:数量は前年比56%増の950万台、金額は前年比50%増の27億ドル
- インド:数量は前年比148%増の1110万台、金額は前年比109%増の42億ドル
- 韓国:数量は前年比477%増の64万5000台、金額は前年比23%増の3億7300万ドル
米国の携帯電話輸入推移 (相手国別)
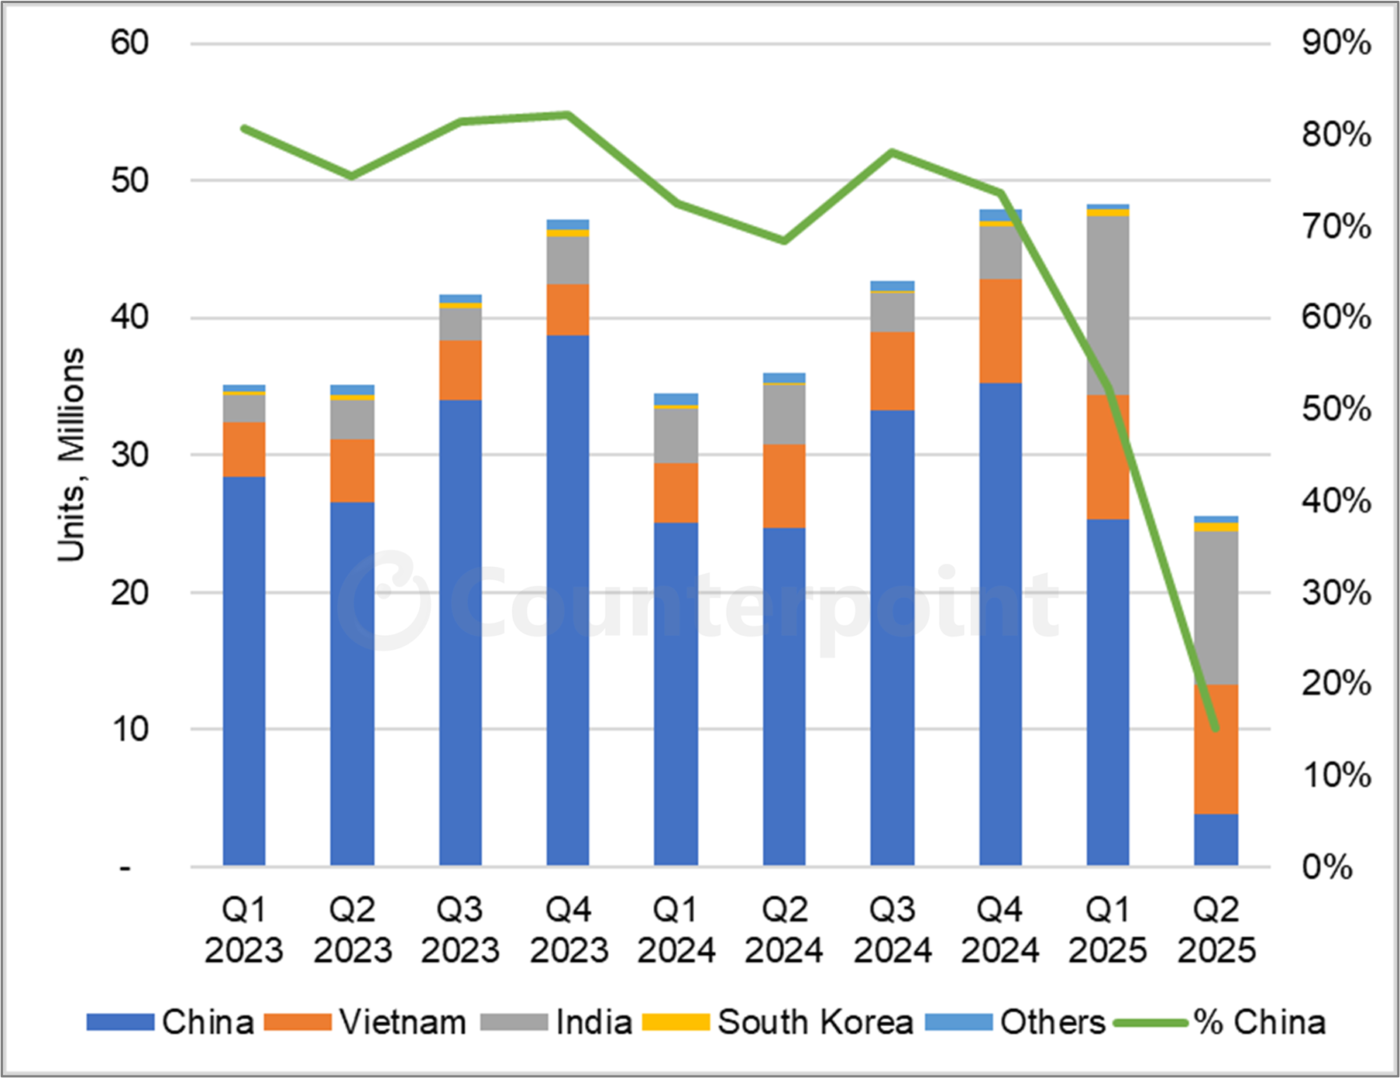
中国からのスマートフォン輸入シェアはここ数年、緩やかな減少傾向が続いており、数量ベースで前期比37%減、金額ベースで前期比38%減と大きく落ち込んだ。
インドからの1110万台という輸入数量は、Q2'25時点での同国のiPhone組立能力の総量を示していると考えられる。なお、インドはQ1'25に記録した1300万台のペースを維持できなかった。これは、生産分だけではなく、在庫を取り崩して前倒し出荷した結果だった可能性が高い。もし、インドにあるFoxconnのiPhone組立拠点がこれ以上の生産能力を増やせない場合、第3四半期には再び中国からの輸入が増加する可能性がある。
モバイルPCに話を移そう。モバイルPCの季節的なパターンはさほど明確ではないが、2023年から2024年にかけては第3四半期に輸入がピークを迎え、最も顕著な季節要因は第1四半期の低調さであった。2025年には関税を見越して輸入が第1四半期に前倒しされ、第2四半期には前期比で減少した。Q2'25のモバイルPC輸入は数量ベースで前期比5%減、前年比11%減、金額ベースでは前期比15%減、前年比13%減だった。前倒し効果は、第1四半期と第2四半期を合わせて見るとより明らかになる。2025年上半期全体のモバイルPC輸入は数量ベースで前年比横ばい、金額ベースでは前年比5%増だった。
国別の詳細を見ると、中国からベトナムへの輸入シフトがいかに劇的であったかが明らかになる。
- 中国:数量は前年比80%減の370万台、金額は前年比85%減の13億ドル
- ベトナム:数量は前年比151%増の1470万台、金額は前年比116%増の76億ドル
- 台湾:数量は前年比17%減の40万台、金額は前年比6%増の4億6300万ドル
- タイ:数量は前年比346%増の230万台、金額は前年比1793%増の9億6700万ドル
- その他:数量は前年比4875%増の170万台、金額は前年比194%増の5億4100万ドル
米国のモバイルPC輸入推移 (相手国別)
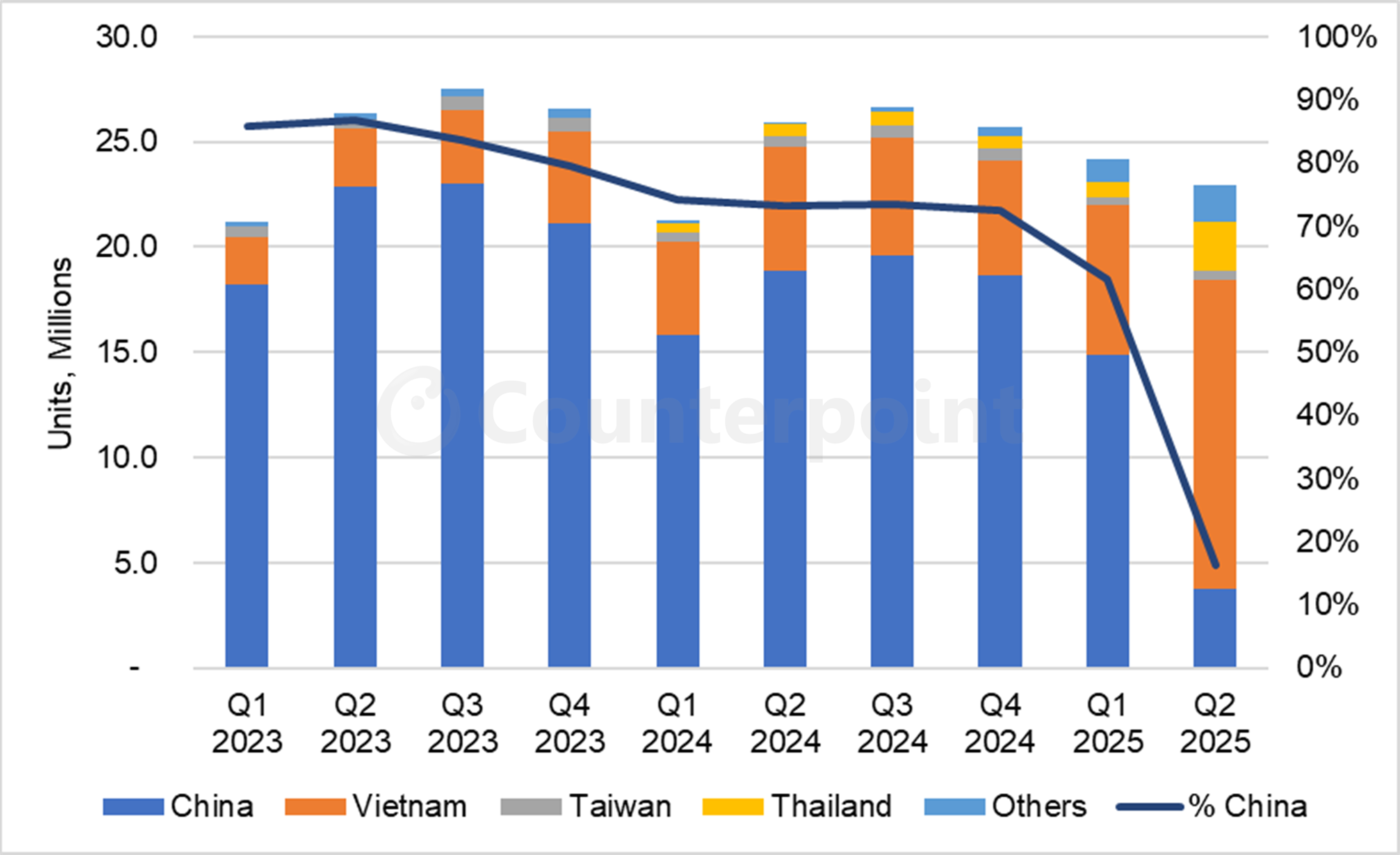
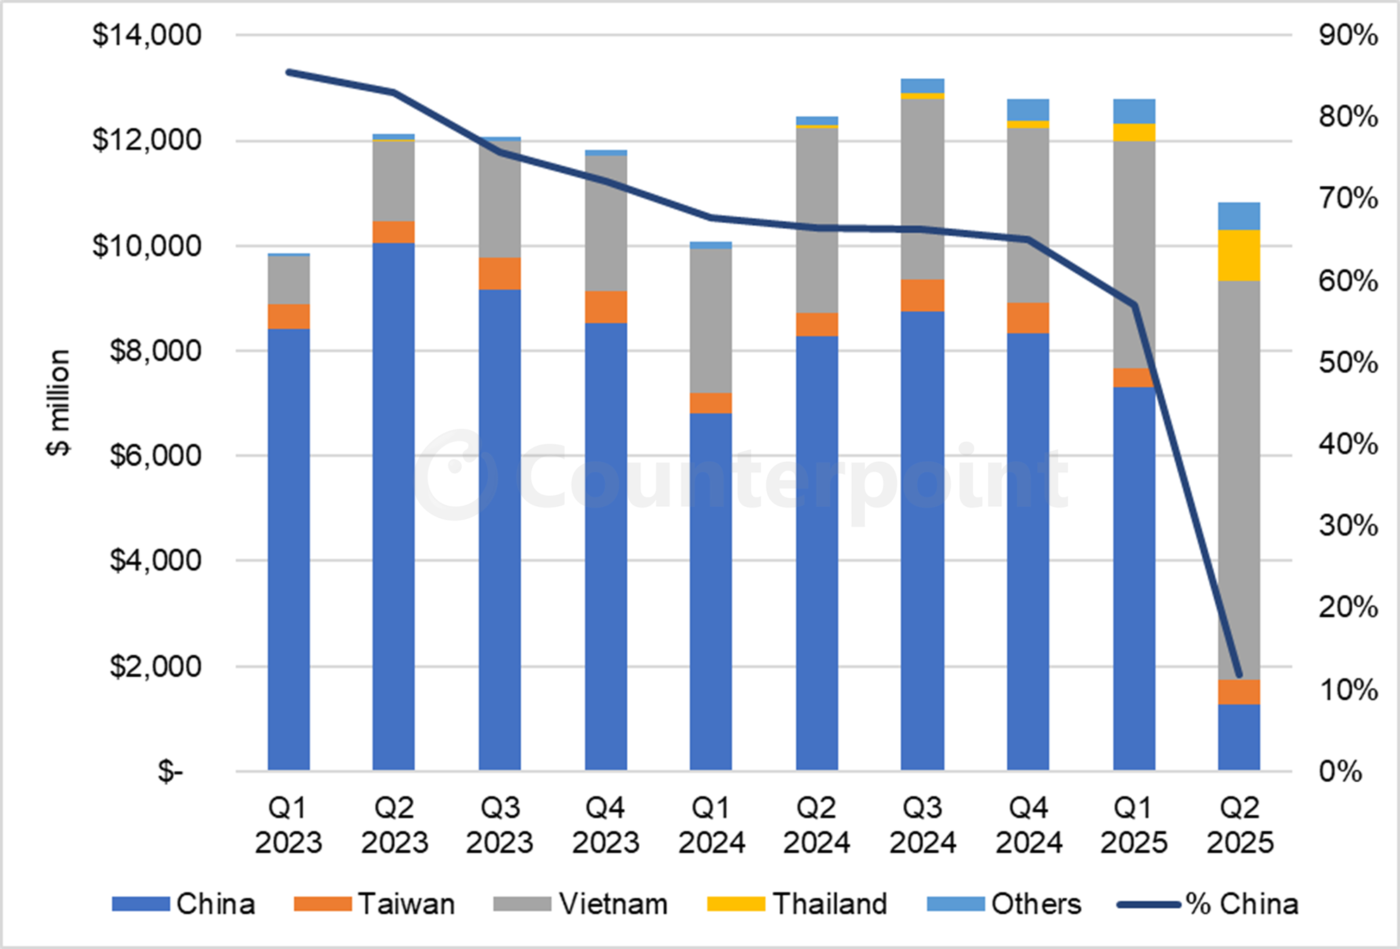
スマートフォンと同様ではあるが規模はさらに大きく、中国からのモバイルPC輸入シェアは数量ベースで前期比46%減、金額ベースで前期比45%減 と大幅に減少した。
一方、ベトナムからのモバイルPC輸入の急増については、同国で製造されたものではなく、中国で生産されたPCの積替え品なのではないかとの疑念が生じている。米国とベトナムの貿易協定では通常の関税率は20%と規定されているが、中国からの積替え品についてはより高い40%の関税率が適用されることになっている。ただし、相互関税の対象から除外されてきたモバイルPCにこの規定が適用されるかどうかは不明である。
[原文] Trump Tariffs Forced a Huge Shift in Electronics Supply Chain as China Imports Plummeted; Vietnam the Main Winner
The global supply chain for electronics has scrambled to adjust to President Trump’s tariff regime. After witnessing a surge in Q1 2025, imports continued at a strong pace in Q2, but with a big shift away from China. This analysis is based on import data released by the US International Trade Commission (ITC), showing that the supply chain for electronics has already reacted to the increased tariffs by shifting imports away from China and toward Vietnam, India and other countries.
The Harmonized Tariff Schedule (HTS) details all products with a tariff code, and Chapter 85 covers TVs, smartphones and most other electronic goods (except PCs, which are in Chapter 84). The typical seasonal pattern is evident in 2023 and 2024, an increase in each quarter during the year to a peak in Q4, followed by a drop in Q1.
The US imported Chapter 85 goods worth $117 billion in Q2 2025, a decrease of 7% QoQ but an increase of 3% YoY. In terms of countries, imports from China decreased 52% QoQ and 47% YoY, while imports from Mexico increased 3% QoQ and were flat YoY. On the other hand, Q2 2025 imports from countries taking the #3 to #9 spots in the list of top Chapter 85 goods exporters to the US increased dramatically.
- Vietnam: +26% YoY to $15.0 billion (Vietnam jumped ahead of China into the #2 spot for Chapter 85 imports)
- Taiwan: +17% YoY to $8.6 billion
- Thailand: +46% YoY to $8.1 billion
- Malaysia: +16% YoY to $7.7 billion
- India: +48% YoY to $6.3 billion
- South Korea: +21% YoY to $5.6 billion
- Japan: +27% YoY to $5.3 billion
The biggest single revenue category within electronics is smartphones, and the data for smartphone imports in units and revenue is shown in the next two charts.
As in the Chapter 85 chart, the quarterly pattern for 2023 and 2024 shows a build-up to a peak in Q4 and then a drop in Q1. The pattern thus far in 2025 is wildly different. Smartphone imports were pulled forward in Q1 and saw a steep drop in Q2. If we combine the quarterly numbers, the numbers come close in unit terms with a 3% increase YoY. In revenue terms, though, smartphone imports in H1 2025 increased 21% YoY, which suggests a lot of high-value smartphones (like iPhones) were imported. The Q2 2025 figures for the major countries were as follows:
- China: -84% YoY to 3.9 million and -85% YoY to $1.1 billion
- Vietnam: +56% YoY to 9.5 million and +50% YoY to $2.7 billion
- India: +148% YoY to 11.1 million and +109% YoY to $4.2 billion
- South Korea: +477% YoY to 645,000 and +23% YoY to $373 million
The share of smartphone imports from China, which has been on a slow downward trend for years, dropped by 37% QoQ in unit volume terms and by 38% in revenue terms.
The figure of 11.1 million smartphone imports from India likely represents the total capacity of that country for iPhone assembly as of Q2 2025. Note that India was not able to maintain the pace of 13 million smartphones set in Q1 2025, probably because that figure represented not only production but an inventory drawdown (via accelerated shipments). If Foxconn’s assembly sites in India for Apple’s iPhones cannot increase their capacity, then we may see imports from China increase in Q3.
Next, we shift to mobile PCs. The seasonal pattern for mobile PCs is less distinct, but in 2023-2024, imports peaked in Q3 and the most noticeable seasonal trend was a slow Q1. In 2025, imports were pulled into Q1 in anticipation of tariffs and decreased QoQ in Q2. Q2 2025 total imports of mobile PCs were down 5% QoQ and 11% YoY in units, and down 15% QoQ and 13% YoY in revenue. The pull-in effect becomes clear when we consider the first two quarters together. In the first half of 2025, total imports of mobile PCs were flat YoY in units and up 5% in revenue.
The country details reveal the dramatic shift in imports from China to Vietnam:
- China: -80% YoY to 3.7 million units and -85% YoY to $1.3 billion
- Vietnam: +151% YoY to 14.7 million units and +116% YoY to $7.6 billion
- Taiwan: -17% YoY to 0.4 million units and +6% YoY to $463 million
- Thailand: +346% YoY to 2.3 million units +1793% YoY to $967 million
- Others: +4875% YoY to 1.7 million units and +194% YoY to $541 million
As in smartphones, but to an even greater extent, the share of mobile PC imports from China fell by 46% QoQ in unit terms and by 45% QoQ in revenue terms.
The huge increase in mobile PC imports from Vietnam raises suspicions that the PCs are not manufactured in that country but represent transshipments of PCs made in China. The trade deal between the US and Vietnam set a standard tariff rate of 20% but a higher tariff rate of 40% for goods that were transshipped from China. It is unclear whether that would apply to mobile PCs, which have been exempted from the reciprocal tariffs.
