世界FPD生産能力、中国が2028年にシェア75%到達へ

出典調査レポート Quarterly Display Capex and Equipment Market Share Report の詳細仕様・販売価格・一部実データ付き商品サンプル・WEB無料ご試読は こちらから お問い合わせください。
これらCounterpoint Research FPD部門 (旧DSCC) 発の分析記事をいち早く無料配信するメールマガジンにぜひご登録ください。ご登録者様ならではの優先特典もご用意しています。【簡単ご登録は こちらから 】
世界FPD生産能力、中国が2028年にシェア75%到達へ
Counterpoint Researchが先週、Quarterly Display Capex and Equipment Market Share Report 最新版を発刊した。同レポートに掲載の調査結果に含まれる重要事項は以下の通り。
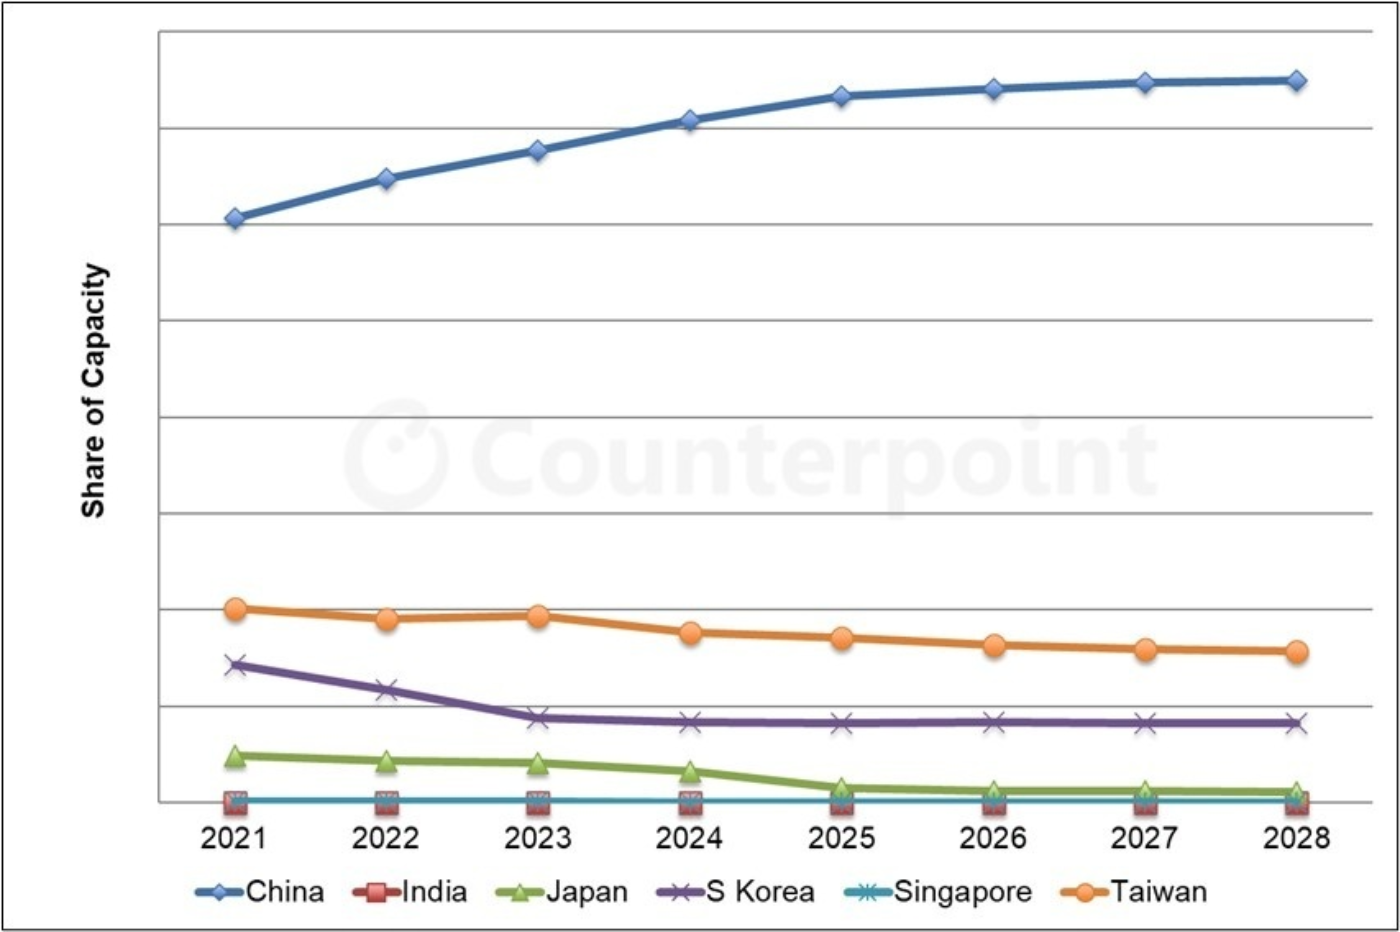
地域別FPD生産能力
- 中国がFPD生産能力で主導的ポジションを維持しており、そのシェアは2023年の68%から2028年には75%に拡大すると予測されている。中国の生産能力は2023年から2028年にかけて年平均成長率4.0%で増加する見通しである。
- 韓国のシェアは2023年の9%から2028年には8%に縮小すると予測されており、同期間の年平均成長率は0.6%の見通しである。
- 台湾の生産能力は2023年から2028年にかけて年平均成長率-2.3%の減少が予測されており、シェアは2023年の19%から2028年には16%に縮小の見通しである。
- Q3'24のSharpのSDP第10世代ラインと堺第4.5世代OLEDラインの閉鎖、Q2'25のJDIの鳥取LCDラインとQ2'26の茂原LCDラインの閉鎖により、日本のシェアは2023年の4%から2028年には1%に縮小すると予測されている。同期間の年間平均成長率は-21.3%の見通しである
- インドでは投資が2028年以降に延期の見通しで、操業開始は2030年になると見られる。
用途別FPD生産能力
- TV/IT用LCDが予測期間中、2028年までシェア73%以上で支配的ポジションを維持、モバイル/IT用LCDがシェア14%以上で続く。
- モバイル/IT用OLEDは2028年までにシェア7%に上昇、TV/IT用OLEDはシェア4%を維持する。
- 2023年から2028年にかけて最も高い成長率を示すのはモバイル/IT用OLEDで、年平均成長率は6.7%と予測される。TV/IT用OLEDが2.6%、TV/IT用LCDが2.4%で続く。
FPD生産能力
BOEはFPD総生産能力で大きな優位を維持すると見込まれるが、2023年から2028年までの年平均成長率はわずか1.6%にとどまる見通しだ。China Starは2022年にLGDを上回って第2位に浮上した。2023年には、LGDのLCD生産能力縮小によってHKCがLGDを抜いた。TianmaはTM18およびTM19により最も高い成長率が見込まれ、年平均成長率20%で2028年にはシェア3%を獲得すると予測される。
------------------------------------
Quarterly Display Capex and Equipment Market Share Report には、Counterpoint ResearchのOLED/LCD/Micro-OLEDの生産ラインスケジュール、OLED/LCDの生産能力、LCD/OLED/Micro-OLEDの製造装置市場規模、市場シェア、80の異なるセグメントに関する予測を掲載しています。生産ラインおよび装置タイプ別の受注実績と出荷数を提示するとともに、FPD製造装置メーカー130社以上の四半期別出荷額も提供しています。また、主要プロセス別の典型的プロセスフローの情報も含まれています。
出典調査レポート Quarterly Display Capex and Equipment Market Share Report の詳細仕様・販売価格・一部実データ付き商品サンプル・WEB無料ご試読は こちらから お問い合わせください。
[原文] China’s Share in Global Display Capacity to Reach 75% in 2028
Counterpoint released its latest capacity report last week. The report has a number of important findings.
Regional display capacity
- China is still expected to dominate display capacity, growing from a 68% share in 2023 to 75% in 2028. China’s capacity is expected to grow at a 4.0% CAGR from 2023 to 2028.
- South Korea’s share is expected to fall from 9% in 2023 to 8% in 2028, on a 0.6% CAGR.
- Taiwan’s capacity is expected to fall at a -2.3% CAGR from 2023 to 2028, with its share falling from 19% in 2023 to 16% in 2028.
- Japan’s share is expected to fall from 4% in 2023 to 1% in 2028 due to Sharp’s closure of SDP G10 and Sakai G4.5 OLED in Q3 2024, JDI Tottori LCD in Q2 2025 and Mobara LCD in Q2 2026, on a -21.3% CAGR from 2023 to 2028.
- India is expected to delay the investment until after 2028, with operations expected to begin in 2030.
Capacity by application
- LCD TV/IT will continue to dominate during the forecast period with a share of at least 73% through 2028, followed by LCD mobile/IT with a share of at least 14%.
- OLED mobile/IT will rise to a 7% share by 2028, while OLED TV/IT will maintain a 4% share.
- OLED mobile/IT is expected to enjoy the fastest growth from 2023 to 2028 at a 6.7% CAGR, followed by OLED TV/IT at 2.6% and LCD TV/IT at 2.4%.
Display capacity
BOE is expected to maintain a large advantage in total display capacity, but its CAGR from 2023 to 2028 is now expected to be just 1.6%. China Star surpassed LGD in 2022 to rank second. In 2023, HKC surpassed LGD as LGD reduced its LCD capacity. Tianma is expected to grow the fastest with TM18 and TM19, rising at a 20% CAGR to capture a 3% share in 2028.
The abovementioned report includes all of Counterpoint’s content on OLED, LCD and Micro-OLED fab schedules, OLED and LCD capacity, LCD, OLED and Micro-OLED equipment market sizes, and market shares and forecasts for 80 different segments. All design wins and units by fab by equipment type are shown and quarterly revenues are provided for over 130 different display equipment suppliers. Also included are typical process flows for each major process.