Q1'22 明暗分かれたFPD製造装置メーカー業績
Published June 13, 2022
Logout
冒頭部和訳
Q1'22はFPD製造装置業界にとって複雑な四半期となった。先週発刊の Quarterly Display Supply Chain Financial Health Report (一部実データ付きサンプルをお送りします) に記載の通り、ポジティブな結果とネガティブな結果が報告されている。
ポジティブな結果は以下の通りである。
- 上場FPDメーカー13社のFPD設備投資額は前期比10%増の55億ドルとなった。これはQ1’21以来最も高い値で、China StarとBOEがそれぞれ10億ドルを超え、LGDは10億ドルをわずかに下回った。
- 民間企業設備投資額も前期より増加し、総設備投資額は前期比50%増の81億ドルと推定される。
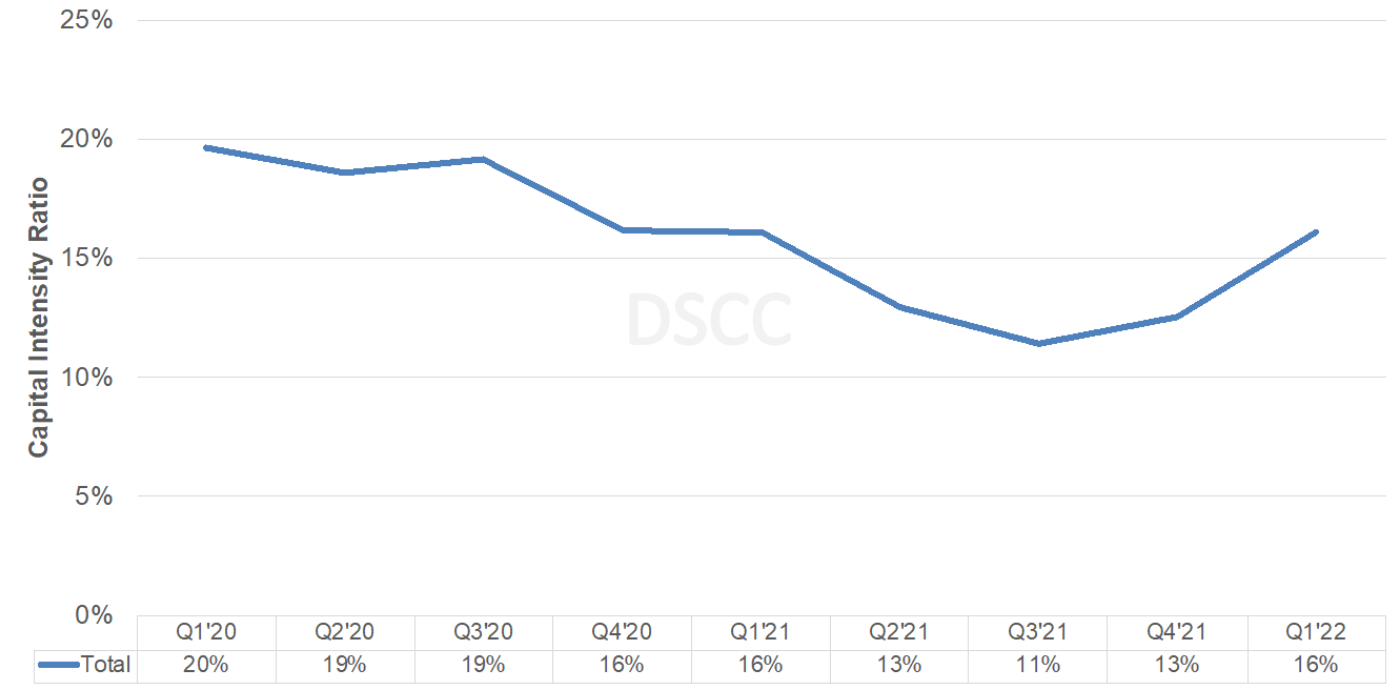
- 資本集約度は4四半期連続の下落後に2四半期連続で上昇、Q4’21の13%からQ1’22には16%に上昇した。価格低下によるFPD収益の減少が大きな要因となっている。
- 設備投資額は設置ベースで前期比33%増だった。
- このレポートで追跡した19社のFPD製造装置メーカー収益は前期比2%増となった。各社は現地の報告要件に応じて収益を認識しており、設置ベースの場合と設備導入ベースの場合があることに留意が必要である。上記の差違はこれで説明できる。これら企業の収益合計は2%減となっている。
- 追跡対象のうち、収益が前期より増加したのは10社、減少したのは9社だった。
- 流動性が課題となっているのはInveniaだけだが、同社の負債/資本は2019年の200%以上からQ1’22には90%に低下しており、状況は継続的に改善している。半導体業界の利益率が高く業績が好調であることから、装置メーカー各社の財政状態は強力で、純負債/資本がプラスの企業は5社だけだった。
Mixed Quarter for Display Equipment Suppliers
Q1’22 was a mixed quarter for display equipment suppliers with some positive and negative results as seen in our Quarterly Display Supply Chain Financial Health Report published last week.
Positive developments included:
- Display capex from 13 publicly traded display companies rose 10% Q/Q to $5.5B, the highest value since Q1’21 with China Star and BOE both over $1B and LGD right under $1B.
- Estimated private company capex was also up Q/Q resulting in total capex up 50% Q/Q to $8.1B.
- Capital intensity rose for the second straight quarter after falling for four straight quarters. It rose from 13% in Q4’21 to 16% in Q1’22, with lower display revenues due to lower prices a large factor.
- Equipment spending on an install basis rose 33% Q/Q.
- Display equipment revenues for the 19 companies tracked in this report, rose 2% Q/Q. It should be emphasized that suppliers recognize revenues using different methods depending on their local reporting requirements, with some recognizing them on an install basis and some on a move-in basis, which accounts for the differences above. Total revenues for these companies fell 2%.
- Revenues for 10 companies we track rose Q/Q with nine seeing declines.
- Liquidity is not an issue for our list of companies except at Invenia although their situation continues to improve with debt/equity falling from over 200% in 2019 to 90% in Q1’22. Only five companies had positive net debt/equity as equipment suppliers are in strong financial positions due to their high margins and strong performance from the semiconductor industry.
Publicly Traded Manufacturers Display Manufacturers’ Capital Intensity
Negative developments included:
- Margins worsened across all parameters except for operating margins, but remain at elevated levels on strength in semiconductor equipment:
- Gross margins fell from 44.8% to 44.1%;
- Operating margins rose from 19.5% to 19.7%;
- Display equipment operating margins fell from 11.8% to 11.5%;
- EBITDA margins fell from 23.9% to 23.0%;
- Pre-tax profit margins fell from 19.6% to 19.3%;
- Net margins fell from 16.2% to 15.0%.
- Backlog fell 5% Q/Q and 4% Y/Y to $1.4B, the lowest level since Q2’21.
- Operating cash flow fell 84% Q/Q and 77% Y/Y to $783M due to large drops at AMAT, Canon and Tokyo Electron, due to inventory, accounts receivable, etc. AMAT still led though followed by SCREEN, Canon and Nikon. Four companies experienced negative operating cash flow with TEL at -$320M. TEL indicated their drop in operating cash flow was mainly due to a large increase in accounts receivable.
- Free cash flow went from $3.8B in Q4’21 to -$78M in Q1’22 due to large declines at AMAT and TEL.
In terms of the results by company:
- AMAT was #1 for the third consecutive quarter with Canon #2 for the second straight quarter and ULVAC #3 for the third straight quarter. Nikon rose from #6 to #4 while TEL fell from #4 to #5. Companies gaining at least a point of market share included Canon, ULVAC, Nikon, V Tech. and SCREEN. Companies losing at least a point of share included TEL, AP Systems, Invenia and AVACO. Only six companies had Y/Y growth led by Jusung and HB Solution at over 300%. Nikon and TEL had large Y/Y declines at -37% and -40% respectively on lower LCD spending. Of the 19 companies we are tracking, eight earned at least 50% of their revenues from display equipment, one less than last quarter as HB Tech moved to <50%. However, the blended share rose slightly from 6.9% to 7.1% after falling from 13% in Q4’20.
- For display revenues, SCREEN had the highest Q/Q growth while Jusung had the highest Y/Y growth.
Written by