FPDバリューチェーンの在庫分析~在庫過剰はFPD業界への強い逆風に
冒頭部和訳 (一部補筆)
FPDバリューチェーン全体の在庫水準が高すぎると価格に圧力がかかり続けることになり、2022年下半期には業界生産が急激に減速する可能性がある。パンデミックの初期にはFPDバリューチェーン全体で需要が急増し、供給不足や輸送の問題も重なったが、パンデミックの終焉後は在庫が山積みになる方向に進み始めた。需要がピークを過ぎた今、通常の需給バランスを回復する前にその大きな山を消費する必要がある。
Excess Inventory Acts as a Gale-Force Headwind for Display Industry
Excessively high inventory throughout the flat panel display value chain will continue to put pressure on prices and will likely lead to a sharp slowdown in industry production in the second half of 2022. Throughout the display value chain, the surge in demand generated during the pandemic’s early days, combined with shortages and transportation problems, set in motion a path toward building a mountain of inventory. Now that the pandemic demand peak has passed, that big mountain needs to be consumed before a normal supply/demand balance can be restored.
A profit warning from US retailer Target on Tuesday, June 7th led to a sharp selloff in US retailer stocks and highlighted this issue among US retailers. Target CEO told the Wall Street Journal that Target was “chasing hard in 2021 to get more of the inventory that our guest was looking for.” In order to bring inventory under control, Target plans a summer of heavy discounts, “especially in categories that Target is carrying too much of, such as kitchen appliances, TVs and outdoor furniture,” per the WSJ. Target lowered its guidance for operating margin for 2022 in anticipation of discounting actions that will reduce margins.
Among US retailers, Target could be considered a second-tier vendor in the electronics space. While Target does not disclose its revenues for specific product segments like electronics, an analysis of the company’s typical floor space suggests that electronics form only about 2-3% of the company’s revenue, which in 2021 was $106B. That means the company has only about a 1% share of US consumer hardware. A look at the larger players in the industry, though, demonstrates that the problem of excess inventory is not limited to Target, but is industry wide.
The three biggest retailers in the US for consumer technology hardware are Best Buy, Walmart and Amazon. The companies have very different strategies for approaching the market, but each has been successful in its own way. All three companies have built inventory, according to their latest financial releases, as we will show starting with Best Buy.
First a note on the metrics used in this analysis. We look at inventory, payables and receivables normalized to the number of days represented. So, for example 60 days of payables means that the company typically takes 60 days to pay vendors. Inventory days are calculated on the basis of future sales, because that’s what they represent, while receivables and payables are based on past sales and purchases, respectively. An important metric for retailers is the Cash Conversion Cycle (CCC), calculated as inventory plus receivables minus payables. The CCC indicates how quickly the retailer turns a sale into cash.
Best Buy could be considered the most traditional of the three retailers, with a substantial brick-and-mortar presence and a mix of product that tends toward the upscale. The company’s Magnolia Hifi store-within-a-store focuses on premium home theater equipment. During the pandemic, Best Buy was successful even when stores were closed to in-person shopping with its BOPUS approach – buy online, pick up at store. Its business is highly seasonal with a strong peak in its fiscal Q4, which runs from November through the end of January.
The first chart here shows Best Buy’s current asset balances and CCC from 2018 until the end of Q1’22. Because of the strong seasonality of BBY’s business, the payables and receivables have seasonal patterns. Payables tend to peak in Q3 (end of November, per the company’s fiscal calendar) as the company builds inventory for the Christmas selling season. In normal times (as shown by 2018-2019), Best Buy inventory also tends to be around 60 days. The surge in demand at the beginning of the pandemic, particularly fueled by US government subsidy checks, pulled the company’s inventory down to 40 days at the end of July 2020, and to a low of 37 days at the end of April 2021. At that level of inventory, stock-outs were common for popular items like TVs.
Best Buy Current Assets, 2018-2022
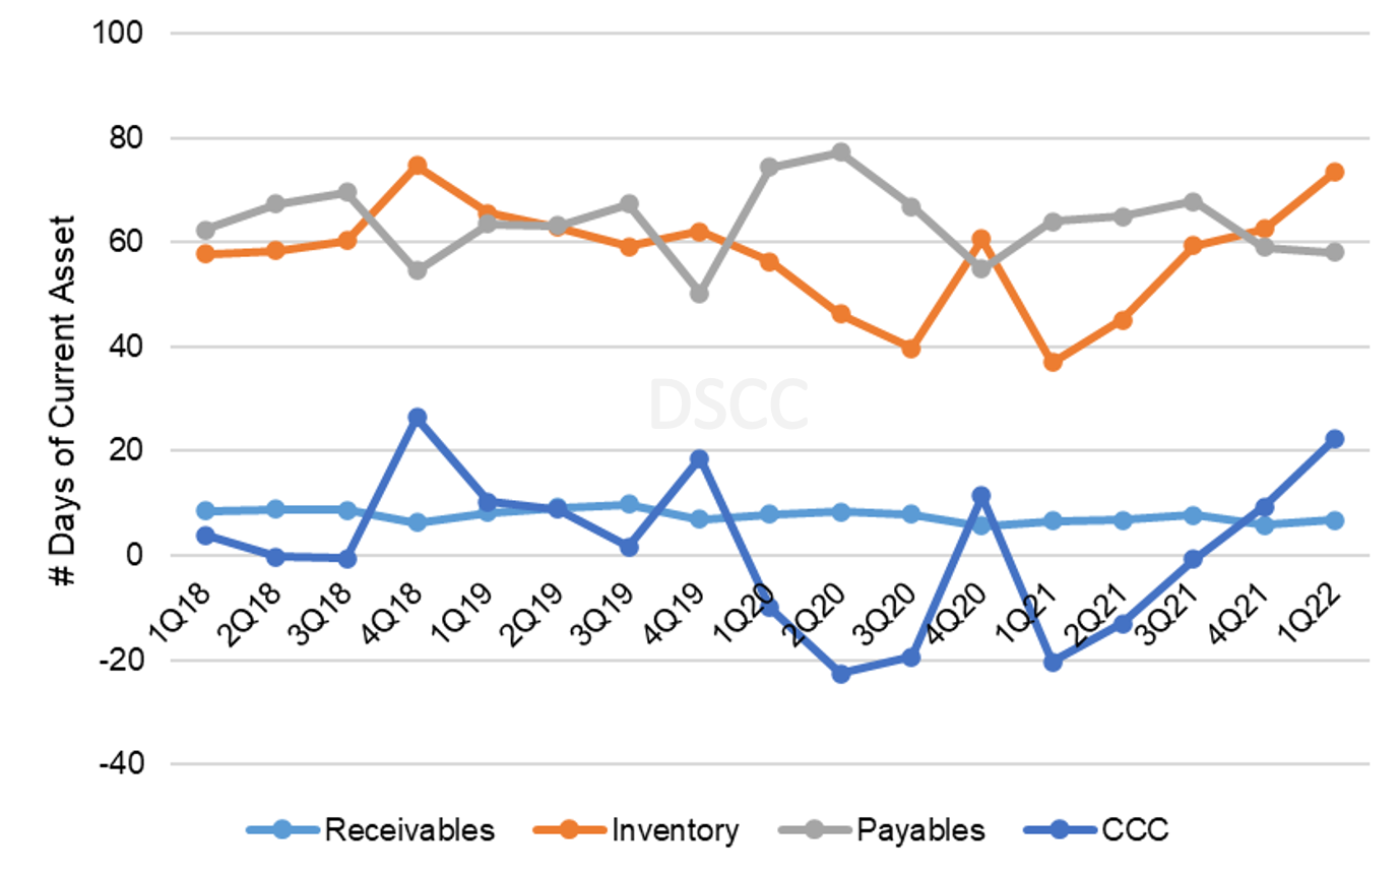
Best Buy spent the balance of 2020 and 2021 restocking its inventory position, getting back to its adequate level during 2021. In its most recent quarter, the company reported 74 days of inventory, about 14 days higher than normal. In dollar terms, Best Buy inventory was $6.3B, which suggests that its excess inventory was about $1.2B.
While Best Buy focuses on consumer electronics, Walmart is the world's biggest retailer for general merchandise. They are one of the top sellers of TVs in the US because they are one of the top sellers of just about anything. Although Walmart revenues increase in its fiscal Q4 (also November to January), its business is much less seasonal than Best Buy because of a heavy mix of non-seasonal items like groceries. As shown on the chart, Walmart’s payables and receivables are fairly steady at 40-45 and 4 days, respectively.
Walmart Current Assets, 2018-2022
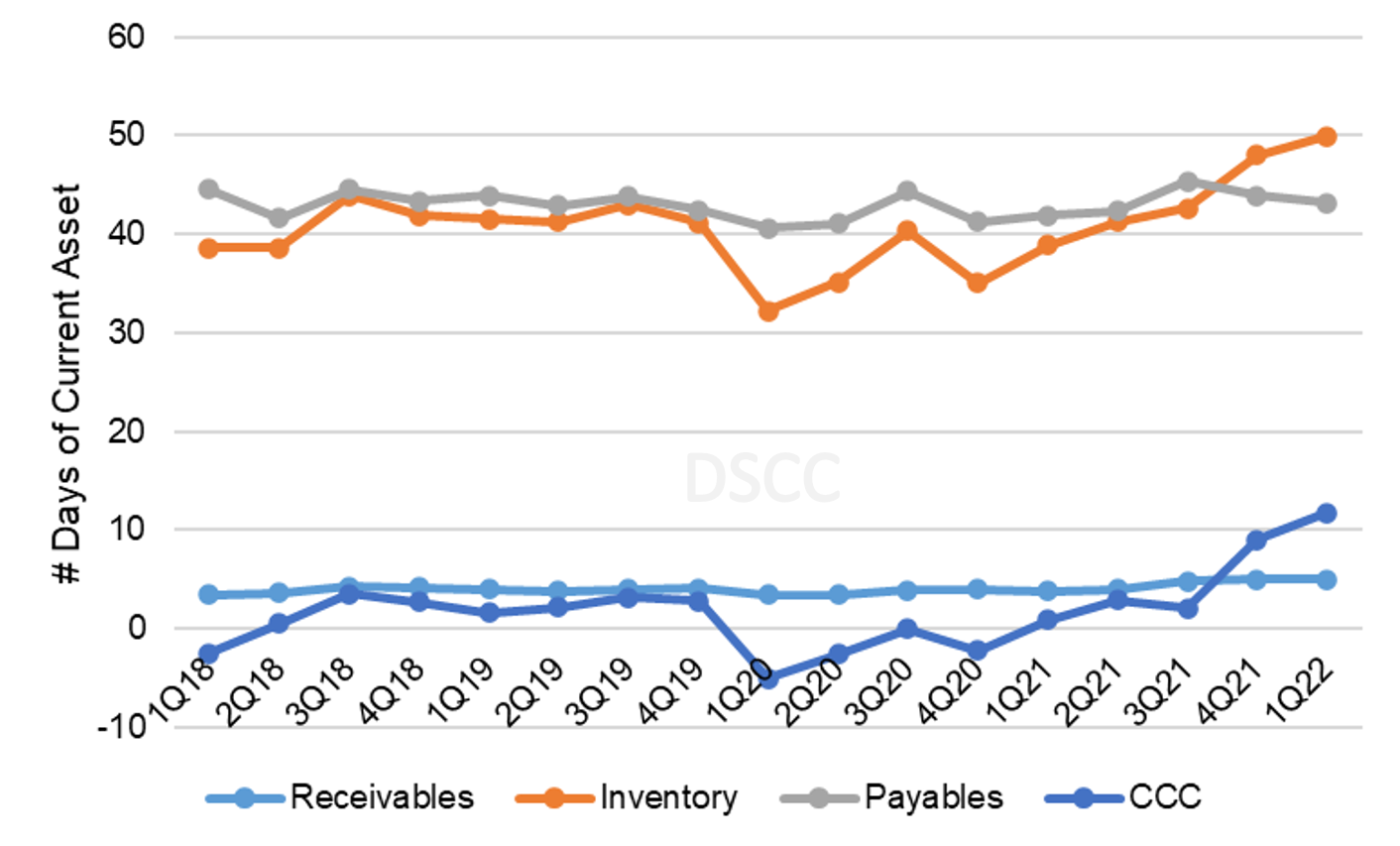
Like Best Buy, Walmart inventory plunged at the beginning of the pandemic, hitting 32 days in April 2020, and Walmart spent the rest of 2020 and 2021 rebuilding inventory. By mid-2021 it had restored its normal inventory position, but in the most recent quarter Walmart reported 50 days of inventory, about 10 days higher than normal. In dollar terms, Walmart had $61.2B in inventory at the end of April 2022, so about $12.2B of that was higher than normal.
While Best Buy and Walmart are primarily known for their bricks-and-mortar presence, both companies saw online sales surge during the pandemic. In contrast, Amazon has long dominated online sales but has been increasing its physical store presence in recent years. Also, unlike its two peers, Amazon has a huge business in web services (AWS) which in the most recent quarter accounted for 52% of revenues and more than 100% of operating income. Even without AWS, Amazon has a massive presence, with product revenues of $242B in 2021.
Despite these differences, with respect to inventory Amazon is behaving like its two peers, as shown in the next chart here. First it is worth noting how different Amazon’s current assets look compared to Walmart and Best Buy. Amazon’s accounts receivable includes AWS, so they tend to be higher than peers at about 20 days. Amazon’s average days payable is much longer than its peers, averaging about 80 days before the pandemic and 100 days since the pandemic started.
Amazon Current Assets, 2018-2022
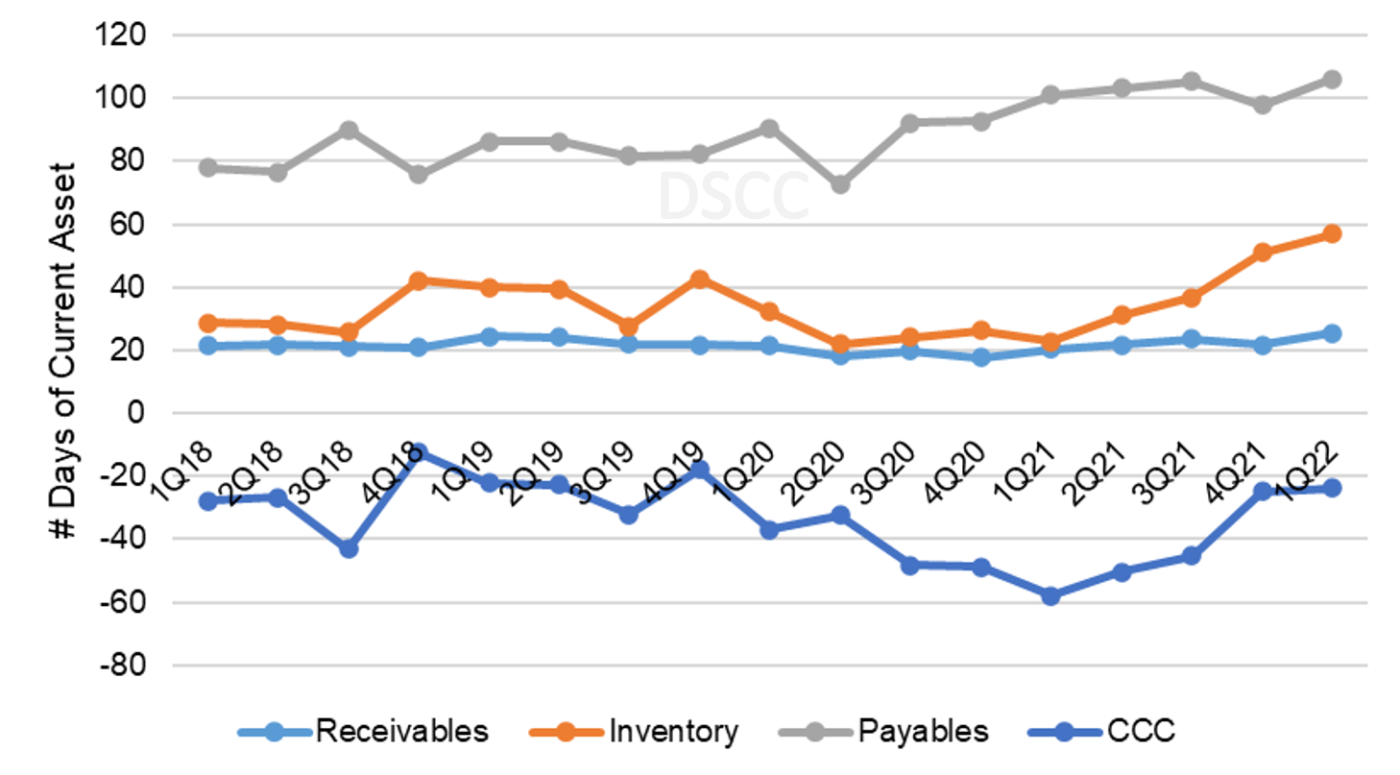
Like its peers, though, Amazon saw inventory shrink during the pandemic and has seen it surge recently. Inventory hit a low of 22 days at the end of June 2020 (Amazon follows a calendar fiscal year) but has jumped to an all-time high of 57 days at the end of March 2022. Amazon’s inventory is at least two, and perhaps three, weeks in excess of a normal level. In dollar terms, Amazon reported $35B of inventory at the end of March, so about $10B of that is excess.
Looking at these three companies, it appears that they have on average about two weeks of excess inventory. That characterizes the company’s total business, and display-related inventory might be different. However, the anecdotes from Target and other indicators suggest that if anything the picture for display-related products looks worse and not better than the overall business.
Although these three companies primarily operate in the US, they all have a substantial international presence. Furthermore, their behavior and policies as successful retailers in the US are likely to be similar to the behavior and policies for successful retailers in the rest of the world, or at least in the rest of the developed world. On that basis, we think it likely that a conservative estimate of excess inventory at retailers is about two weeks.
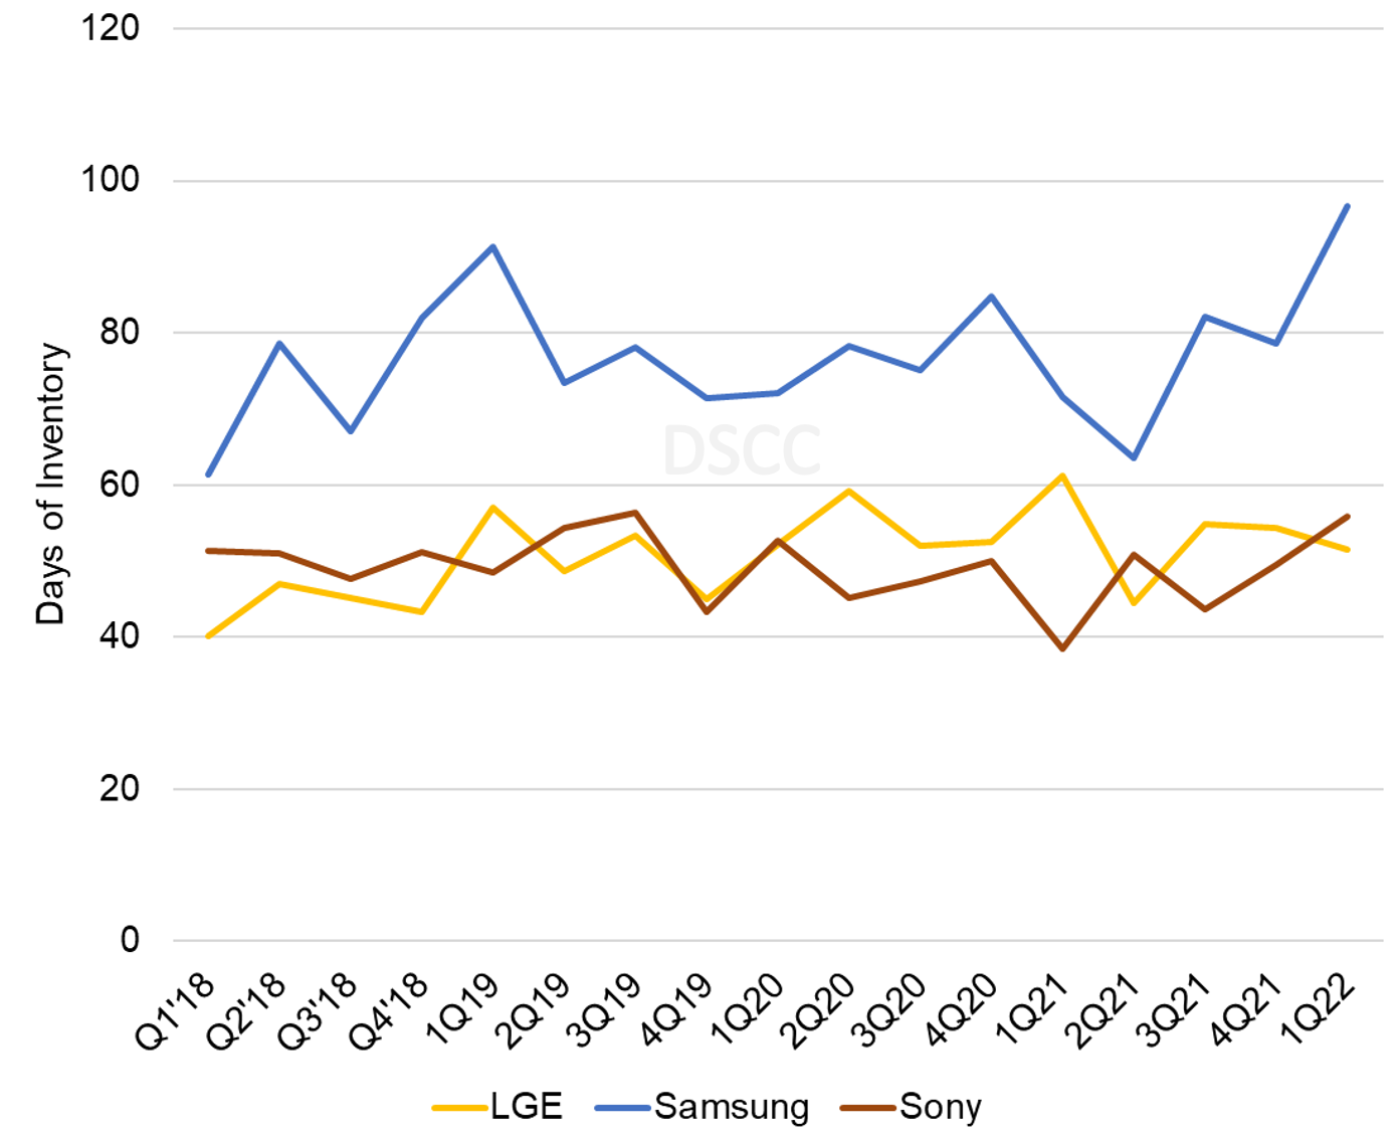
Taking a step back in the value chain from the retailers, at a brand level with one exception there does not appear to be excessive inventory. The exception is important, though, because Samsung is the biggest TV maker and a big player in the IT space as well. While Sony’s inventory may be slightly elevated – it is five days higher than the average number of days from 2015-2019 – it does not seem to be seriously off-kilter. LG Electronics’ inventory is lower than it was a year ago. Samsung, on the other hand, has a record level of inventory, both expressed in the number of days (97) and in absolute value ($39B).
Days of Inventory for Global Consumer Electronics Leaders, 2018-2022
Finally, we can get to the panel makers. Like their counterparts downstream, when demand surged at the beginning of the pandemic, panel maker inventory was squeezed to an absolute minimum. As a group, panel maker collapsed to 35 days at the end of Q3 2020 and remained at a similar level for nearly a year. Even at the end of 2021, panel maker inventory stood at 43 days, which can fairly be considered a normal, healthy level.
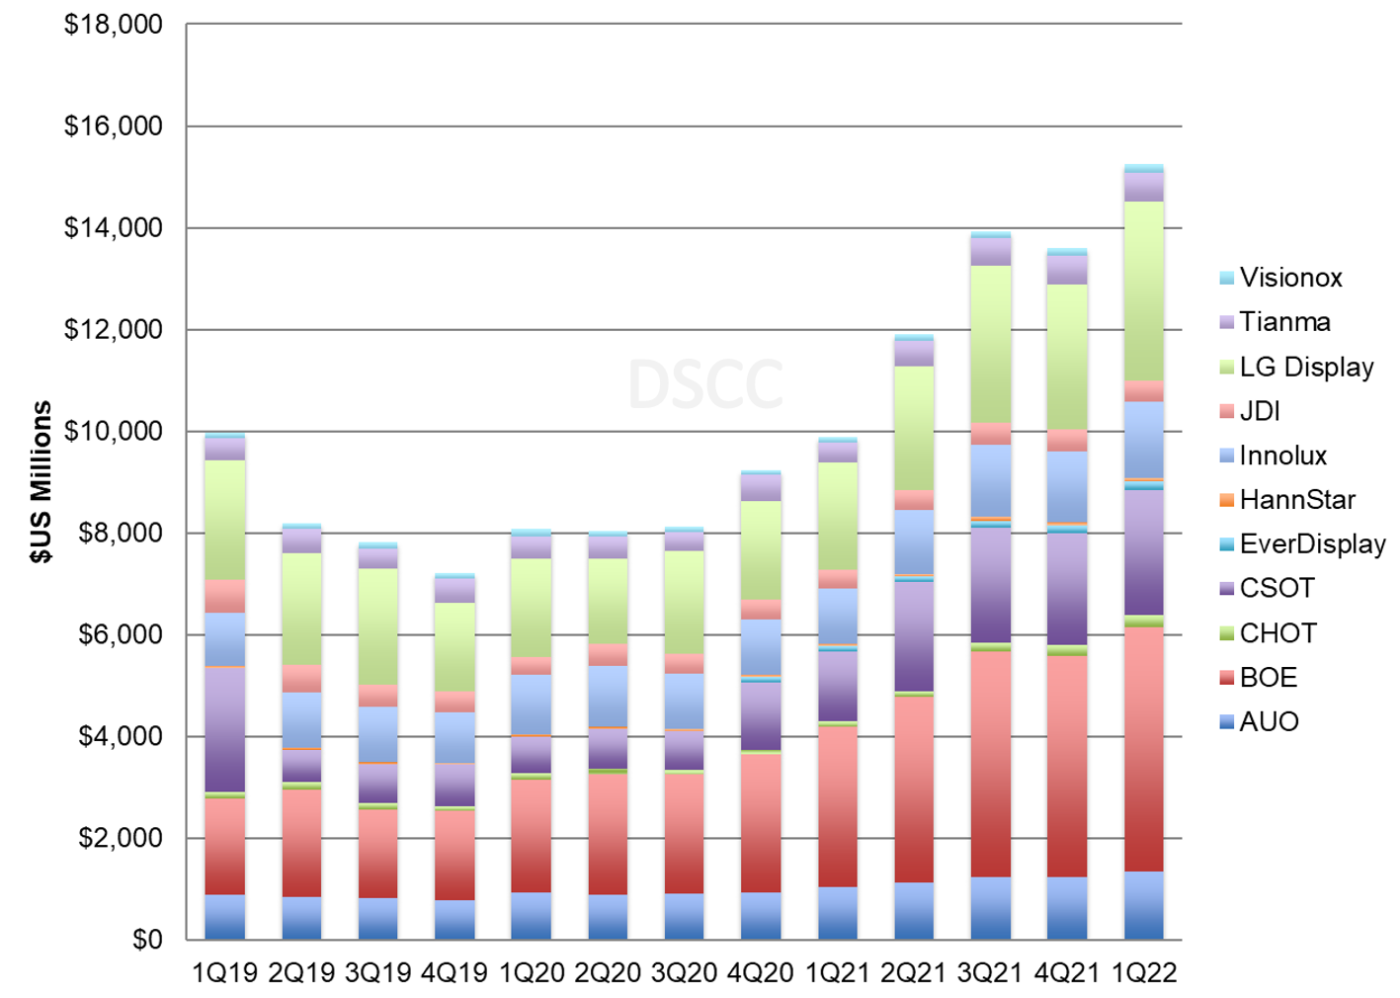
In both absolute value and in the number of days, panel maker inventory increased in Q1 as seen from the last chart here. Inventory days increased from 43 to 56 and inventory value increased by $1.6B to $15.2B. Inventory was especially high at BOE (72 days), China Star (70 days) and LGD (67 days). Based on the industry-wide level of 56 days, we estimate that panel makers had about two weeks of excess inventory at the end of Q1.
Inventory of Flat Panel Display Makers, 2019-2022
By its nature this analysis is backward-looking. Most of the inventory data dates to the end of March; the retailer data dates to the end of April. Based on DSCC’s estimates of utilization rates at panel makers, the situation has not improved during Q2. Panel makers sustained high rates of utilization in April and May, while end market demand has continued to be weak.
So, with two weeks of excess inventory at retailers and another two weeks at panel makers, the industry has four weeks of excess inventory, or perhaps more than that at the end of Q2. Many have speculated that companies will want to carry more inventory post-pandemic to address the problems of supply chain uncertainty. This is likely to be the case, but it is unclear how much more inventory they will want to carry. On the other hand, if companies believe that a recession is imminent, they will try to conserve cash, and will therefore push to keep inventory to a minimum.
If the display industry needs to cut two weeks of inventory from the value chain during the second half of 2022, this will require a sharp slowdown of utilization in the industry. It means the industry needs an equivalent of 24 weeks of production for the 26 weeks of demand, that’s a reduction of 8% in overall utilization. If the industry needs to cut four weeks, then double the impact to 16%. Although we can’t be certain about the exact amount of the correction nor about the exact timing, it appears clear that the industry is headed for a slowdown in the second half of 2022.
