Q1'22のFPDメーカー収益分析
冒頭部和訳
FPDメーカー各社のQ1’22収益は、過去最高を記録したQ4’21から減少し、業界の総利益は損益計算書のすべてのレベル (粗利益、営業利益、税引前利益、純利益、EBITDA) において前期比で減少となった。 DSCCの Quarterly Display Supply Chain Financial Health Report (一部実データ付きサンプルをお送りします) が各社の財務実績を明らかにした。
FPDメーカー全社から既にQ1'22実績が報告されていることから、Q1'22の業界実績の完全なレビューをまとめることができた。業界は2021年のピークから落ち込んだものの、FPDメーカーにとっては依然として全体的に収益性の高い四半期だった。
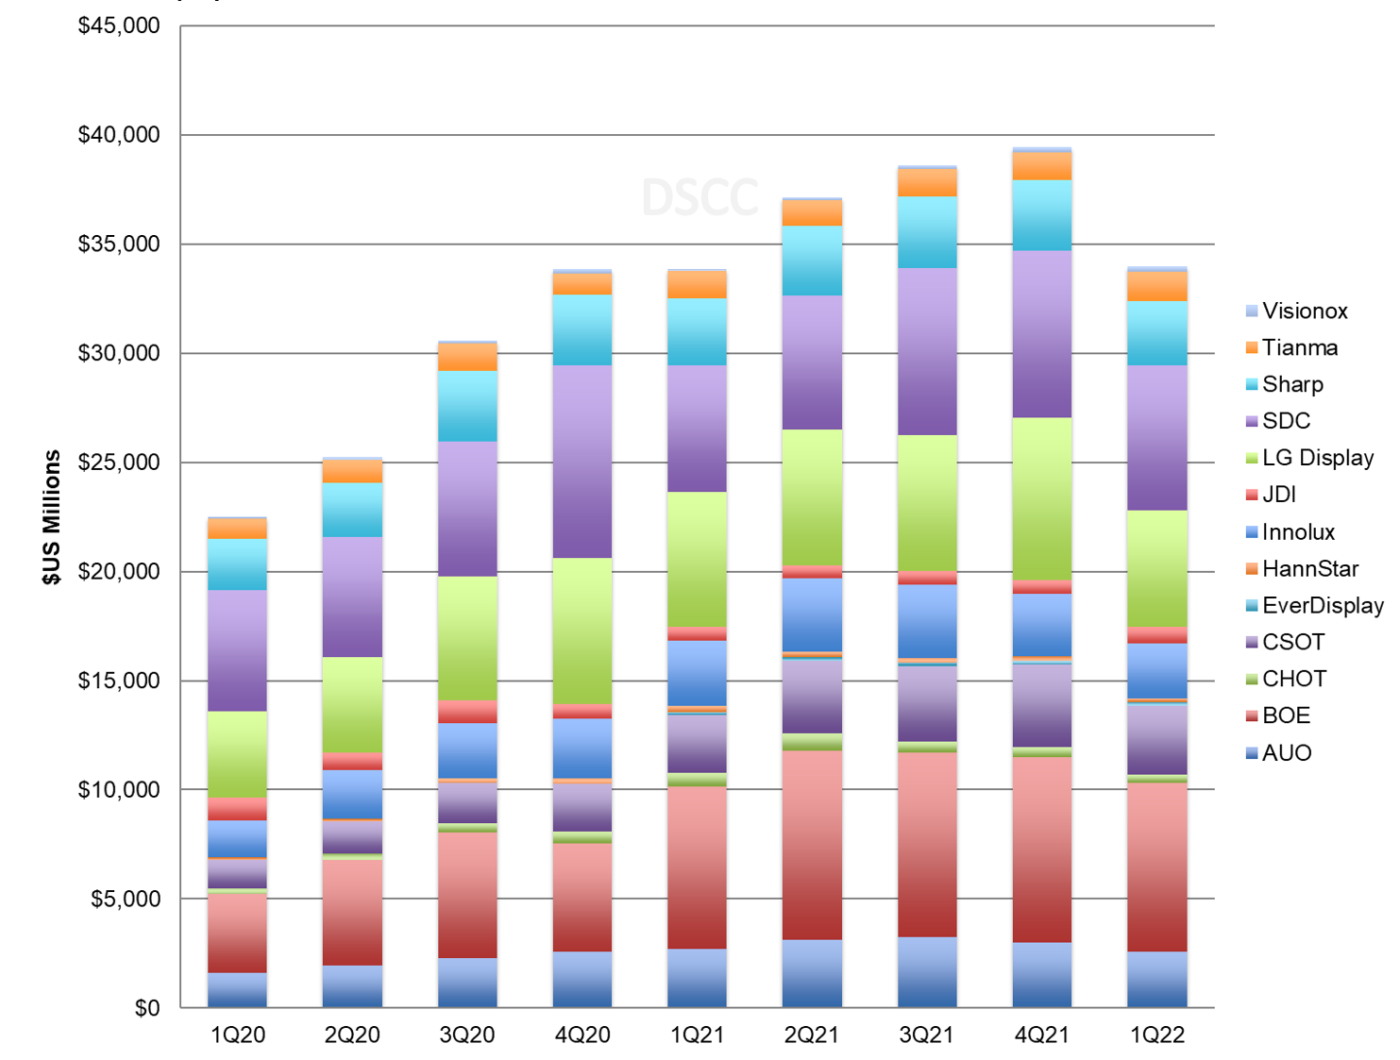
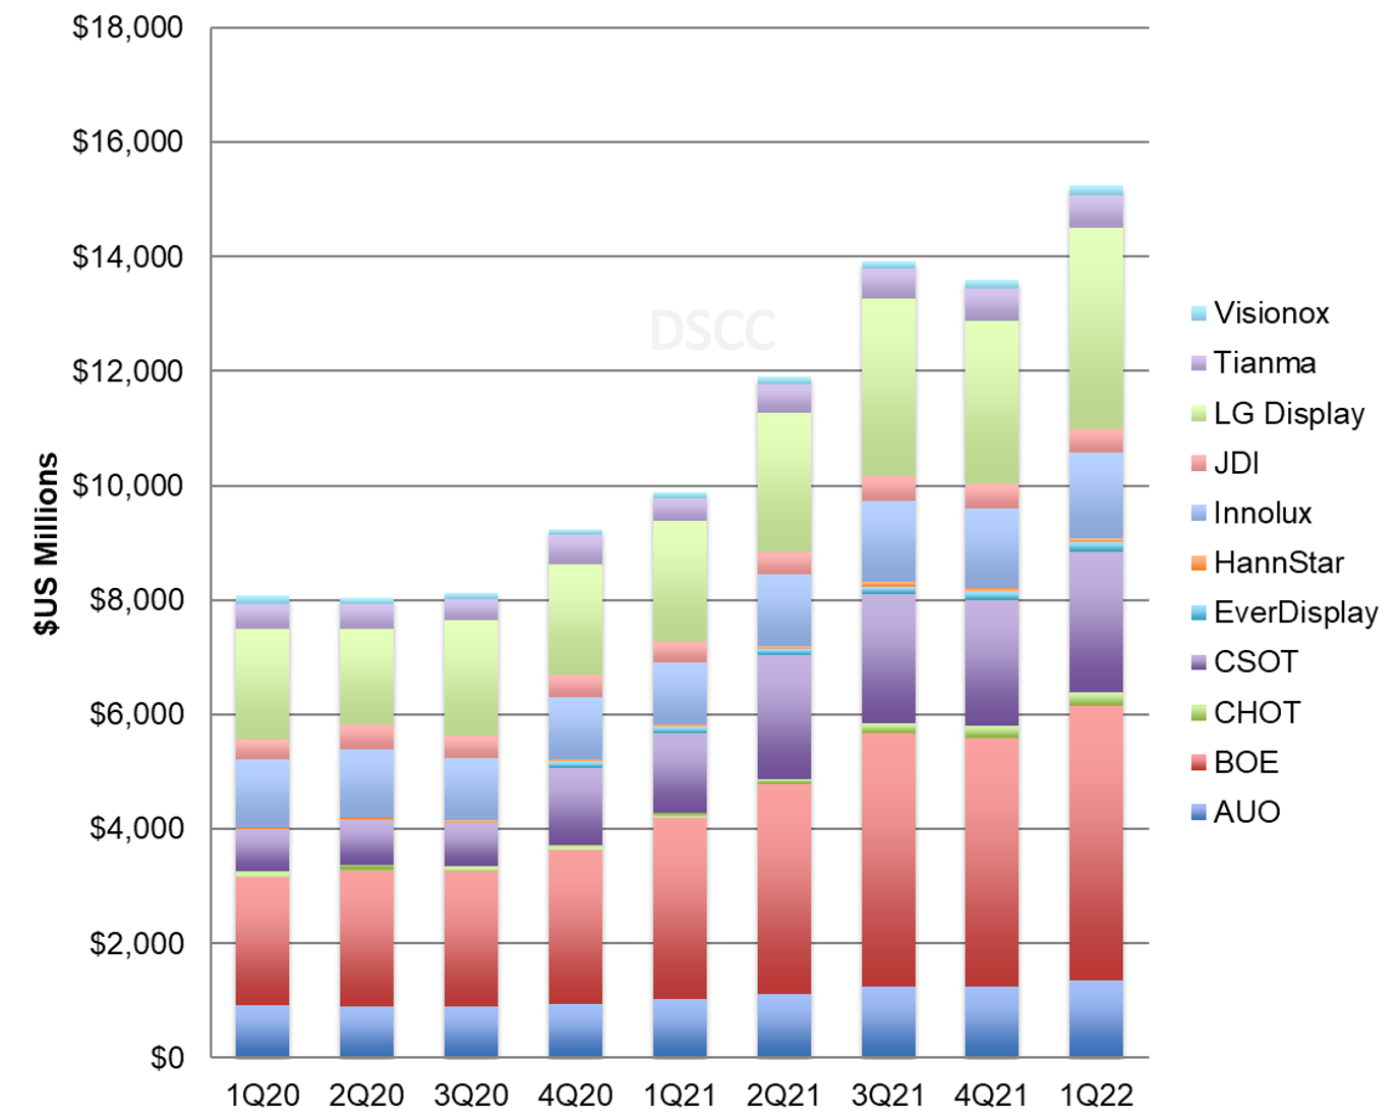
最初のグラフは、上場FPDメーカー13社の四半期収益を示している。総収益は前期比14%減・前年比横ばいの340億ドルで、過去最高だったQ4’21の394億ドルから減少した。BOEが5四半期連続で収益シェアトップの座を獲得、業界全体の23%に相当する77億ドルの収益を上げた。SDCの収益は前期比14%減、シェアは20%近くで安定している。LGDの収益は前期比28%減、シェアは16%に低下した。首位以外で2桁の収益シェアを確保したのはこれら韓国2大メーカーだけで、それぞれシェア2位と3位を維持している。その次には7%から9%のシェアを獲得した4社の集団、AUO、Innolux、CSOT、Sharpが続いており、各社の収益は26億ドルから32億ドルの範囲となっている。
Flat Panel Display Revenues, Profits Tumbled in Q1’22
Flat panel display maker revenues declined Q/Q from their all-time high in Q4’21, and total industry profits declined Q/Q at all levels of the income statement – gross profits, operating profits, pre-tax profits, net profits and EBITDA profits, according to the summary of their financial performance in DSCC’s Quarterly Display Supply Chain Financial Health Report (一部実データ付きサンプルをお送りします).
With all panel makers reporting their Q1’22 results, we can compile a full industry review for Q1’22; while the industry has fallen from the peaks of 2021, it was still a profitable quarter overall for flat panel makers.
The first chart in this section shows quarterly revenues for the 13 publicly traded panel makers. Total revenues decreased by 14% Q/Q and were flat Y/Y at $34.0B, falling from their all-time high of $39.4B in Q4. For the fifth consecutive quarter, BOE held the top position in revenue share with revenues of $7.7B for 23% of industry revenues. Samsung revenues decreased by 14% Q/Q and SDC’s share held steady at nearly 20% while LGD’s share decreased to 16% as its revenues declined 28% Q/Q. The two Korean giants remain #2 and #3 in revenue share as the only other companies with a double-digit share. Then there is a cluster of four companies between 7% and 9% share: AUO, Innolux, CSOT and Sharp, each with revenues in the range of $2.6B - $3.2B.
Flat Panel Display Maker Revenues, Q1'20-Q1'22
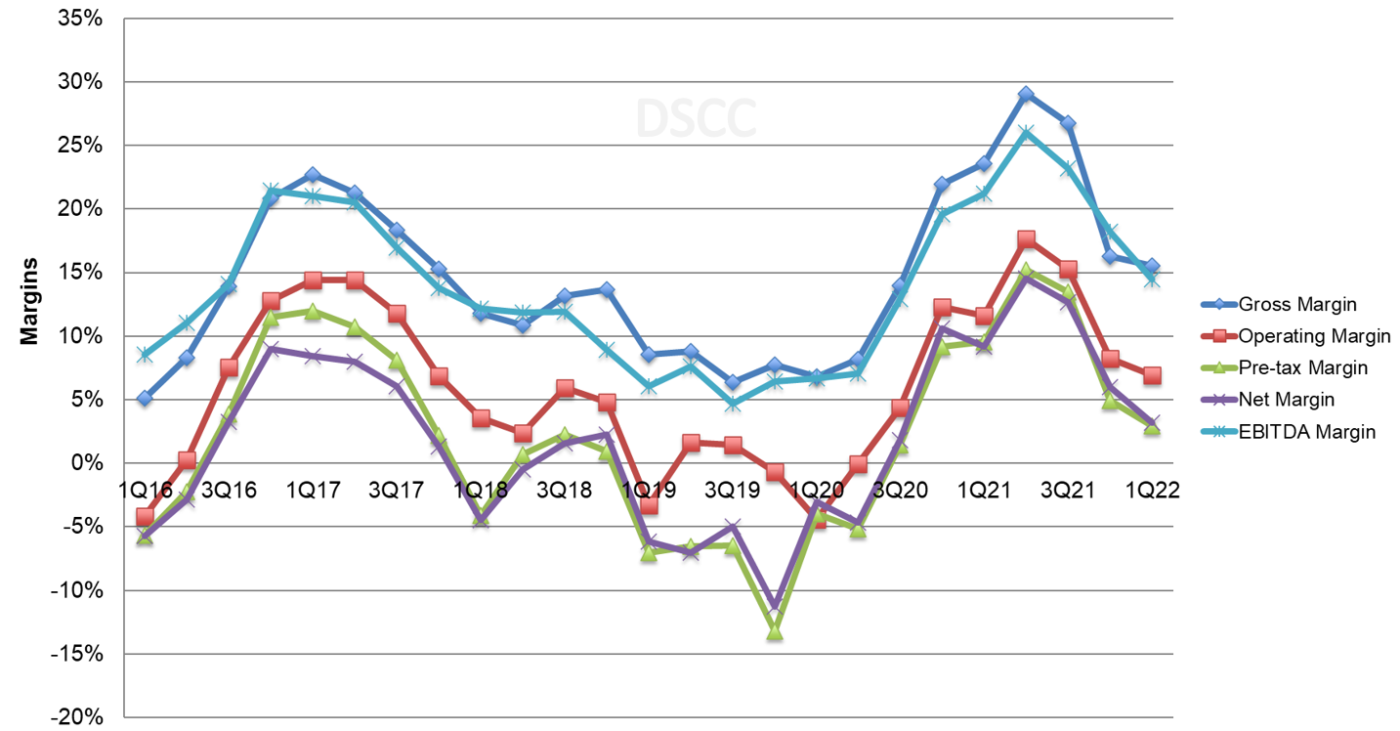
The effect of the Crystal Cycle is clearly shown on the next chart of industry margins. The increase in LCD panel prices for TVs and IT products increased gross margins and EBITDA margins for five straight quarters to a peak in Q2’21 and the down part of the cycle started in Q3. Industry margins declined by 1%-4% Q/Q and are now down 10%-13% from their all-time highs set in Q2’21.
Note that these margin figures exclude certain companies from certain metrics: for example, Samsung reports operating margin for its display business, but not pre-tax or net margin. Nevertheless, the series is consistent over time, clearly demonstrating the industry’s long descent from 2017-2019, sharp recovery in 2020-2021, peak in Q2’21 and decline into 2022.
Display Industry Margins, Q1’16-Q1’22
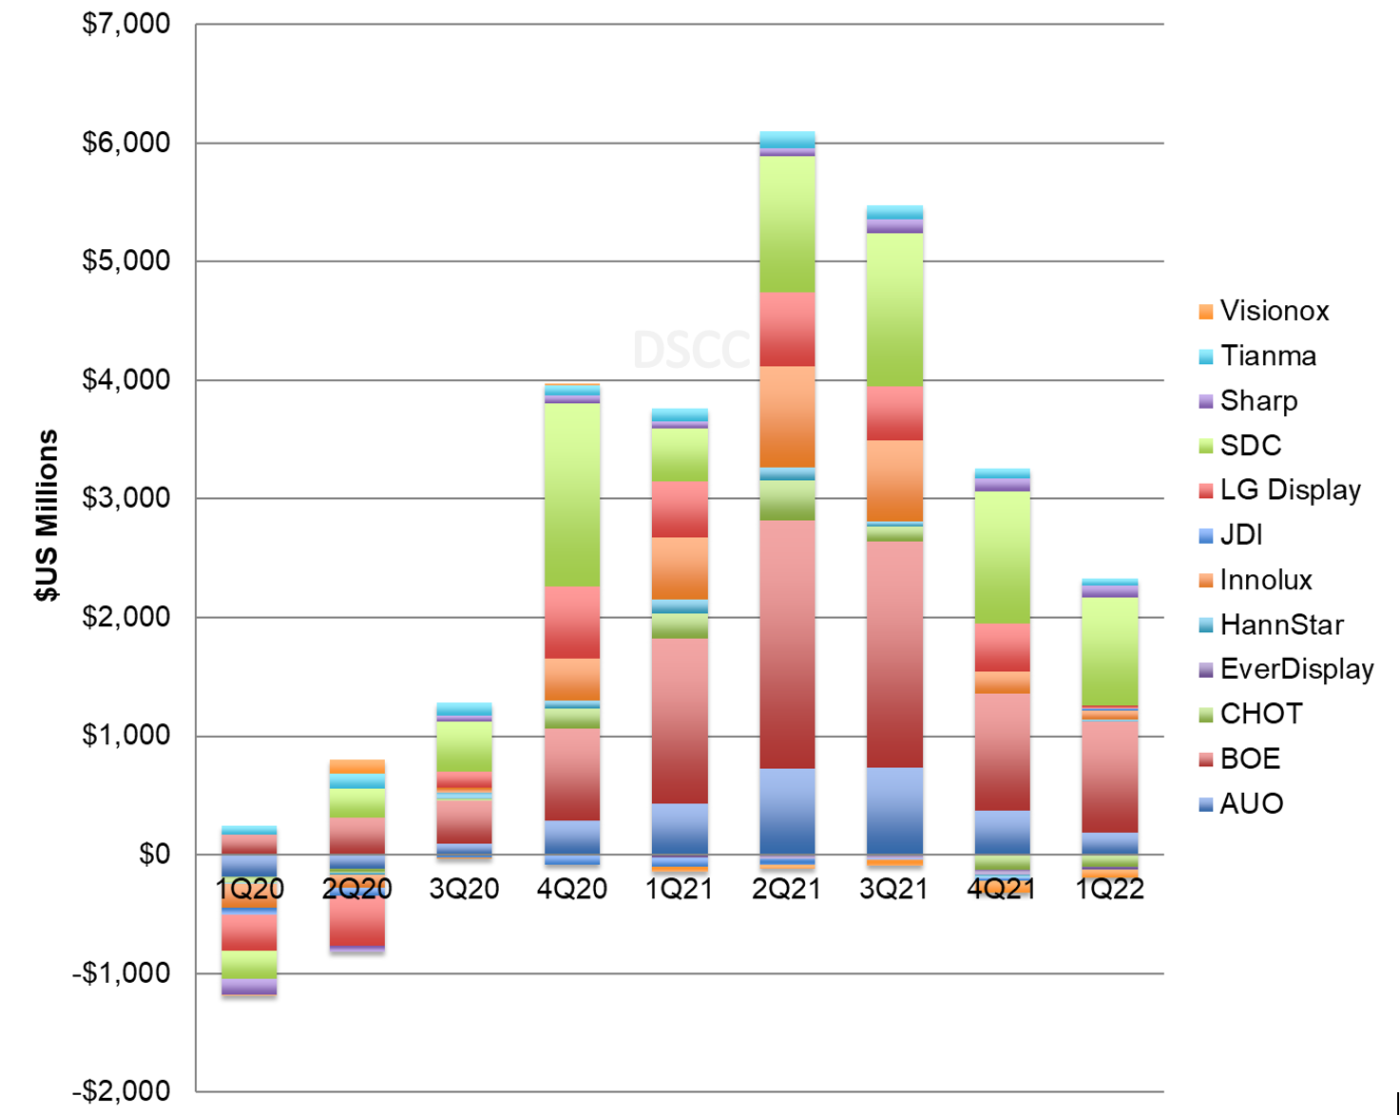
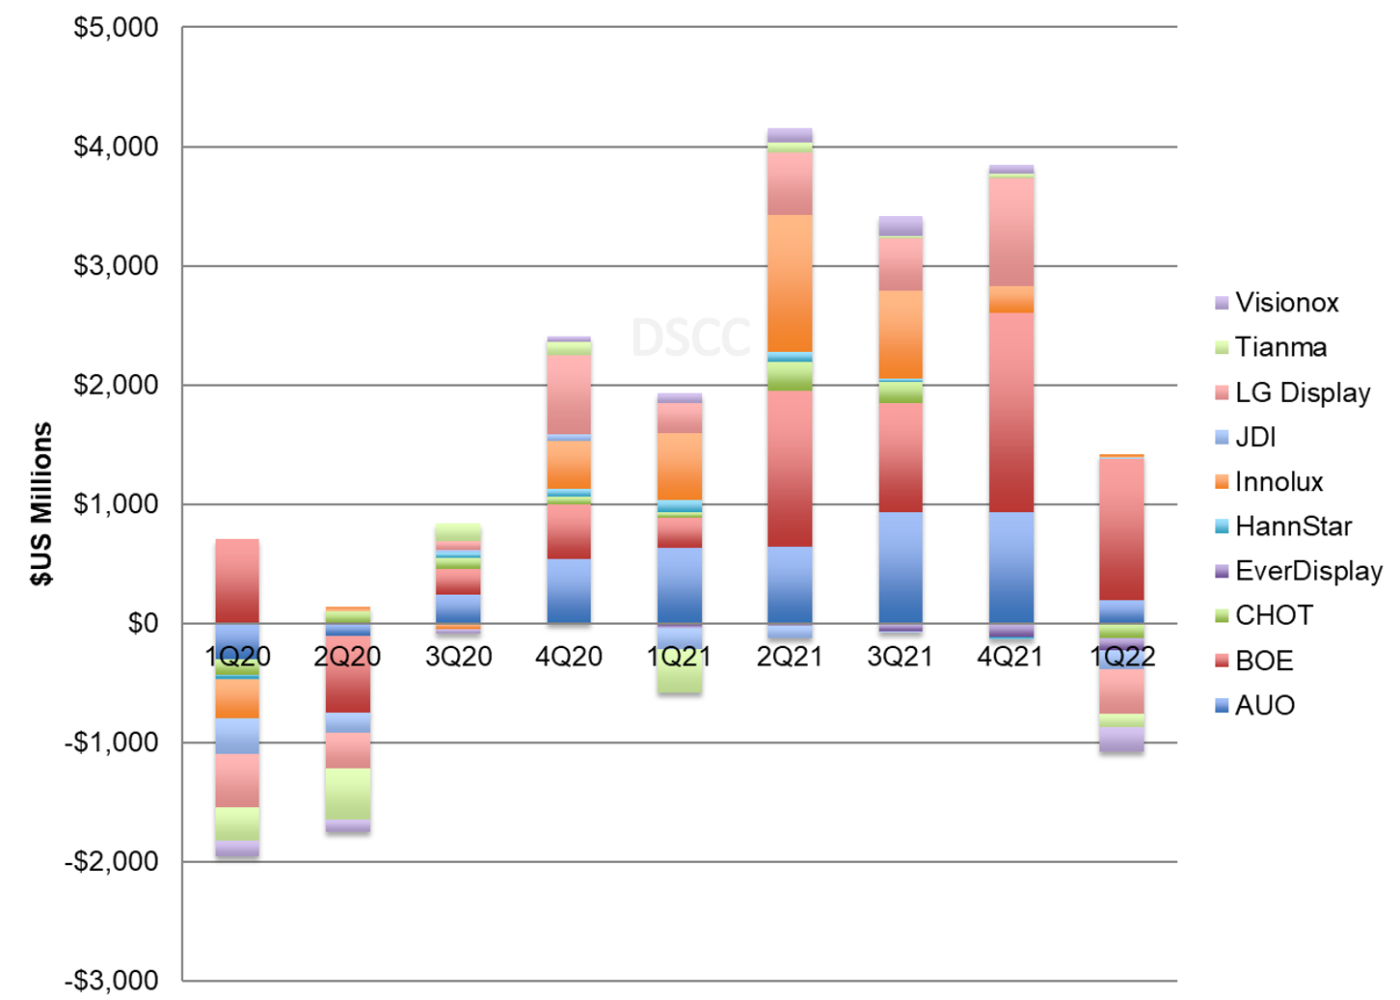
During the down-cycle of 2018-2019, display industry operating profits were dominated by Samsung Display, but with rising LCD panel prices BOE took the top spot starting in Q1’21. While operating profits for the rest of the industry have nearly evaporated, those two companies continue to be profitable. Together, Samsung and BOE represented 86% of total industry operating profits in Q1’22. Nine of the 12 panel makers reported positive operating profits but aside from the top two only Sharp and AUO reported operating profits greater than $100M for the quarter. The companies reporting operating losses were all in China: EverDisplay, CHOT and Visionox. The total industry operating results decreased by 27% Q/Q and by 41% compared to a year ago.
Panel Maker Operating Results, Q1’20-Q1’22
Net profit figures exclude Samsung and Sharp, which do not report net profits of their display businesses, but the rest of the display industry posted a net profit of $786M in Q1’22, down more than 80% from the peak in Q2’21. BOE led the industry with a net profit of $691M, followed by AUO.
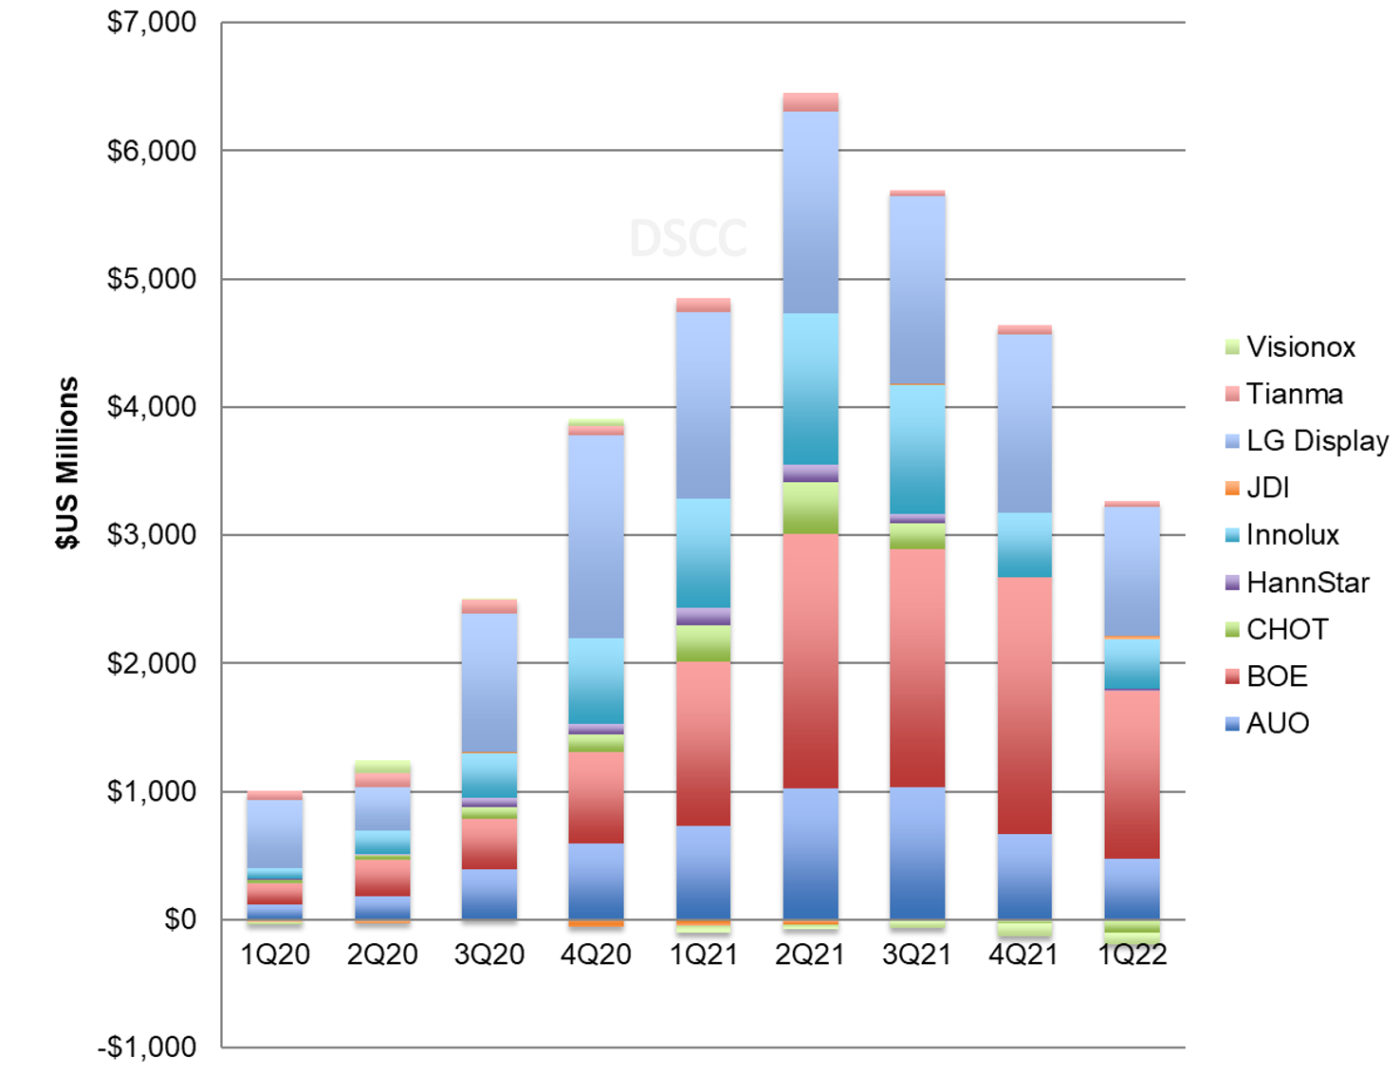
EBITDA by company is shown in the next chart, and EBITDA for the industry decreased by 32% Q/Q and by 35% Y/Y to $3.1B. Eight of the 10 panel makers reporting this result recorded positive EBITDA in Q1’22, with JDI and Visionox reporting negative EBITDA. BOE again held the top spot in EBITDA with $1.3B in the quarter and LGD also recorded more than $1B in EBITDA. EBITDA totals exclude Samsung, Sharp and CSOT, which do not report depreciation/amortization for their display businesses separately.
Panel Maker EBITDA, Q1'20-Q1'22
Turning to company balance sheets, we see a clear warning that industry oversupply was getting worse in Q1’22. While panel maker inventories were constrained by tight supply as pandemic demand surged in the second half of 2020, inventories have been increasing since Q4’20 and total industry inventory increased by another $1.7B in Q1, up 12% Q/Q and 54% Y/Y. Inventories at the end of Q1’22 were more than $7B higher than Q3’20. Inventory days increased by 12 days Q/Q and by eighteen days Y/Y to 50. High inventory will put continuing pressure on panel prices.
Panel Maker Inventory Value, Q1'20-Q122
Debt/equity ratios increased slightly for most panel makers in Q1, but the profits during the pandemic allowed most of the panel makers to restore clean balance sheets. Taiwan makers AUO, Innolux and HannStar have conservative balance sheets with negative net debt/equity.
Historically, panel makers have been notorious for their miserable performance on free cash flow (FCF). In prior Crystal Cycles, periods of profit were typically accompanied by heavy capital investment, so FCF was minimal at the top of the Crystal Cycle and negative at the bottom. In 2018, industry FCF was a negative $7.2B, and the industry booked another $5.1B of negative FCF in 2019. Increasing profits in the second half of 2020 allowed the industry to reach positive FCF for the full year 2020 at +$1.0B. The industry hit a high water mark of FCF in 2021 with $12.4B, but in the first quarter of 2022, FCF evaporated. Total FCF for the 10 companies that report this figure declined by 91% Q/Q and by 75% Y/Y to $340M. Although the industry reported its seventh consecutive quarter of positive free cash flow in Q1’22 for the first time ever, it looks like that streak is likely to end in Q2’22. BOE represented much more than 100% of industry FCF with a positive $1.2B, and among the others only the three Taiwanese panel makers reported positive FCF.
Panel Maker Free Cash Flow, Q1’20-Q1’22
The industry saw its best upswing of the Crystal Cycle in 2020-2021 and is now clearly in the downswing. The companies which benefitted most during the upcycle concentrated on LCD panels for large-area applications; this includes the Taiwan panel makers but also CHOT, BOE and CSOT in China. With the start of the downcycle in Q3’21, the companies focused on large-area LCD will suffer disproportionately.
