FPD生産能力予測をやや引き下げ、中止/遅延/規模縮小が要因
冒頭部和訳
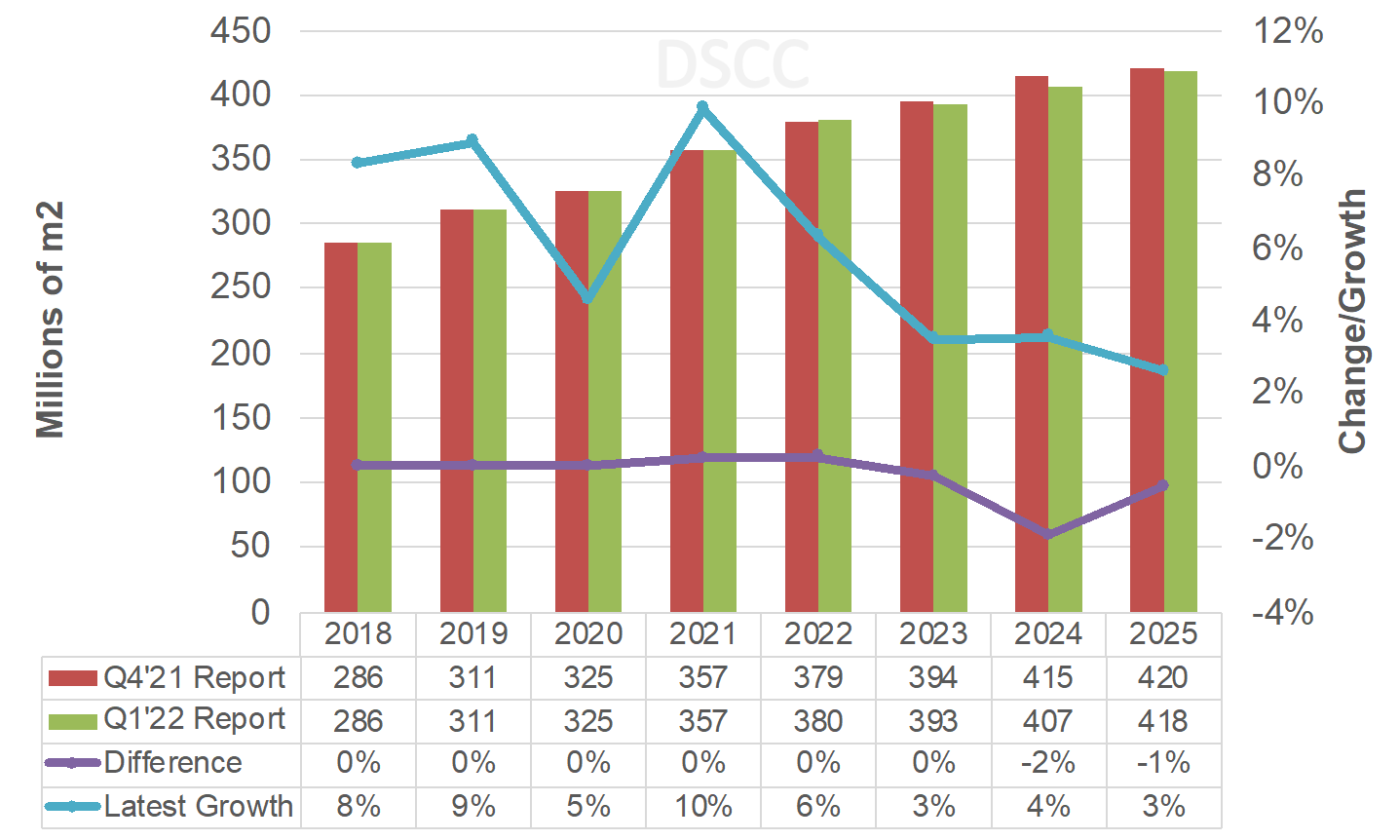
DSCCでは、LCD市況の改善を背景にパネル生産能力予測を前期発表分まで6期連続で引き上げてきたが、市況の悪化にともなう遅延と中止により、今期発表分では予測値を引き下げた。2021年から2026年にかけてのパネル生産能力成長率は前期発表のCAGR5.1%に対して今期は同4.8%と予測、2026年パネル生産能力は前期発表の予測値から1%引き下げとなった。2026年LCD生産能力予測は1%引き下げ、2026年にかけての成長率は、前期発表のCAGR 3.9%から今期発表では同3.7%へと引き下げた。2026年OLED生産能力は前期発表から2%引き下げ、2026年にかけての成長率は、前期発表のCAGR 15.7%から同15.3%へと引き下げている。OLED生産能力シェアは2021年の8%から2026年には13%へ上昇すると予測している。
DSCC’s Display Capacity Outlook Falls Slightly on Cancellations/Delays/Downsizing
After upgrading display capacity for six straight issues on improved market conditions in LCDs, we lowered display capacity this quarter on delays and cancellations as conditions worsen. From 2021 to 2026, display capacity is expected to grow at a 4.8% CAGR vs. 5.1% last quarter, and 2026 capacity is down 1% vs. our last issue. LCD capacity was downgraded by 1% in 2026 and now grows at a 3.7% CAGR through 2026 vs. 3.9% last quarter. 2026 OLED capacity was downgraded by 2% vs. last quarter and now grows at a 15.3% CAGR through 2026 vs. 15.7% last quarter. OLED capacity will reach a 13% share in 2026, up from 8% in 2021.
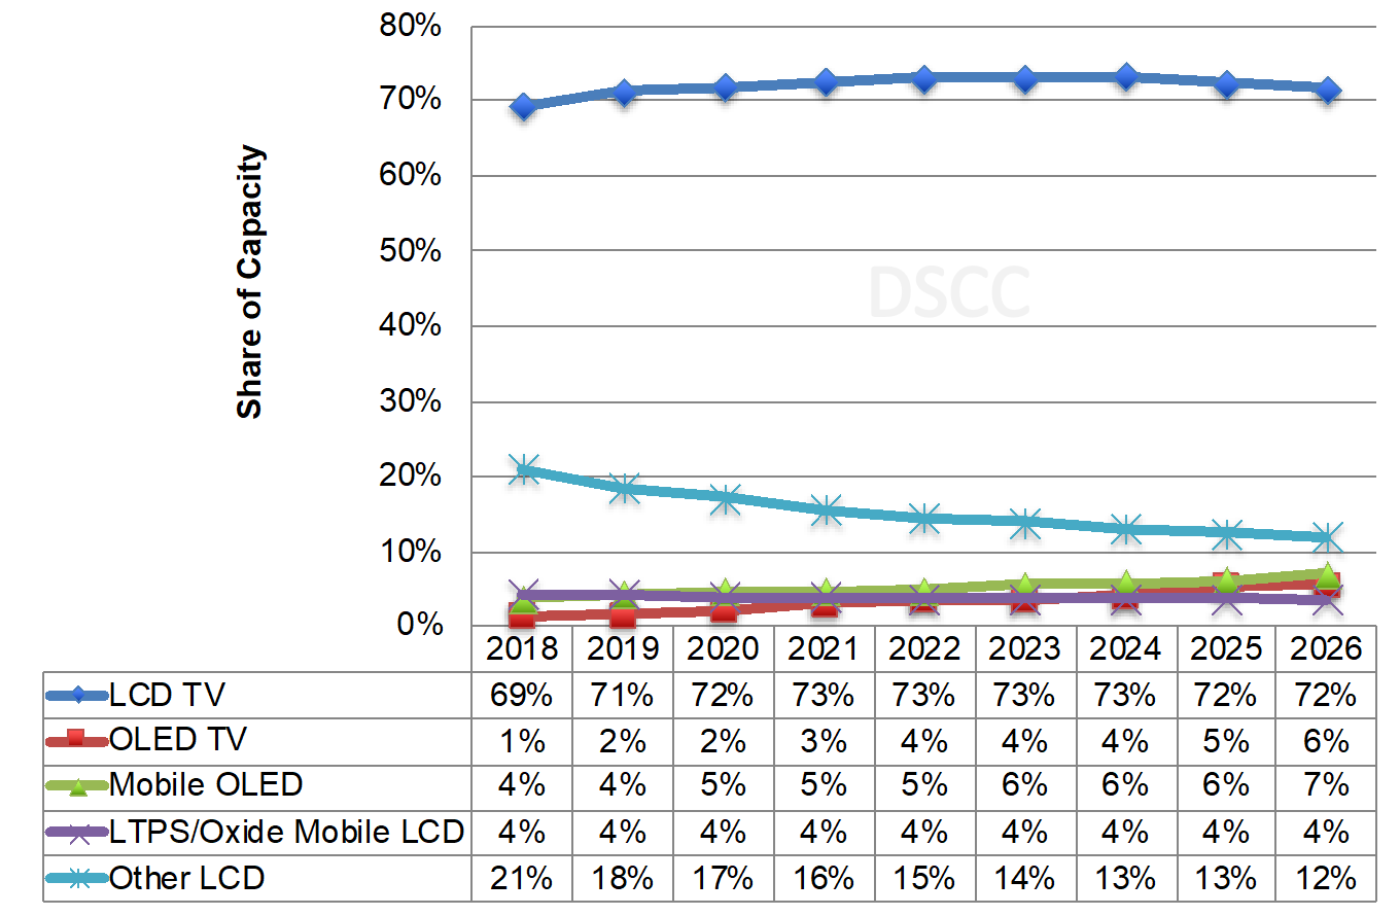
DSCC’s LCD Capacity Forecast
LCD TVs will continue to dominate capacity and grow at a 4.6% 2021-2026 CAGR, down from 4.8%. The LCD TV share will fall from 73% in 2021-2024 to 72% in 2025 and 2026 as mobile/IT OLEDs and OLED TVs gain share. OLED TVs are expected to enjoy the fastest growth, rising at an 18% CAGR, with its share rising from 2% in 2020 to 6% in 2026. Mobile OLEDs, which includes IT OLED fabs, are now expected to grow at a 14% CAGR and rise from a 5% share in 2020 to 7% in 2026. Mobile LCDs are expected to rise at a 3% CAGR and maintain a 4% share.
DSCC’s Capacity Forecast by Application/Technology
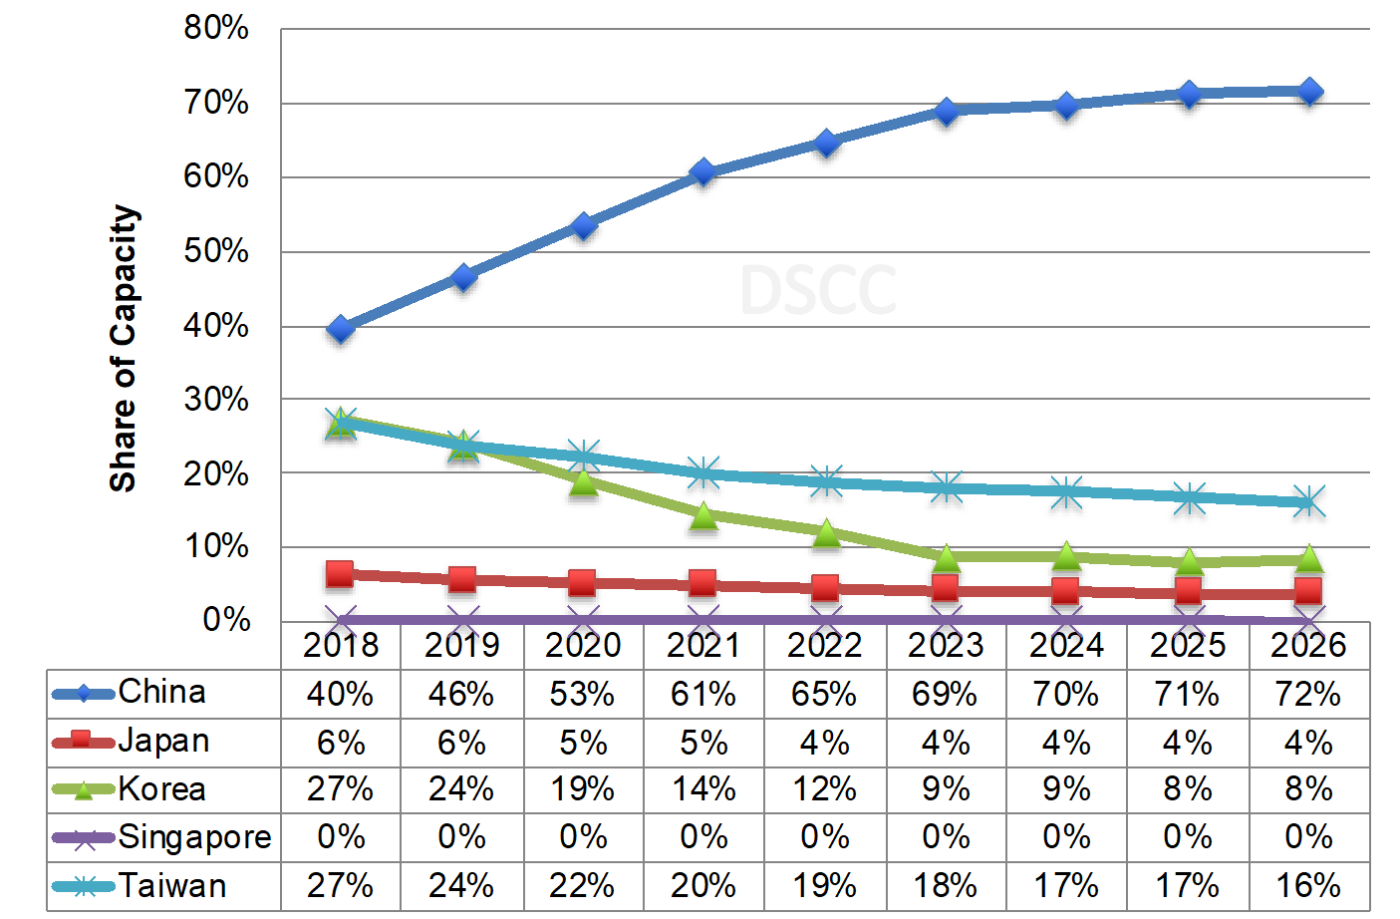
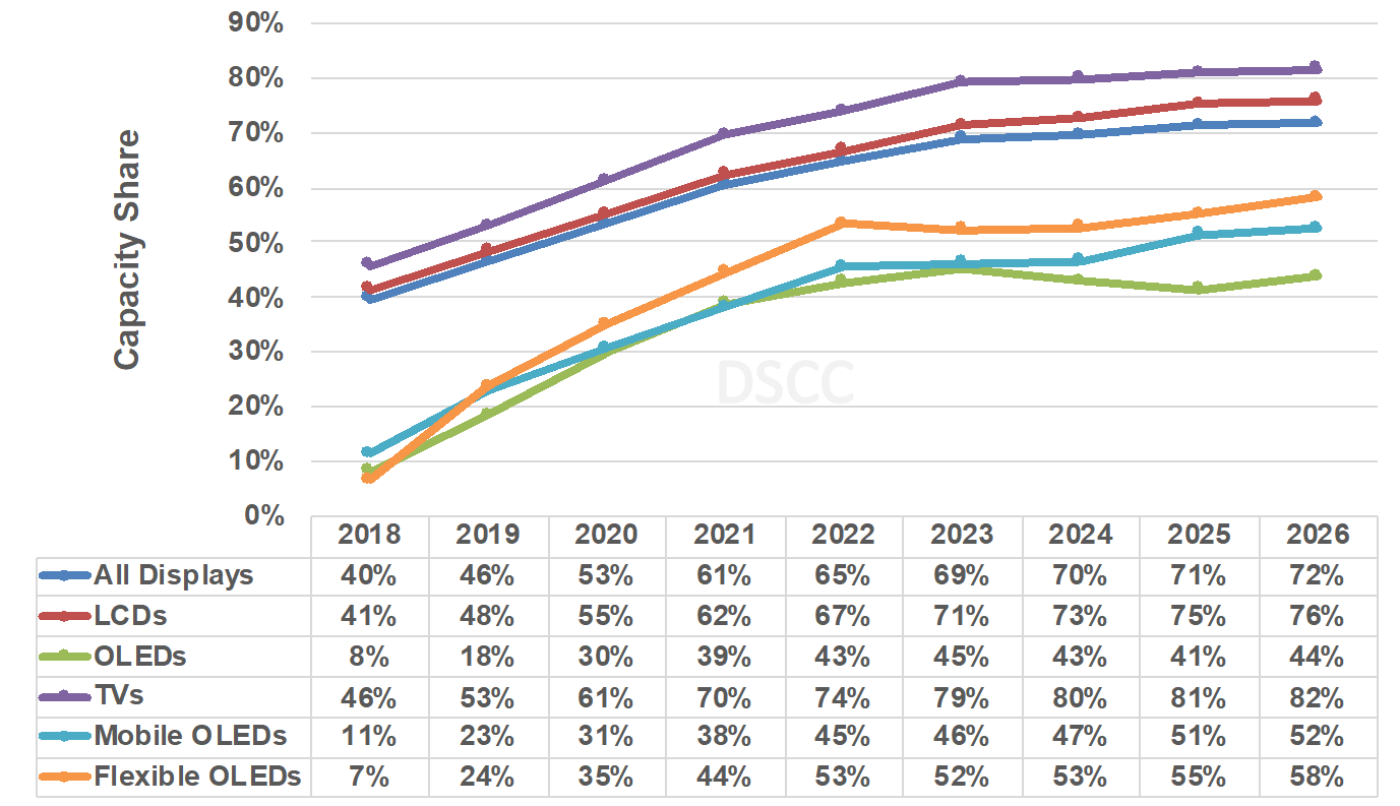
China is expected to dominate display capacity, growing from a 60% share in 2021 to a 72% share in 2026 on an 8% CAGR, down from 9%. Korea’s share is expected to fall from 14% in 2021 to 8% in 2026 on a 6% annual decline. Taiwan is now expected to show some growth, rising at a 0.3% CAGR from 2021 to 2026, although its share will fall from 20% in 2021 to 16% in 2026. China is projected to have at least a 44% share in all applications/technologies by the end of the forecast period led by:
- TVs – 82%
- LCDs – 76%
- All Displays – 72%
- Flexible OLEDs – 58%
- Mobile OLEDs – 52%
Display Capacity by Region
China’s Display Capacity by Technology/Application
G7+ capacity for LCDs and OLEDs is now expected to rise at a 5.7% CAGR from 2021 – 2026, down from 5.9%.
After double-digit growth in 2018 and 2019, capacity growth slowed to 7% in 2020, but rebounded to +13% in 2021. In 2022 and 2023, growth is slowing to 8% and 4% respectively, helped by shutdowns in Korea. From 2024 – 2026 we see 5% - 6% growth per year which should keep supply/demand more stable than in past years.
In terms of display capacity by supplier, BOE is expected to lead in 2026 with a 25.5% share followed by China Star at 16%, HKC at 11% and LGD at 8.8%. In just LCDs, BOE is expected to lead with a 28% share followed by China Star at 17%, HKC at 12% and Innolux at 10% and AUO at 9%. In OLEDs, SDC led in total OLED capacity from 2016-2020 while LGD is expected to lead from 2021 through 2026 with LGD growing slightly faster at a 2021-2026 CAGR of 13% vs. SDC at 12%. BOE reached #3 in 2018 and is expected to maintain that position while reaching an 11% share on an 18% CAGR from 2021 through 2026.
SDC will maintain a dominant position throughout the forecast in mobile OLED capacity, with its share not falling below 40% throughout. It is now projected to have an 8.7% CAGR from 2021 to 2026 on its planned G8.5 RGB OLED investments for IT. BOE overtook LGD for #2 in 2020 and is expected to maintain that spot throughout the forecast with its share rising to 20% in 2026, down from 24% last quarter on fab delays, on an 18% CAGR. In 2026, LGD is expected to be #3 followed by Visionox, Tianma, EDO and China Star.
In flexible OLED capacity, we show SDC holding onto its advantage with at least a 32% share through the forecast. BOE’s share rises to 25% in 2022, and then declines to 24% in 2026. LGD holds on to the #3 position through 2024 with Tianma rising to #3 from 2025 with LGD falling to #4, Visionox at #5 and China Star #6.
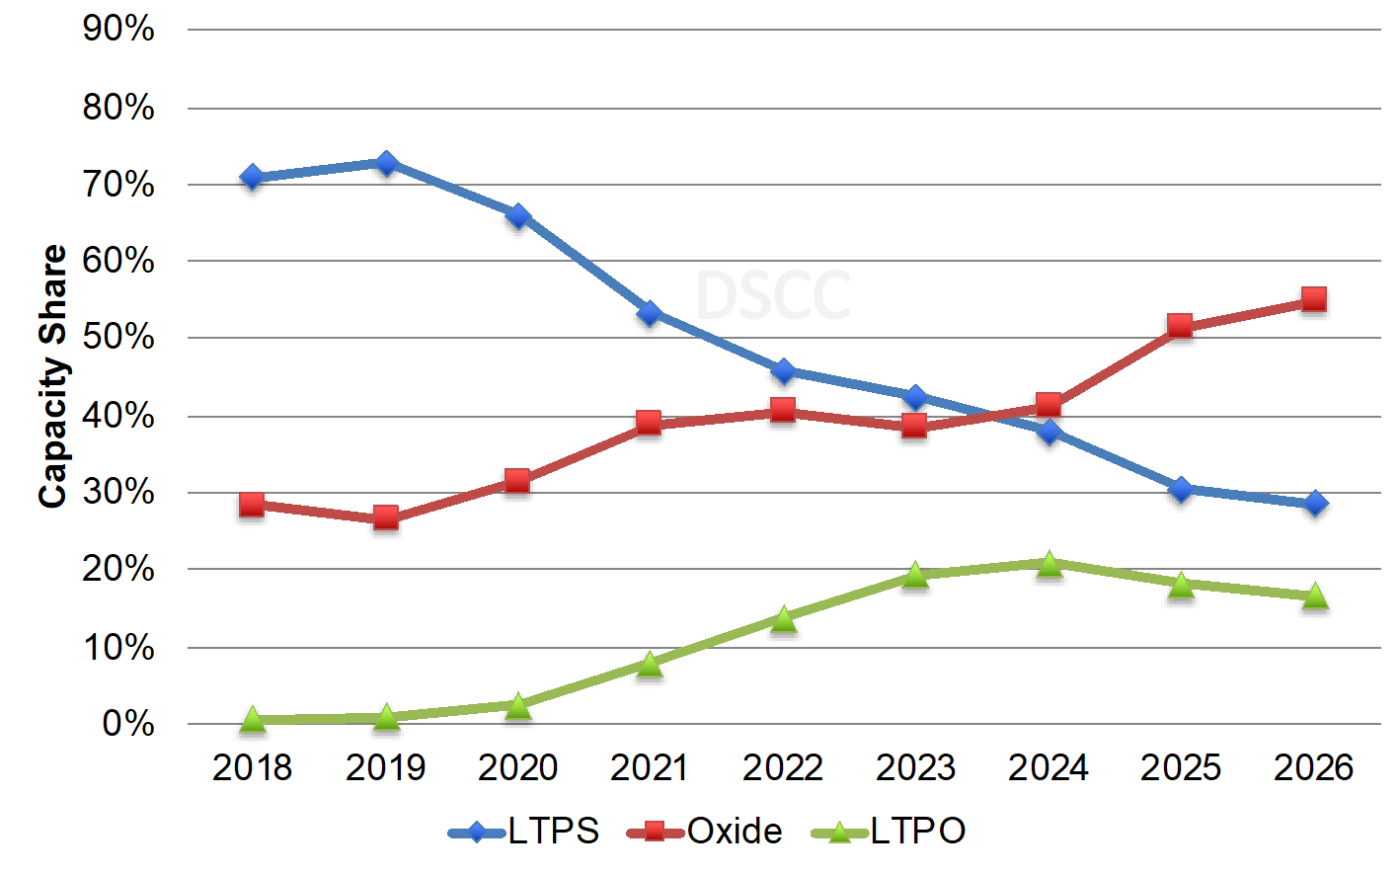
In terms of OLED capacity by backplane, which is seeing a lot of shifting, LTPO is expected to grow at a five-year CAGR of 61% from 2021 to 2026 to reach a 17% share of OLED capacity. IGZO is expected to grow at a 29% CAGR, rising from a 39% share in 2021 to a 55% share in 2026 on the IT OLED opportunity, earning the top spot from 2024 to 2026. The LTPS share is expected to fall from 66% in 2020 to a 29% share in 2026 on fewer OLED smartphone capacity investments and just a 2% CAGR.
OLED Capacity by Backplane Technology
For more information on this report, please contact info@displaysupplychain.co.jp.
本記事の出典調査レポート
Quarterly Display Capex and Equipment Market Share Report
一部実データ付きサンプルをご返送
ご案内手順
1) まずは「お問い合わせフォーム」経由のご連絡にて、ご紹介資料、国内販売価格、一部実データ付きサンプルをご返信します。2) その後、DSCCアジア代表・田村喜男アナリストによる「本レポートの強み~DSCC独自の分析手法とは」のご説明 (お電話またはWEB面談) の上、お客様のミッションやお悩みをお聞かせください。本レポートを主候補に、課題解決に向けた最適サービスをご提案させていただきます。 3) ご購入後も、掲載内容に関するご質問を国内お客様サポート窓口が承り、質疑応答ミーティングを通じた国内外アナリスト/コンサルタントとの積極的な交流をお手伝いします。