FPD生産能力の最新予測~引き下げ傾向続く
出典調査レポート Quarterly Display Capex and Equipment Market Share Report の詳細仕様・販売価格・一部実データ付き商品サンプル・WEBご試読は こちらから お問い合わせください。
これらDSCC Japan発の分析記事をいち早く無料配信するメールマガジンにぜひご登録ください。ご登録者様ならではの優先特典もご用意しています。【簡単ご登録は こちらから 】
冒頭部和訳
DSCCではかつて、LCD市況の改善を受けてFPD生産能力予測をレポート発行時に6回連続で引き上げたが、その後に市況は悪化し低迷が継続、生産ライン計画の延期や中止により6四半期連続でFPD生産能力予測を引き下げることになった。FPD価格はQ2’23までキャッシュコストを超えることはないと予測される。最新の2027年生産能力予測は前回予測から1%引き下げ、2026年生産能力はピークレベルから12%減少となっている。DSCCの Quarterly Display Capex and Equipment Market Share Report では、2021年から2027年のFPD生産能力の年平均成長率が2.2%から2.0%に引き下げられている。生産ライン計画の中止や延期により、OLEDとLCDともに生産能力予測は引き下げとなっている。LCDの2021年から2027年の年平均成長率はVedandaのインド工場を考慮して1.5%から1.6%に上昇したが、OLEDについては第8.7世代の延期が増えたため9.2%から6.3%に低下している。
The Display Capacity Outlook Continues to Fall
※ご参考※ 無料翻訳ツール (DeepL)
After upgrading display capacity for six straight issues on improved market conditions in LCDs, we have now lowered display capacity for six consecutive quarters on delays and cancellations as conditions worsen and remain weak. Display prices are not expected to exceed cash costs until Q2’23. Our latest capacity forecast for 2027 is down 1% vs. our previous forecast and 2026 is down 12% from peak levels. The 2021-2027 display capacity CAGR was downgraded from 2.2% to 2.0% in our Quarterly Display Capex and Equipment Market Share Report. Both OLED and LCD capacity forecasts came down on fab cancellations and delays. We increased our LCD 2021-2027 CAGR from 1.5% to 1.6% on the Vedanta Indian fab, with OLEDs reduced from 9.2% to 6.3% on more G8.7 delays.
By frontplane technology:
- LCD capacity will remain significantly higher than OLED capacity throughout the forecast period despite significantly faster growth for OLED, 6.3% CAGR from 2021 to 2026 vs. LCD at a 1.6% CAGR.
- OLED capacity is projected to reach a 10.1% share in 2027, gaining share every year vs. 8.4% in 2022.
By application:
- LCD TV/IT will continue to dominate the forecast with at least a 73% share through 2027 followed by LCD Mobile/IT with at least a 17% share.
- OLED Mobile/IT will rise from a 5% share to a 6% share in 2027 with OLED TV/IT rising from a 3% to a 4% share.
- OLED Mobile/IT is expected to enjoy the fastest growth from 2021-2027 at a 7.4% CAGR followed by OLED TV/IT at 4.4% with LCD TV/IT at 2.1% and LCD Mobile/IT at -0.3% CAGR.
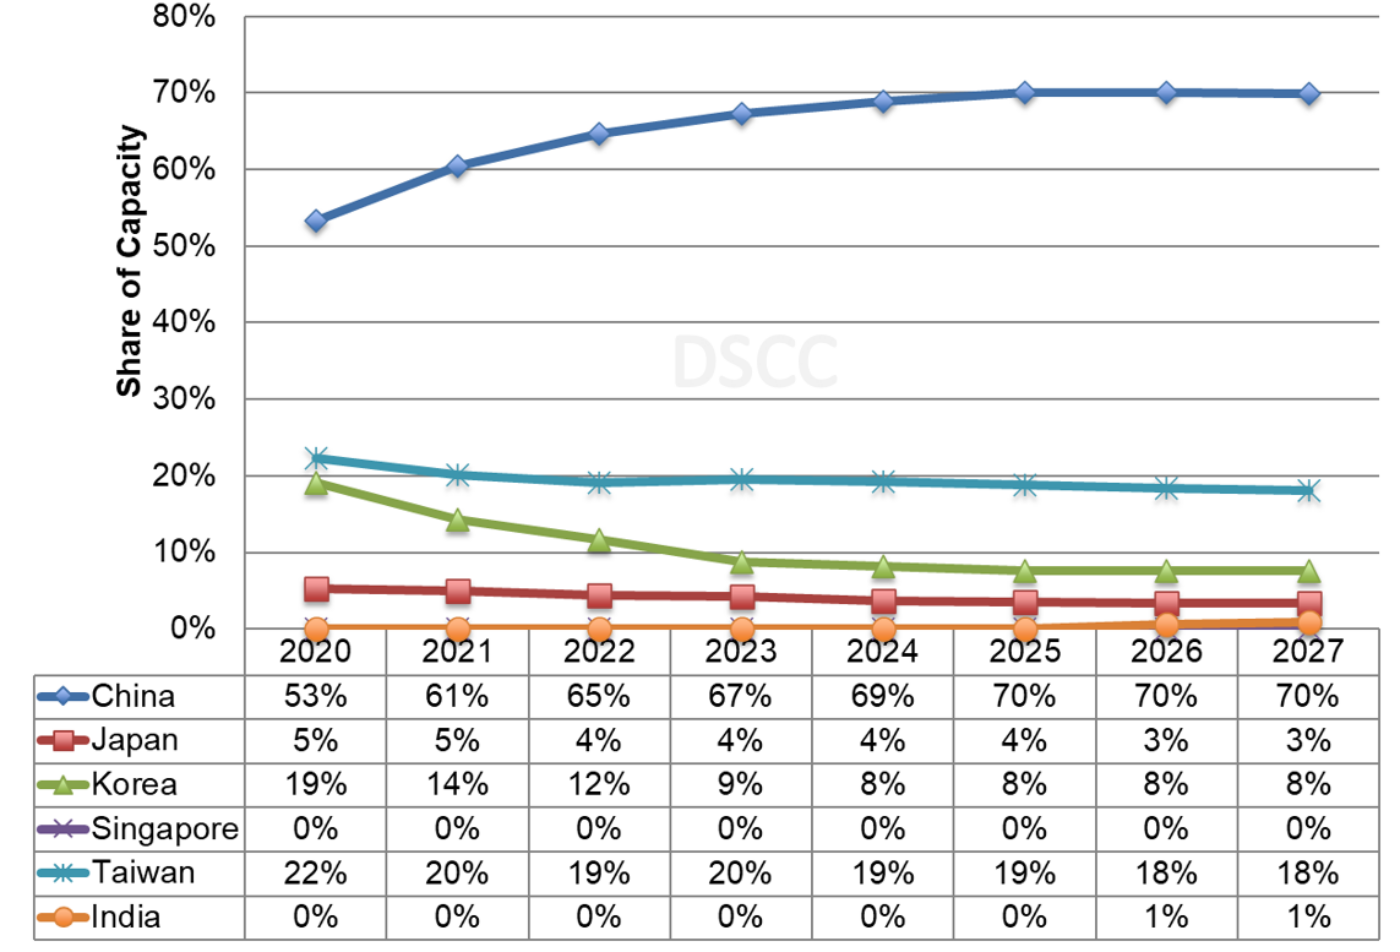
By region:
- China is expected to dominate display capacity, growing from a 61% share in 2021 to a 70% from 2025-2027. China’s capacity is expected to grow at a 4.5% CAGR.
- Korea’s share is expected to fall from 14% in 2021 to 8% in 2027, same as last quarter, on a -8.2% CAGR.
- Taiwan is expected to grow at a 0.3% CAGR from 2021 to 2027 although its share will fall from 20% in 2021 to 18% in 2027. Materials suppliers have not yet been alerted to any fab closures in Taiwan, so for now we have kept all of Taiwan’s capacity in place.
- India is expected to invest from 2025 through Vedanta and reach a 1% share in 2027.
- China is projected to have at least a 47% share in all applications/technologies by the end of the forecast period with a 78% share in TVs/IT.
Regional Share of Display Capacity
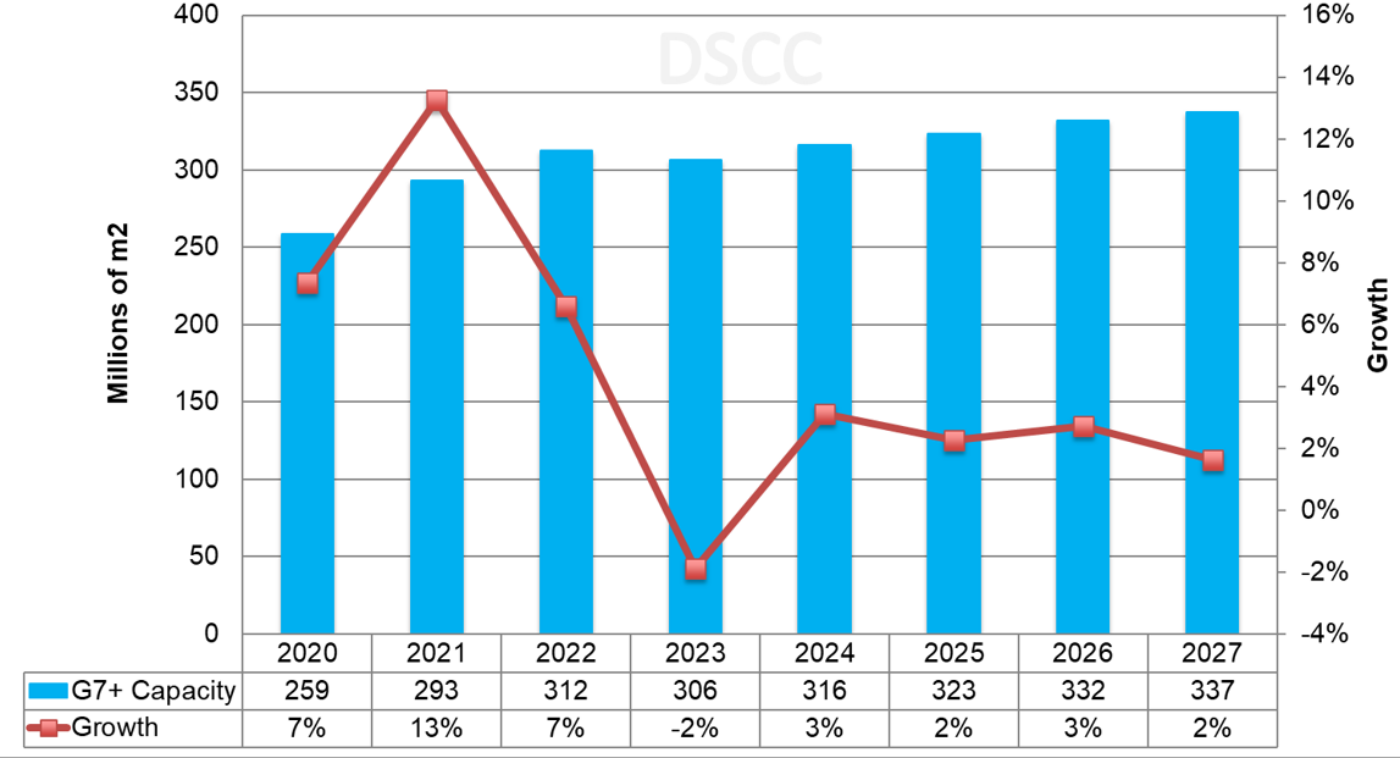
By glass size:
- G7+ capacity for LCDs and OLEDs is now expected to rise at a 2.4% CAGR from 2021 – 2027, down from 2.5% last quarter covering 2021-2027. After double-digit growth in 2021, 2022 capacity growth slowed to 7% and is expected to be followed by a 2% decline in 2023 on fab delays and closures on weak market conditions. 3% growth is expected in 2024 followed by a 2%-3% growth from 2025-2027.
G7+ Display Capacity Forecast
By backplane:
- a-Si is expected to decline from an 84% share of backplane capacity in 2021 to 82% in 2027 on greater demand for Advanced TV and IT display technologies and increased penetration by mobile/IT OLEDs. a-Si capacity is now expected to rise at just a 1.6% CAGR from 2021 to 2027, up from 1.4%.
- Oxide is expected to maintain 8% from 2020 to 2027 on the growth in OLED TV, IT OLED and IT LCD capacity from both new fabs and conversions, rising at a 3.4% CAGR from 2021 to 2027, down from 9% last quarter, and overtaking LTPS capacity in 2022.
- LTPS is expected to grow at a 0.8% CAGR, down from 1%, with its share falling from 8% in 2021 to 7% in 2027.
- LTPO is expected to grow at 30.6% CAGR, up from 30%, and reach a 2% share from 2023 on demand for variable refresh rates in mobile devices resulting in both improved performance and lower power.
For OLED Capacity by backplane:
- LTPO capacity is expected to grow at a 2021-2027 CAGR of 29% to reach a 25% share of OLED capacity.
- Oxide is expected to grow at a 7% CAGR to a 40% share in 2027 on IT and TV investments.
- The LTPS share is expected to fall from 54% in 2021 to a 35% share in 2027, on a -1.1% CAGR.
By manufacturer by type of display capacity:
Display Capacity
- BOE is expected to maintain a large advantage in total display capacity, but its CAGR from 2021-2027 is now expected to be just 2.6%. LGD was surpassed by China Star in 2022 and is expected to be surpassed by HKC in 2023 and Innolux in 2024 as it reduces its LCD capacity. Tianma is expected to have the fastest growth on TM18 and TM19 rising at a 19% CAGR to reach a 3.6% share in 2027.
LCD Capacity
- BOE’s 2021-2027 LCD capacity is expected to rise at a 2.3% CAGR, same as last quarter, with its LCD market share rising from 25% in 2021 to 26%-27% from 2024-2027. China Star’s LCD capacity is expected to rise at an 8.6% CAGR enabling its share to rise from 13% in 2021 to 19% from 2025-2027. HKC is now expected to reach #3 from 2023.
OLED Capacity
- While SDC led in OLED capacity in 2020, LGD is expected to lead from 2021 with a four-to-seven point advantage. LGD is growing at a 4.1% 2021-2027 CAGR with SDC rising at a 4.9% CAGR. BOE is expected to remain #3 throughout the forecast with a 10%-13% share on a 10.8% CAGR. Tianma is expected to reach #4 and a 5%-6% share on a 17.4% CAGR. Visionox is expected to rise to #5 and a 5% share on a 13.6% CAGR.
Mobile/IT OLED Capacity
- In unyielded mobile OLED capacity, SDC will maintain a dominant position throughout the forecast, with its share around 40% due to its strong position in both rigid and flexible OLEDs. It is now projected to grow at a 2.4% CAGR from 2021 to 2027. BOE is expected to maintain the #2 position throughout the forecast with its share flattish at 17% - 20% from 2021-2027 on a 10.8% CAGR. In 2027, LGD is expected to be #3 followed by Tianma, Visionox, EDO and China Star.
Flexible OLED Capacity
- In unyielded flexible mobile OLED capacity, we show SDC holding onto its advantage although its share will fall from 40% in 2021 to 29% in 2027 on just a 1.3% CAGR. BOE’s share is flattish from 2021 to 2027 at around 25% on a 7.1% CAGR. LGD holds on to the #3 position through 2024 with Tianma rising to #3 from 2025 with LGD at #4, Visionox at #5 and China Star #6. LGD grows at a 3.3% CAGR with Tianma rising at 21.6%, Visionox 17% and China Star at 12.2%.
For more information on display capacity, please see our Quarterly Display Capex and Equipment Market Share Report.
出典調査レポート Quarterly Display Capex and Equipment Market Share Report の詳細仕様・販売価格・一部実データ付き商品サンプル・WEBご試読は こちらから お問い合わせください。