TV用LCD価格月報~夏の暑さで徐々に下落
これらCounterpoint Research FPD部門 (旧DSCC) 発の分析記事をいち早く無料配信するメールマガジンにぜひご登録ください。ご登録者様ならではの優先特典もご用意しています。【簡単ご登録は こちらから 】
TV用LCD価格月報~夏の暑さで徐々に下落
2年連続で夏はTV用LCD価格が軟調な時期となっている。最近の価格変動傾向は以前に比べて緩やかで、冬季に上昇し夏季に下落する季節的パターンが定着しつつある。長期的な激しい価格変動のパターンと比べ、最近のパターンはかなり穏やかなものとなっている。
一部の需要好転シグナルを受け、FPDメーカー各社はQ1'25からQ2'25にかけて稼働率を引き上げた。中国で実施された補助金制度により、TV販売は小幅ながら増加した。また、OEM各社がトランプ大統領の関税引き上げを見越して在庫確保を急いだため、ITセクターで需要が前倒しされた。Q1'25は旧正月休暇を含む時期で例年FPDメーカーの操業停止期間があるにもかかわらず、TFT LCD投入量は前期比6%増だったと推定され、Q2'25の投入量は前期比横ばいだった。関税政策がほぼ判明し需要に対するネガティブな影響が明らかになったため、メーカー各社は今年前半に輸入した在庫を売却しており、パネル需要は軟調となっている。
一つ目のグラフは2025年10月までのTV用LCD価格動向の最新予測である。このグラフは、安定期が開始した2023年夏から始まっている。これまでに3回の緩やかな上昇と3回の緩やかな下落が見られ、現在は3回目の下落の真っただ中にある。現時点では下落の終わりが見えず、Q4'25初め頃まで続くと考えられる。
7月の価格はほとんどのサイズで当社予測を下回った。4月から一部のサイズにリベートが適用され、価格が「水面下で」下がり始めていたことが、当社の価格推定に反映されていなかったためである。こうした水面下の値下げは7月に入って公式価格に反映され、その結果月次価格下落は通常より大きくなった。当社の調査では、7月価格は前月比3.2%下落となっている。
TV用LCD価格
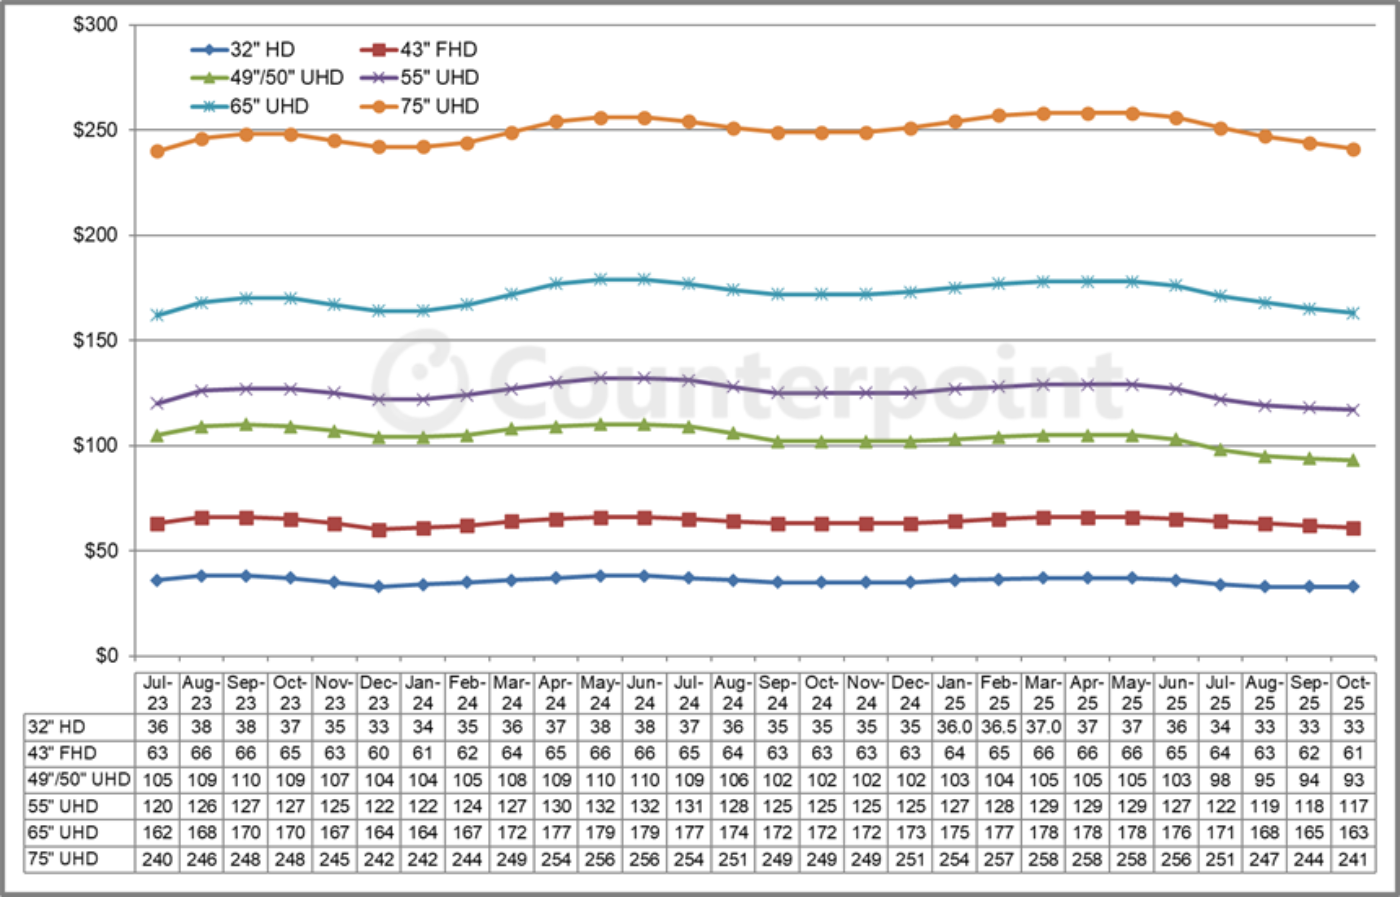
Q1’25の価格はQ4’24の価格を平均2.8%上回った。価格は第2四半期に下落し始めたが、平均価格は第1四半期を0.5%上回った。現在、第3四半期の価格は平均6.2%の下落が予測されており、これは2022年以来最大の前期比下落率となる。
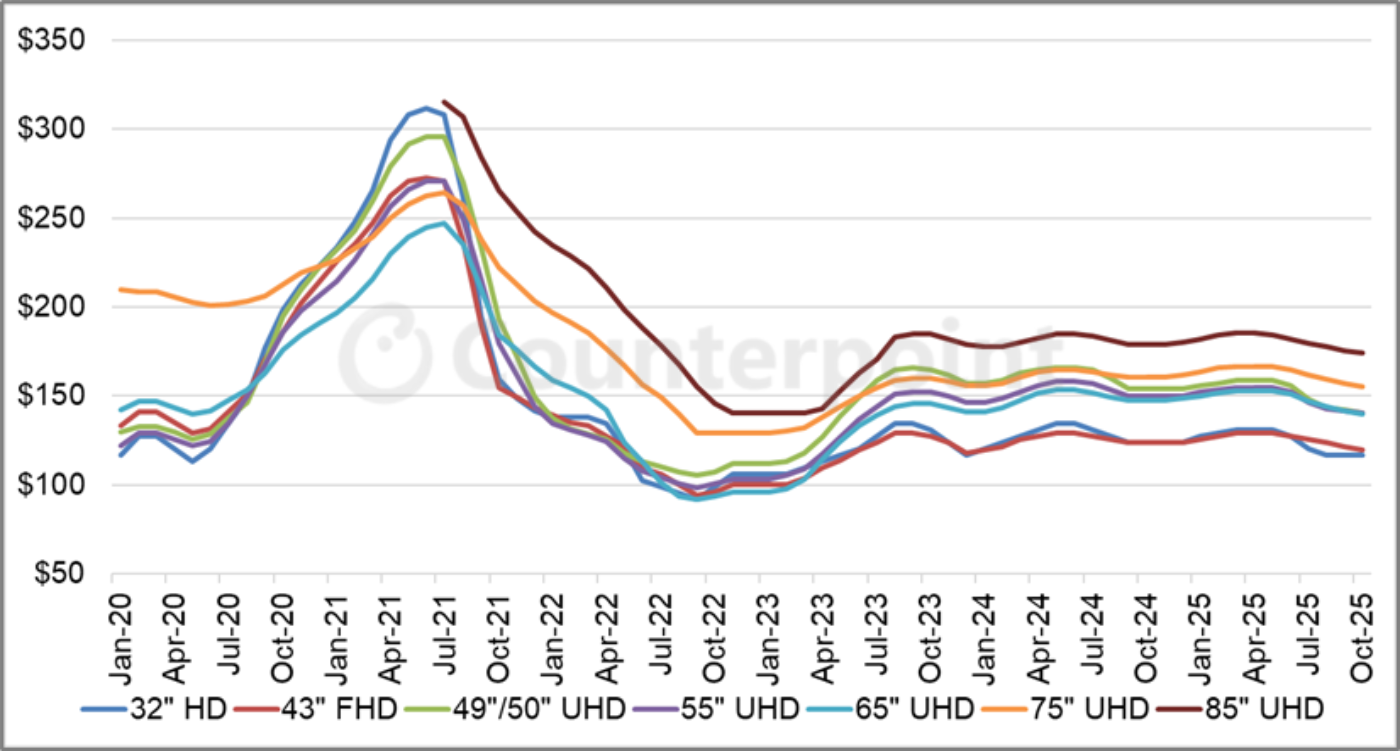
面積ベースの価格のグラフを見ると、パンデミック後の急騰と急落を経て、価格はすでに2年以上、狭い範囲にとどまっていることがわかる。この安定期では、製品は以下の3つの水準に分類される。
- 最安価格帯の製品は32インチと43インチで、最もコモディティ化したサイズである。32インチは価格が上昇すると勢いづく傾向にあるが、価格が下落すると勢いを失って後退するようだ。これら2サイズの製品は、第8.5世代 (32インチ) と第10.5世代 (43インチ) で基板1枚あたり18面取りが可能で生産効率が良い。2023年7月から2025年8月までの全予測期間中、43インチの価格は1平方メートルあたり118ドルから129ドルの間で推移している。2025年8月には32インチが最近の最安値である1平方メートルあたり117ドルに一致すると予測される。
- 中価格帯の製品は49インチ/50インチ、55インチ、65インチで、最大サイズは通常最も高い価格帯に位置する。これらのサイズも第8.5世代 (49インチ/50インチ、55インチ) と第10.5世代 (65インチ) で生産効率が良い。これらのサイズの価格は1平方メートルあたり139ドルから167ドルの間で変動している。
- 75インチと85インチはプレミアム製品である。75インチは2023年に一時的に中価格帯まで下落したが、現在では小型サイズに比べて10-15ドル高いプレミアムを取り戻している。85インチはこの期間中に176ドルから185ドルの間で変動し、75インチに比べて1平方メートルあたり15-12ドル高いプレミアムを維持している。
TV用LCD面積価格 (1平方メートルあたり)
最後のグラフは2015年から2025年8月までの長期的視点によるTV用LCD価格指数を示している。2024年初頭の価格上昇によって指数は2024年中盤に45.6というピークを記録、2023年のピークをわずかに上回り、2022年9月の過去最低値を49%上回った。これに続く谷は2024年9月の43.1で、2025年上半期のピークは3月、4月、5月の44.8だった。価格指数は9月に2023年6月以来の最低値である40.7まで下がると予測される。
TV用LCD価格指数
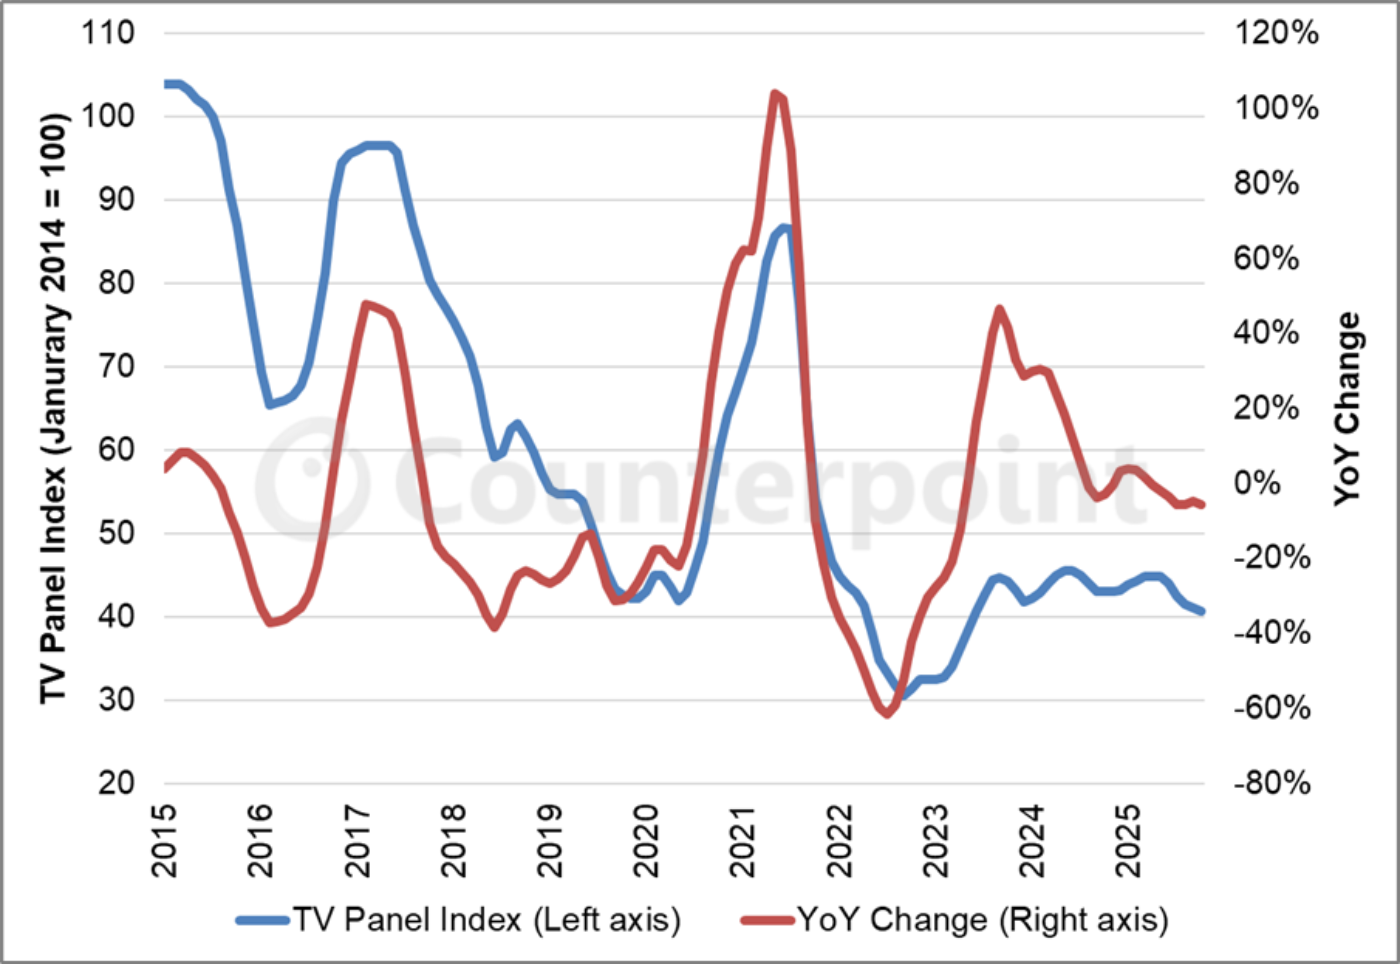
グラフの青線をたどると、2023年中盤から現在までの期間は、2015年から2023年までの期間とは根本的に異なっていることがわかる。価格の乱高下はもはや見られない。2025年7月現在、価格指数は24ヵ月間にわたって40.7から45.6という比較的狭い範囲に収まっており、少なくとも2025年10月まではこの範囲にとどまると予測される。
全体として、価格は、中国FPDメーカーが政府補助によるコスト面の優位性を背景に小幅な利益を確保でき、台湾FPDメーカーが損益分岐点付近にあるような水準で推移しているようだ。第2四半期の平均価格が第1四半期よりもやや高くなったことで、第2四半期のFPDメーカーの収益性もそれに倣うものと考えられる。
[原文] LCD TV Panel Prices Wilting in Summer Heat
For the second year in a row, summer has been a soft spot for LCD TV panel prices. The recent pattern of more gentle fluctuations in price seems to be settling into a seasonal pattern where prices increase over the winter and decrease in the summer months. Compared to the long-term pattern of wild price swings, the recent pattern is vastly more moderate.
Some positive demand signals led panel makers to increase utilization in Q1 and Q2 2025. A subsidy program implemented in China led to a modest uptick in TV sales, while there was some demand pulled forward, especially in the IT sector as OEMs rushed to stock inventory in anticipation of Trump’s tariffs. We estimate that TFT LCD input increased 6% QoQ in Q1 2025 even with the Lunar New Year holiday, which traditionally is a shutdown period for panel makers, and input was flat QoQ in Q2 2025. Now that the tariff policy is mostly known and generally negative for demand, manufacturers are selling off inventory imported earlier this year, leading to soft demand for panels.
The first chart here highlights our latest TV panel price update with a forecast through October 2025. The chart starts with the summer of 2023, the beginning of this period of stability. We have seen three mild rallies and three mild slumps, and we are in the middle of the third slump. At this point we cannot see the end of the slump, and expect it to extend to the beginning of Q4 2025.
Most prices in July came in lower than our expectations. We understand that prices started to decrease “under the table” in April with rebates for some sizes, which are not reflected in our price estimate. These unofficial decreases became official in July, leading to a larger-than usual MoM price drop. The prices in our survey decreased 3.2% MoM in July.
Q1 2025 prices were an average of 2.8% higher than Q4 2024 prices, and although prices started to decline in Q2, the average price was still 0.5% higher than Q1. We now forecast that prices in Q3 will decline by an average of 6.2%, the largest QoQ decline since 2022.
As we look at pricing in terms of area, after the pandemic boom and bust it has now been more than two years that prices have stayed within a narrow range. In this period of stability, the products fall into three levels:
- The lowest-priced products are 32” and 43”, the most commoditized sizes. 32” panels seem to get a kick when prices increase but then fall back when prices decline. These two products are efficient 18 cuts per substrate on Gen 8.5 (32”) and Gen 10.5 (43”). During the whole period from July 2023 to our forecast for August 2025, the 43” panel price has stayed between $118 and $129 per square meter. We forecast the 32” panel to match its recent low point in August 2025 at $117 per square meter.
- The mid-tier products are 49”/50”, 55” and 65”, with the largest size usually coming at the highest price. These sizes are also made efficiently on Gen 8.5 (49”/50” and 55”) and Gen 10.5 (65”). These panels have fluctuated between $139 and $167 per square meter.
- The 75” and 85” panels are the premium products. The 75” panels briefly fell to the mid-tier in 2023 but appear to have regained a premium of $10-15 over the smaller sizes. The 85” panel has fluctuated between $176 and $185 during this period, a premium of $15-$20 per square meter over the 75”.
Our final chart in this sequence shows our LCD TV panel price index, taking a longer view from 2015 through June 2025. The price increases in early 2024 brought our index up to a peak of 45.6 at mid-year 2024, slightly higher than the peak in 2023 and 49% higher than the all-time low of September 2022. The next trough was in September 2024 at 43.1, and the peak in 1H 2025 was at 44.8 in March, April and May. We now expect the panel price index to decline to 40.7 in September, its lowest point since June 2023.
Following the blue line in the chart, we can see that the period from mid-2023 to today is radically different than the period from 2015 to 2023. We no longer have wild swings in prices. As of July 2025, our price index remained within a relatively tight range of 40.7 to 45.6 for 24 months, and we expect that prices will stay within this range at least through October 2025.
Overall, prices seem to be fluctuating around a level that allows the Chinese panel makers, with a cost advantage from government subsidies, to make a small profit while Taiwanese panel makers come close to breakeven. With the average prices in Q2 coming in slightly higher than Q1, we can expect the profitability of panel makers in Q2 to follow suit.
