TV用LCD価格月報~第2四半期は下落傾向
これらCounterpoint Research FPD部門 (旧DSCC) 発の分析記事をいち早く無料配信するメールマガジンにぜひご登録ください。ご登録者様ならではの優先特典もご用意しています。【簡単ご登録は こちらから 】
TV用LCD価格月報~第2四半期は下落傾向
年初から続いたTV用LCD価格の上昇が終息した。LCDメーカーが3月に稼働率を引き上げたことで需給バランスが変化し、価格は第2四半期にピーク到達後、下落に転じた。ただし、第2四半期の価格下落は緩やかで、価格は比較的狭い範囲で推移し、比較的安定した状態がかつてないほど続いている。
Q1’25はポジティブな需要シグナルがいくつか見られたことでFPDメーカーの稼働率が上昇した。中国で実施された補助金制度により、TV販売は小幅ながら増加した。また、OEM各社がトランプ大統領の関税引き上げを見越して在庫確保を急いだため、ITセクターで需要が前倒しされた。旧正月休暇を含むこの時期は例年、FPDメーカーの操業停止期間があり、稼働日数が少なかった (第4四半期の92日に対して第1四半期は90日) にもかかわらず、TFT LCD投入量は前期比6%増だったと推定される。
一つ目のグラフは2025年7月までのTV用LCD価格動向の最新予測である。このグラフは、価格が2022年9月に過去最低値を記録した後の上昇局面から始まっている。価格はQ2’23からQ3’23にかけて上昇した後、2度の緩やかな下落と2度の緩やかな上昇を含む安定期が現在まで続いており、Q2’25には3度目の緩やかな下落が始まっている。
4月の価格はおおむね、前月比で横ばいになるだろうという当社予測通りの結果となった。先月の予測では5月から価格が下落に転じると見ていたが、現在もその見通しは変わっていない。ただし、一部の大型画面サイズでは、5月の前月比下落幅は1ヵ月前の見通しよりも緩やかになっている。
TV 用LCD価格
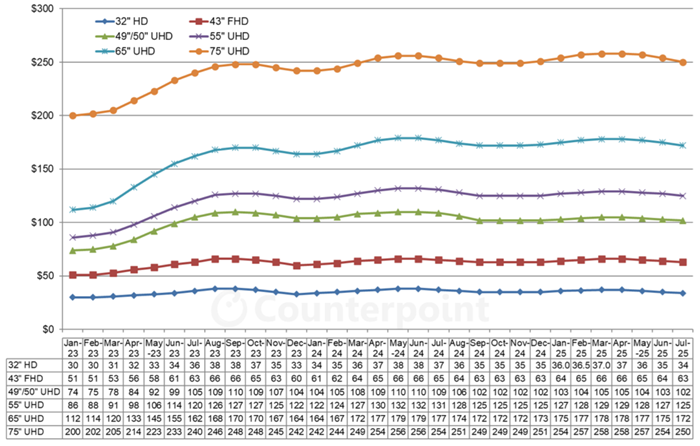
価格はQ4’24に横ばい傾向となり平均2.0%下落した。Q1’25の価格はQ4’24の価格を平均2.8%上回った。価格は1月から3月にかけて上昇し4月から6月にかけて下落していることから、第2四半期の平均価格はほとんどの画面サイズで第1四半期と同水準になると予測される。当社予測対象の最小画面サイズである32インチのみ第2四半期は平均価格がやや下落することから、全画面サイズの平均価格変動は0.2%下落の見通しである。
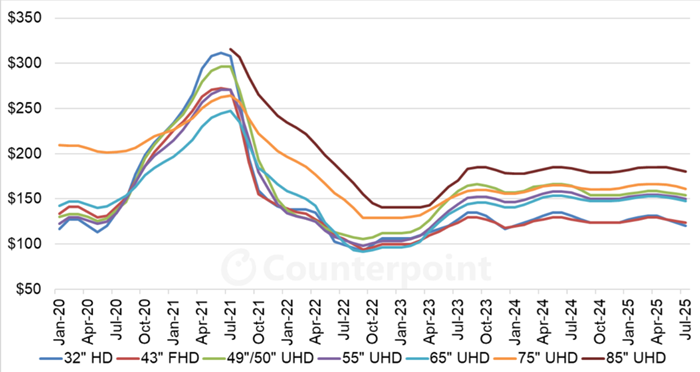
面積ベースの価格のグラフからは、価格安定期が比較的長く続いているという特徴が読み取れる。価格はもう2年近くも狭い範囲にとどまっている。この安定期では、製品は以下の3つの水準に分類される。
- 最安価格帯の製品は32インチと43インチで、最もコモディティ化したサイズである。32インチは価格が上昇すると勢いづく傾向にあるが、価格が下落すると勢いを失って後退するようだ。これら2サイズの製品は、第8.5世代 (32インチ) と第10.5世代 (43インチ) で基板1枚あたり18面取りが可能で生産効率が良い。2023年7月から2025年7月までの全予測期間中、43インチの価格は1平方メートルあたり118ドルから129ドルの間で推移している。
- 中価格帯の製品は49インチ/50インチ、55インチ、65インチ、75インチで、最大サイズが通常、最高価格で販売される。これらのサイズも第8.5世代 (49インチ/50インチ、55インチ) と第10.5世代 (65インチ、75インチ) で生産効率が良い。これらのサイズの価格は1平方メートルあたり139ドルから167ドルの間で変動している。75インチは3月から4月にかけて166ドルでピークに達したが、2023年中盤まではプレミアム価格で取引されていた。
- 唯一のプレミアム製品は85インチで、この間178ドルから185ドルの間で変動しており、1平方メートルあたり20ドル近いプレミアムとなっている。
TV用LCD面積価格 (1平方メートルあたり)
最後のグラフは2015年から2025年6月までの長期的視点によるTV用LCD価格指数を示している。2024年初頭の価格上昇によって指数は2024年中盤に45.6というピークを記録、2023年のピークをわずかに上回り、2022年9月の過去最低値を49%上回った。これに続く谷は2024年9月の43.1で、Q1’25のピークは3月と4月の44.7だった。価格指数は7月に42.9まで下がると予測される。
TV用LCD価格指数
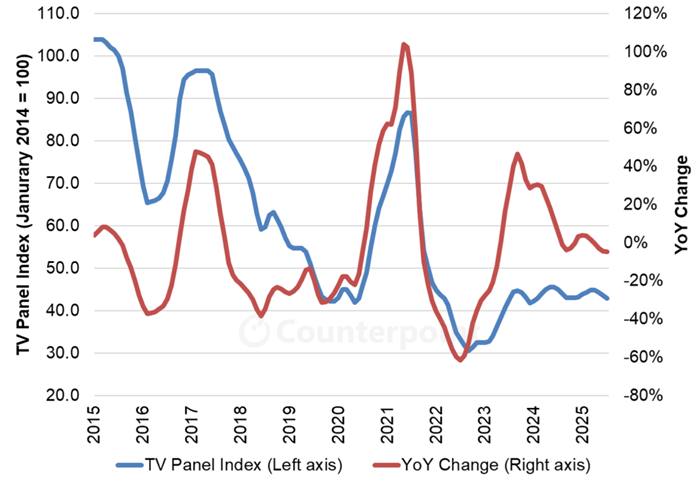
グラフの青線をたどると、2023年中盤から現在までの期間は、2015年から2023年までの期間とは根本的に異なっていることがわかる。価格の乱高下はもはや見られない。2025年4月現在、価格指数は21ヵ月間にわたって41.8から45.6という比較的狭い範囲に収まっており、少なくとも2025年7月まではこの範囲にとどまると予測される。
第1四半期の価格上昇から予想された通り、Q1’25決算発表済みのFPDメーカーは増益を報告している。全体として、価格は、中国FPDメーカーが政府補助によるコスト面の優位性を背景に小幅な利益を確保でき、台湾FPDメーカーが損益分岐点付近にあるような水準で推移しているようだ。これは投資に対する十分なリターンをもたらすものではないが、過去の供給過剰期に見られた深刻な損失と比べれば、はるかに良好な状況である。
[原文] LCD TV Panel Prices Declining in Q2
The rally in LCD TV panel prices that started at the beginning of the year has run its course. When panel makers started increasing utilization in March, the demand-supply balance shifted and prices peaked before starting to decline in Q2. However, the Q2 declines are moderate, with prices staying in a relatively small range and continuing the unprecedented run of relative stability.
Some positive demand signals led panel makers to increase utilization in Q1 2025. A subsidy program implemented in China led to a modest uptick in TV sales, while there was some demand pulled forward in the IT sector as OEMs rushed to stock inventory in anticipation of Trump’s tariffs. We estimate that TFT LCD input increased 6% QoQ even with the Lunar New Year holiday, which traditionally is a shutdown period for panel makers, and with the smaller number of days (Q1 had 90 days against 92 days in Q4).
The first chart here highlights our latest TV panel price update with a forecast through July 2025. The chart starts with the rally that began after prices hit all-time lows in September 2022. Prices increased in the middle two quarters of 2023, followed by a period of stability with two mild slumps and two mild rallies up to now, and the third mild slump starting in Q2 2025.
Most prices in April came in right in line with our expectations that prices would be flat compared to March. Last month, we projected that prices would start to decline in May, and that is still our prediction. But on some of the larger screen sizes, the MoM decline in May is more moderate than our outlook one month ago.
Prices in Q4 2024 saw an average decrease of 2.0% as they flattened out. Q1 2025 prices were an average of 2.8% higher than Q4 2024 prices. With prices increasing from January to March and then decreasing from April to June, we now estimate that the average price for most screen sizes in Q2 will be the same as Q1. Only the smallest screen size in our mix, 32”, will have a slightly lower average price in Q2, and thus the average price change across all screen sizes is expected to be a 0.2% decline.
As we look at pricing in terms of area, the long period of relative price stability seems to be the characteristic feature of the chart. It has now been nearly two years since prices have stayed within a narrow range. In this period of stability, the products fall into three levels:
- The lowest-priced products are 32” and 43”, the most commoditized sizes. 32” panels seem to get a kick when prices increase but then fall back when prices decline. These two products are efficient 18 cuts per substrate on Gen 8.5 (32”) and Gen 10.5 (43”). During the whole period from July 2023 to our forecast for July 2025, the 43” panel price has stayed between $118 and $129 per square meter.
- The mid-tier products are 49”/50”, 55”, 65” and 75”, with the largest size usually coming at the highest price. These sizes are also made efficiently on Gen 8.5 (49”/50” and 55”) and Gen 10.5 (65” and 75”). These panels have fluctuated between $139 and $167 per square meter. The 75” panels, whose prices peaked in March-April at $166, commanded a premium before mid-2023.
- The only premium product is the 85” panel, which has fluctuated between $178 and $185 during this period, a premium of nearly $20 per square meter.
Our final chart in this sequence shows our LCD TV panel price index, taking a longer view from 2015 through June 2025. The price increases in early 2024 brought our index up to a peak of 45.6 at mid-year 2024, slightly higher than the peak in 2023 and 49% higher than the all-time low of September 2022. The next trough was in September 2024 at 43.1, and the peak in Q1 2025 was at 44.7 in March and April. We now expect the panel price index to decline to 42.9 in July.
Following the blue line in the chart, we can see that the period from mid-2023 to today is radically different than the period from 2015 to 2023. We no longer have wild swings in prices. As of April 2025, our price index remained within a relatively tight range of 41.8 to 45.6 for 21 months, and we expect that prices will stay within this range at least through July 2025.
As we expected based on the price increases in Q1, panel makers that have reported Q1 2025 financial results have reported increased profits. Overall, prices seem to be fluctuating around a level that allows the Chinese panel makers, with a cost advantage from government subsidies, to make a small profit while Taiwanese panel makers come close to breakeven. While this does not allow for a financial return on investments, it is much better than the severe losses during market gluts in prior years.
