FPD生産能力の成長率予測を上方修正~その背景分析 (地域別/用途別/主要メーカー別の動向)
出典調査レポート Quarterly Display Capex and Equipment Market Share Report の詳細仕様・販売価格・一部実データ付き商品サンプル・WEB無料ご試読は こちらから お問い合わせください。
これらDSCC Japan発の分析記事をいち早く無料配信するメールマガジンにぜひご登録ください。ご登録者様ならではの優先特典もご用意しています。【簡単ご登録は こちらから 】
冒頭部和訳
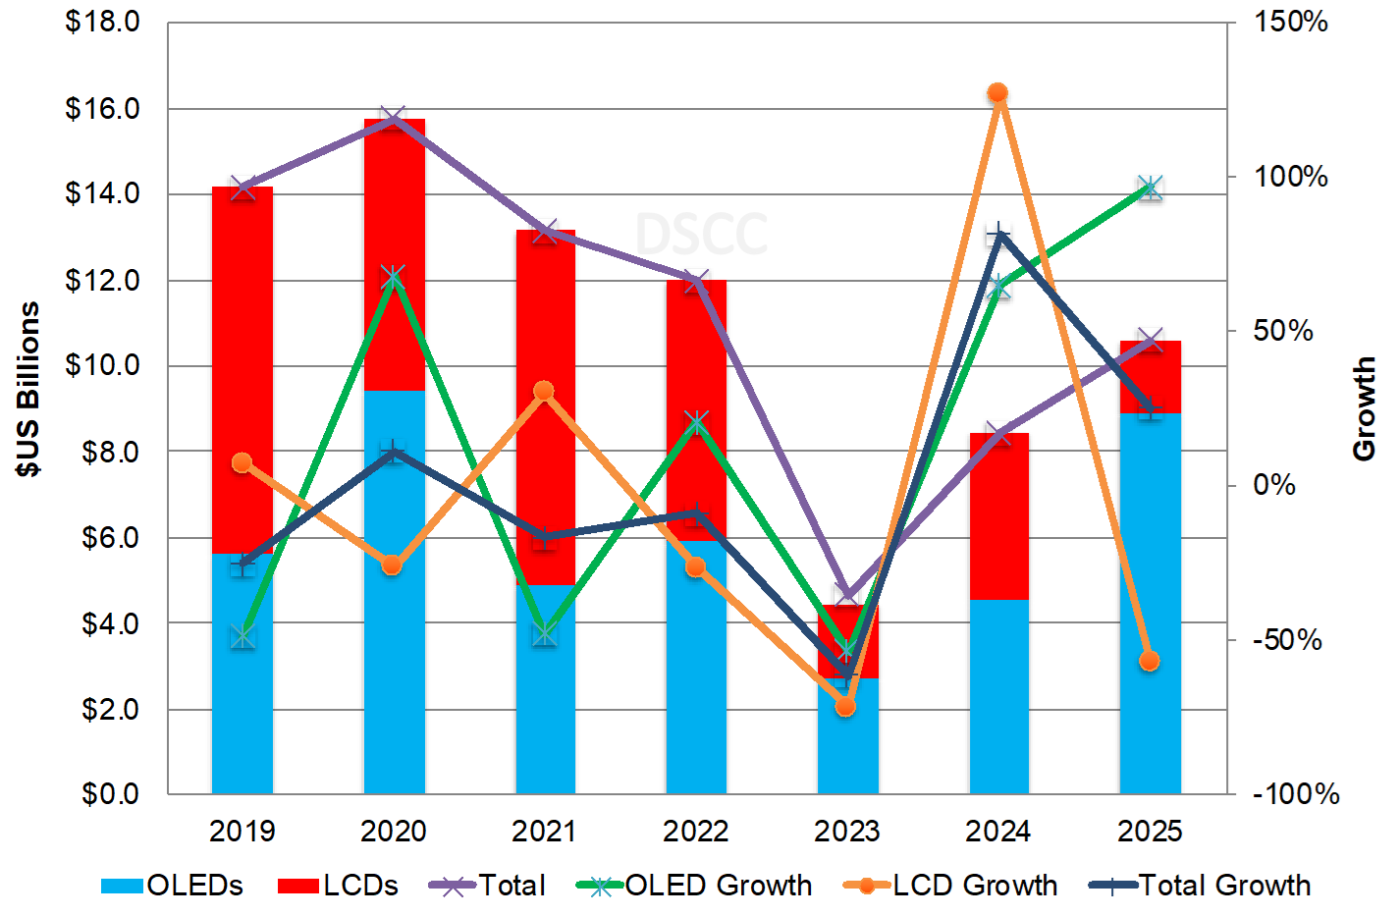
DSCCは11月に Quarterly Display Capex and Equipment Market Share Report の一部である最新のFPD設備投資予測を発表した。2020年-2026年の設備投資額予測は、フォトパターニングを採用した新たな第6世代および第8.7世代ラインの追加を踏まえ、10% (62億ドル) 増の690億ドルとなった。2023年は61%減の47億ドルと失速したが、2024年は82%増の85億ドル、2025年は25%増の106億ドルになると予測されている。OLED投資のシェアは、2024年には54%、2025年には84%、2026年には82%になる見通しだ。
さて、FPD生産能力はどうなるのだろうか? DSCCでは最新の工場スケジュールと設備投資に基づいて、2022年-2027年のFPD生産能力の成長率予測を1.1%から1.4%に上方修正した。2023年の生産能力1%減は複数の工場の縮小または閉鎖によるもので、2024年-2027年にかけては年率2%から3%の成長にとどまると見られる。LCDの低迷を受けて7四半期連続で生産能力を下方修正してきたDSCCのFPD生産能力予測だが、Q4’23版レポートでようやく上方修正となった。しかし、2027年生産能力は前期版レポートから1%増にとどまる。生産能力成長の要因として、フォトパターニングを採用したIT用OLEDに対する追加投資と、以前は閉鎖が予測されていたLCDラインの一部が閉鎖されなかったことが挙げられる。これらの生産能力の伸びが多数の工場閉鎖と縮小を相殺している。
Display Capacity Growth Upgraded, But Still <2% per Year from 2022-2027
※ご参考※ 無料翻訳ツール (DeepL)
DSCC released its latest display equipment spending forecasts in November as part of its Quarterly Display Capex and Equipment Market Share Report. Equipment spending was increased by 10% or $6.2B to $69B from 2020-2026 on the addition of new G6 and G8.7 fabs using photo patterning. As indicated, we now see 2024 up 82% to $8.5B and 2025 up 25% to $10.6B after spending stalled in 2023, down 61% to $4.7B. OLED spending is expected to dominate, accounting for a 54% share in 2024, an 84% share in 2025 and an 82% share in 2026.
Display Equipment Spending
So, what does this mean for display capacity? Based on the latest fab schedules and equipment spending, we upgraded our 2022-2027 display capacity growth forecast from 1.1% to 1.4%. Capacity fell 1% in 2023 on some fabs being downsized or closed and we see just 2% - 3% growth per year from 2024-2027. The Q4’23 report had the first upgrade to our display capacity forecast after downgrading capacity for seven straight quarters on weakness in LCDs. However, we are only showing a 1% increase in 2027 capacity vs. last quarter. Contributing to the increase are additional IT OLED investments using photo patterning and some LCD lines not shutting down that were previously forecasted to shut down. These capacity increases offset more fab closures and downsizing.
Display Capacity Forecast
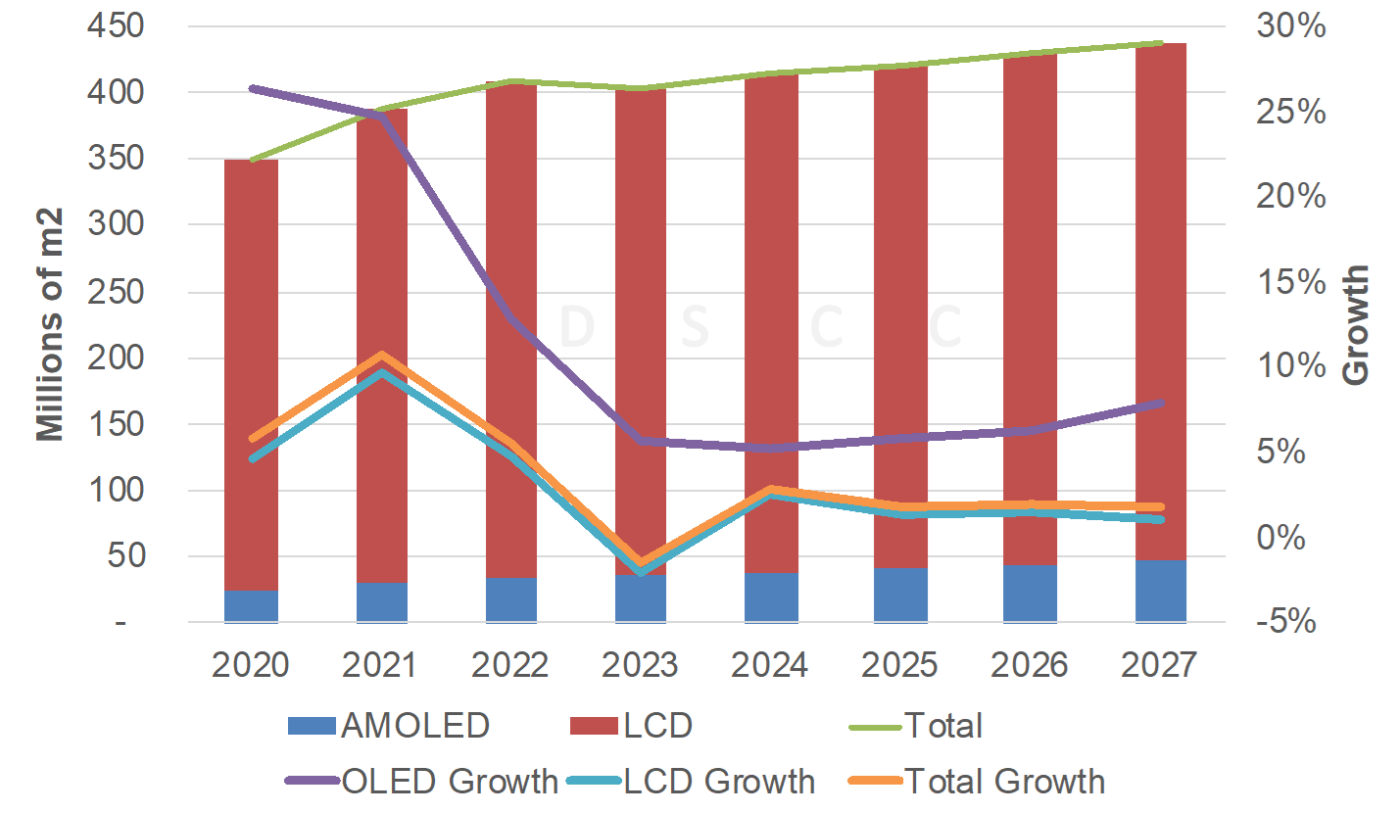
LCD capacity is now forecasted to rise at just a 0.9% CAGR with OLEDs rising at a 6.4% CAGR. LCD capacity will still be much larger than OLED capacity throughout the forecast with OLED capacity rising from an 8.4% share in 2022 to a 10.6% share in 2027, up from 10.3%. With such limited LCD capacity growth, a surge in LCD TV demand along with continued increases in average size would quickly result in a shortage which could happen if China demand recovers to pre-COVID levels, but China has many economic challenges.
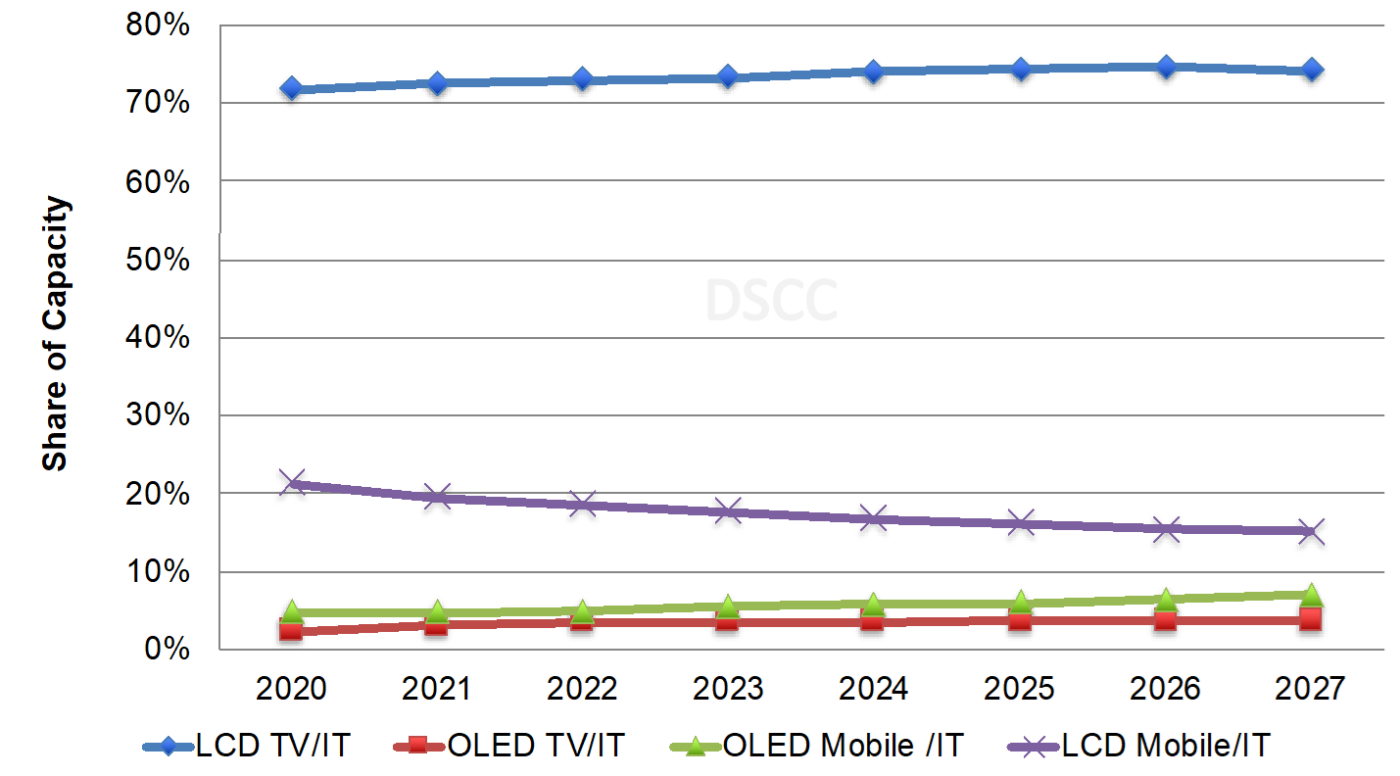
By application:
- LCD TV/IT will continue to dominate the forecast with at least a 73% share through 2027 followed by LCD Mobile/IT with at least a 15% share, down from 16%.
- OLED Mobile/IT will rise from a 5% share to a 7% share in 2027 with OLED TV/IT maintaining a 4% share.
- OLED Mobile/IT is expected to enjoy the fastest growth from 2022-2027 at a 7.3% CAGR, followed by OLED TV/IT at 1.5% with LCD TV/IT at 1.4% and LCD Mobile/IT at -2.2% CAGR as a-Si fabs close and LTPS/oxide capacity is brought on.
Display Capacity Forecast by Application
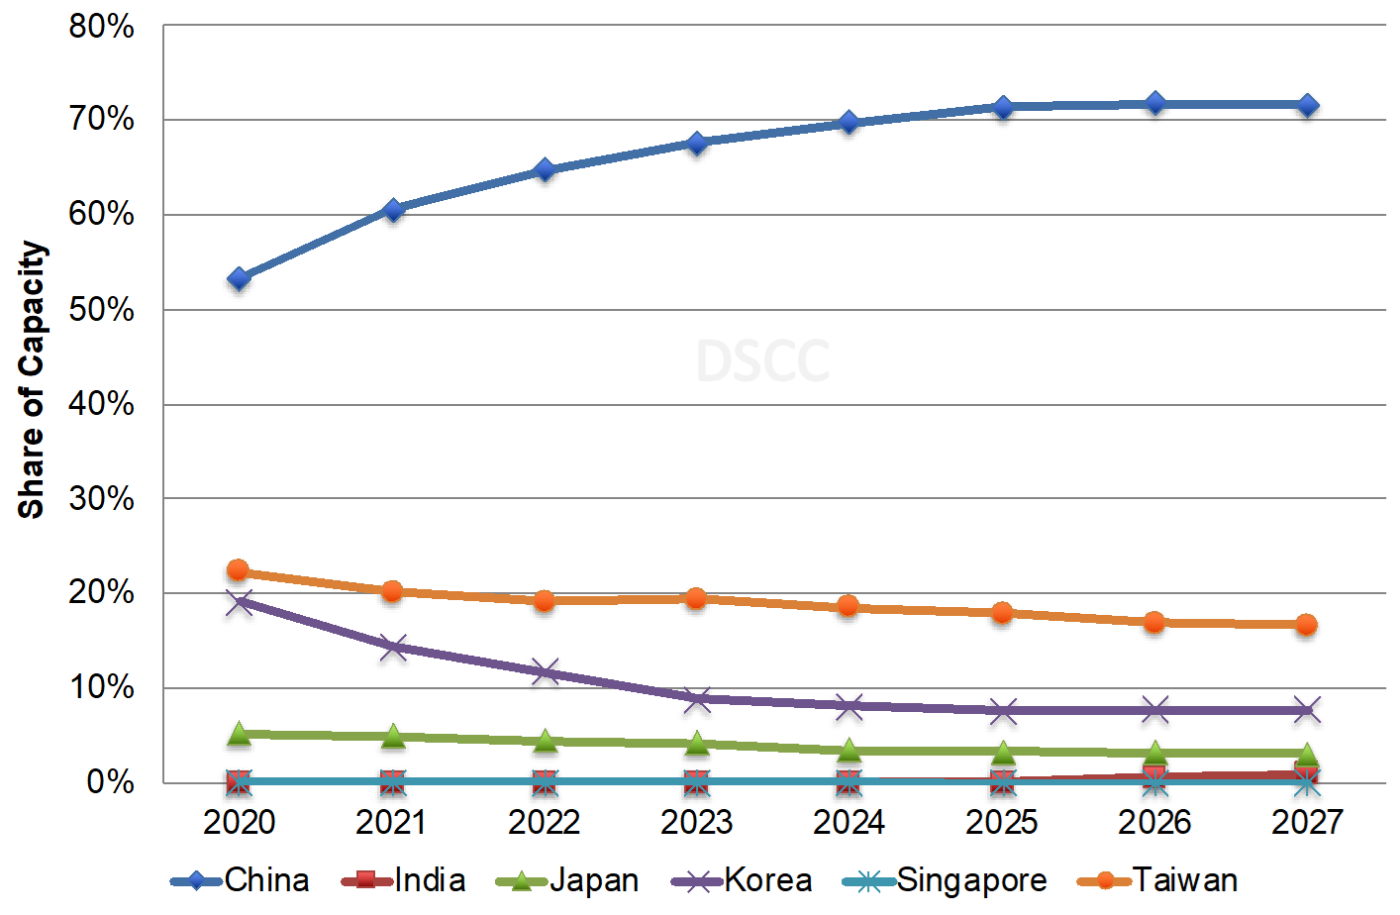
By region:
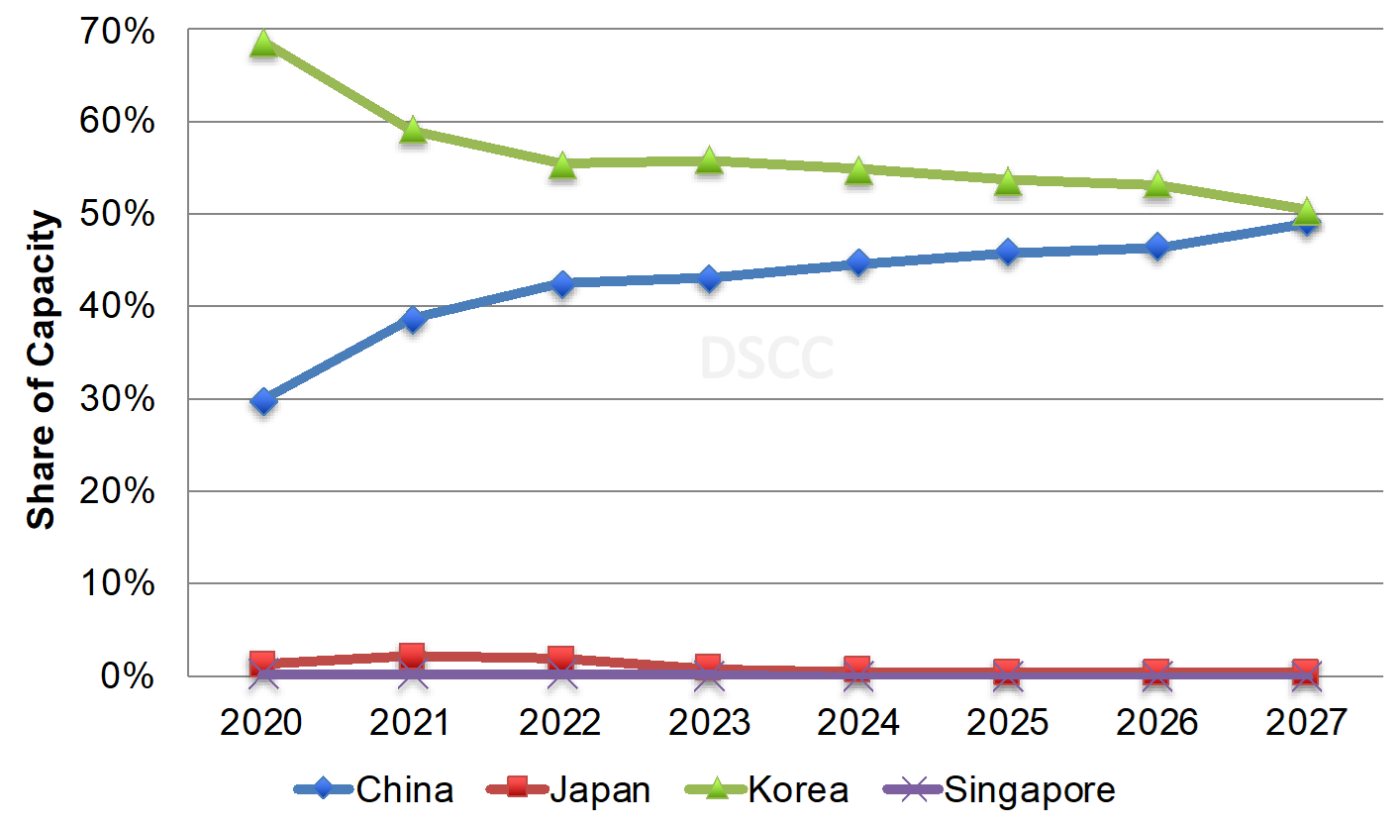
- China is still expected to dominate display capacity growing from a 65% share in 2022 to a 72% share from 2026-2027, up from 71%. Relative to last quarter, China is benefiting from the JDI and Visionox G8.7 IT OLED fabs. China’s capacity is expected to grow at a 3.4% CAGR from 2022 to 2027. China’s share is expected to be even more dominant in just LCDs. Its share is expected to rise from 67% in 2022 to 74% in 2025- 2027. It is expected to grow at a 3.1% CAGR. In OLEDs, we show China’s OLED share reaching 49% in 2027, up from 47% on the JDI and Visionox investments and rising at a 9% CAGR from 2022 to 2027.
- China is projected to have at least a 49% share in all applications/technologies by the end of the forecast period, up from 47% with a 78% share in TVs/IT.
- Korea’s share is expected to fall from 12% in 2022 to 8% in 2027, same as last quarter, on a -7% CAGR. Korea’s LCD share is expected to fall from 9% in 2022 to 3% from 2024-2027 on a -19% CAGR. Korea is expected to maintain OLED leadership through the forecast although its share is expected to fall from 55% in 2022 to 50% in 2027 on just a 4% CAGR.
- Taiwan’s capacity is expected to fall at a -1.4% CAGR from 2022 to 2027, with its share falling from 19% in 2022 to 17% in 2027.
- India is expected to invest from 2025 through Vedanta and reach a 1% share in 2027.
Regional Share of Display Capacity
Regional Share of OLED Capacity
Fab Closures/Downsizing
- We identified 10 older/smaller fabs closing from Taiwan manufacturers over the forecast, with Innolux’s Fab 1 and TPO already shifting capacity to other applications. Taiwan suppliers’ capacity is 1.3% lower than forecasted last quarter in Q4’23, 0.7% lower in Q4’24 and 1.4% lower in Q1’26.
Display Capacity by Manufacturer
- BOE is expected to maintain a large advantage in total display capacity, but its CAGR from 2022-2027 is now expected to be just 1.2% with its share steady at 25% - 26%. LGD was surpassed by China Star in 2022 for #2 and is expected to be surpassed by HKC in 2023 as it reduces its LCD capacity. Tianma is expected to have the fastest growth on TM18 and TM19 rising at a 22% CAGR to reach a 3.6% share in 2027.
Display Capacity by Manufacturer
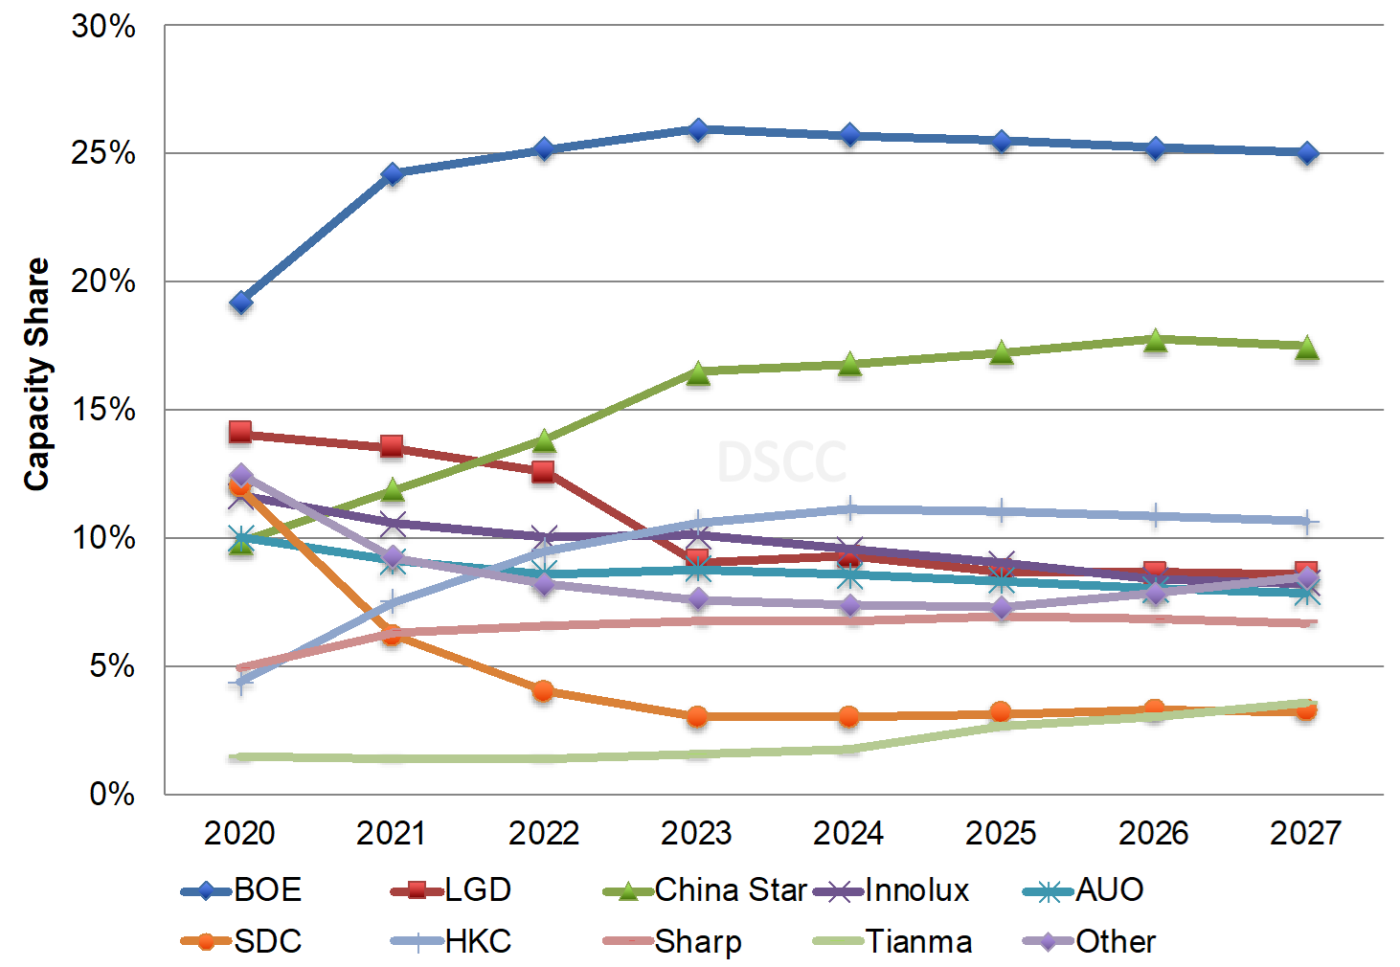
- BOE’s 2022-2027 LCD capacity is now expected to rise at just a 0.9% CAGR, with its LCD market share falling from 27% in 2022 to 26% in 2027. China Star’s LCD capacity is expected to rise at a 6.1% CAGR enabling its share to rise from 15% in 2021 to 19% from 2025-2027. HKC is now expected to reach #3 from 2023, with a 12% share on a 4% CAGR. Tianma is expected to enjoy the fastest growth rising at a 23% CAGR to reach a 3% share and the #8 position.
- While SDC led in OLED capacity in 2020, LGD started to lead from 2021 with a three-to-seven point advantage over SDC. LGD is growing at a 3.2% CAGR from 2022-2027, with SDC rising at a 4.4% CAGR. BOE is expected to remain #3 throughout the forecast with a 10%-12% share on a 10.1% CAGR. Visionox is #4 in 2022, with Tianma #5. Tianma is expected to be #4 in 2025 and 2026 with Visionox reclaiming the #4 spot in 2027. Tianma is expected to grow at a 16% CAGR with Visionox growing at a 13% CAGR.
- SDC will maintain a dominant position in Mobile OLED/IT capacity throughout the forecast due to its strong position in both rigid and flexible OLEDs, with its share hovering over 40% through 2026 and falling to 37% in 2027. It is now projected to grow at a 3.5% CAGR from 2022 to 2027 on IT OLED investments. BOE is expected to maintain the #2 position throughout the forecast with its share flattish at 17% -18% from 2022-2027 on a 10% CAGR. Its gap with SDC will fall from 30 points in 2022 to 19 points in 2027. In 2027, LGD is expected to be #3 at 11% followed Visionox at 10%, Tianma at 9% and China Star, EDO and JDI at 5%.
- We show SDC holding onto its advantage in flexible OLED capacity although its share will fall from 36% in 2022 to 32% in 2027 on a 4.6% CAGR. BOE’s share is flattish from 2022 to 2027 at around 23% - 26% on a 5.7% CAGR. LGD holds onto the #3 position through 2026, with Tianma overtaking them and holding onto that spot in 2027 with LGD falling to #4 and Visionox at #5 and China Star #6 in 2027.
Capacity is also shown by backplane technology, by substrate type, by glass size and much more. The Quarterly Display Capex and Equipment Market Share Report also reveals equipment spending by frontplane and backplane technology, equipment spending for over 70 different equipment segments, equipment supplier design wins and equipment supplier revenues and market share.
出典調査レポート Quarterly Display Capex and Equipment Market Share Report の詳細仕様・販売価格・一部実データ付き商品サンプル・WEB無料ご試読は こちらから お問い合わせください。