TV用LCD価格 (4月度分析)
[ご案内] 4/11火 TCC品川で開催!DSCC Japan セミナー 2023年前期版~底を脱し上昇に転じたFPD市場を徹底解説!
コロナ禍からの夜明けと共に、いち早く対面式セミナーを復活 (昨年10月) させたDSCC Japanセミナー、ご来場者様からの大歓迎のお声を受けて、今年から通常体制の年2回・品川会場に戻ります!今回もお客様のビジネス戦略をご支援すべく、1日でFPD産業の必聴ポイントを把握できる最新分析データをご提供!みずほ証券・中根康夫シニアアナリスト⇔当社アジア代表・田村喜男の「言いたい放題」オフレコ対談枠も、本セミナーの名物企画として再演決定!徹底的に「ご来場者様満足」にこだわるDSCC Japanセミナーならではのバリューにご期待ください!
冒頭部和訳
TV用LCD価格が、冬に一旦動きを止めた後、第1四半期を経て第2四半期に入って上昇している。第1四半期のLCD工場稼働率が極端に低かったため、TVサプライチェーン在庫は正常化され、パネル調達が回復し始めた。LCD価格の上昇はFPDメーカーの収益性改善につながるが、価格はキャッシュコストを下回っており、業界は依然として難しい立場にある。
LCD TV Panel Prices Continue to Climb in Q2
※ご参考※ 無料翻訳ツール (DeepL)
After a pause in the winter, LCD TV panel prices are increasing as Q1 ends and Q2 begins. The extremely low LCD fab utilization levels in Q1 have allowed TV supply chain inventories to normalize and panel purchases have started to recover. The higher panel prices will lead to improved profitability for panel makers, but the industry remains in a difficult position with prices below cash costs.
The first chart here highlights our latest TV panel price update to June 2023, showing the post-pandemic price plunge from mid-2021 to summer 2022. Prices hit their all-time lows in September 2022 and increased modestly in October and November. After a two-month pause, prices increased again in February and March 2023, and we expect the price increases to accelerate in Q2’23.
Because of a V-shaped pattern of prices in Q3 and Q4, the average price was close to flat on a Q/Q basis for Q4’22, increasing an average of only 0.1%, even though December prices were 3% higher than September prices. Panel makers are seeing a true Q/Q benefit in Q1’23, with average prices now estimated to be up 2.9% Q/Q. With prices continuing to increase in the second quarter, we now forecast that average prices in Q2 will be up by a robust 13%.
LCD TV Panel Prices
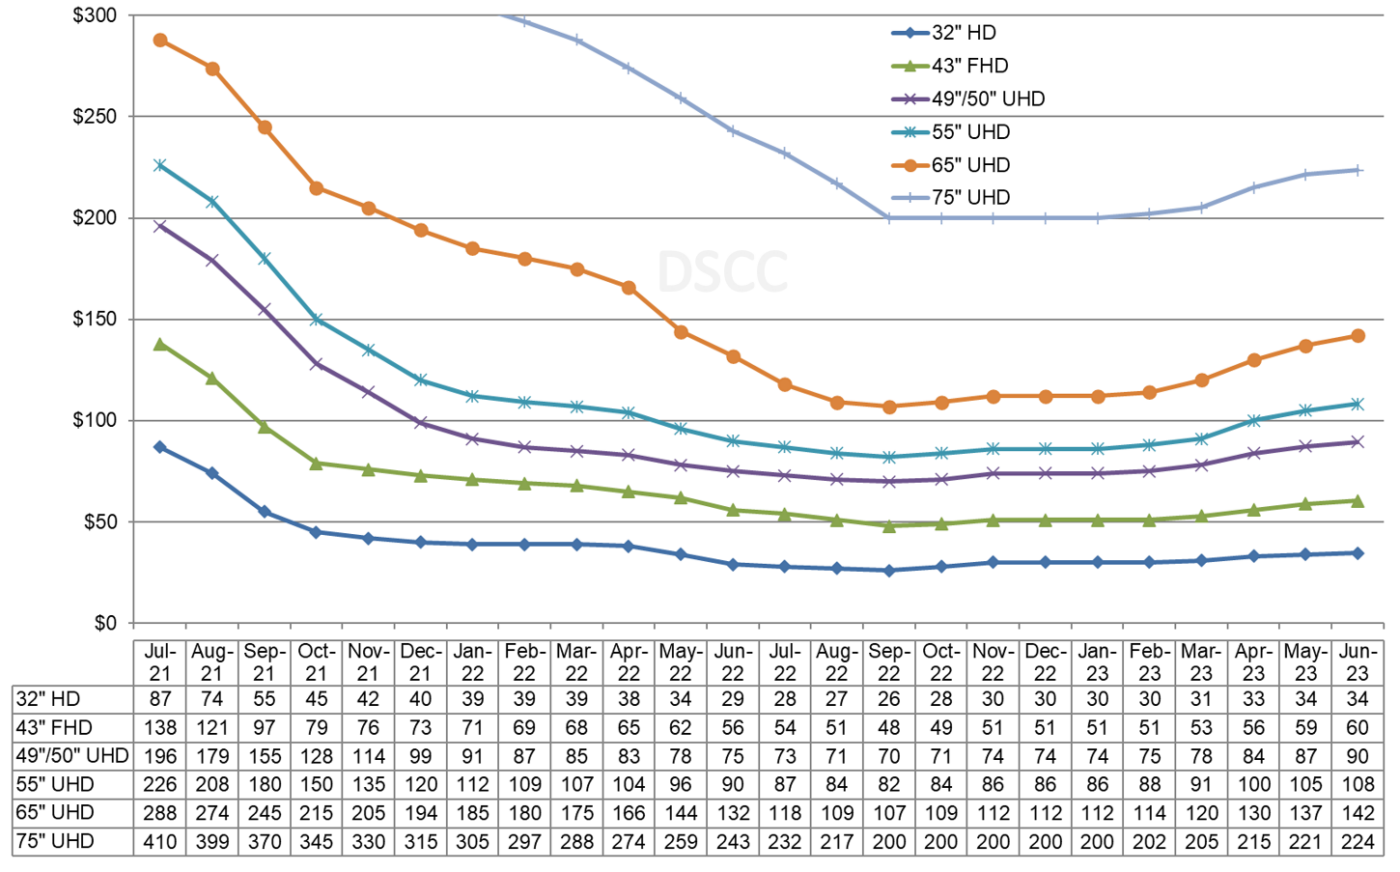
Prices for all sizes of LCD TV panels increased in March, with the M/M increase ranging from 1.5% on 75” panels to 5.3% on 65” panels. We are expecting the price rally to continue to be broad-based across all screen sizes in Q2, with Q/Q price increases ranging from 8.8% to 18.2%.
The pattern of prices mimics a similar pattern in fab utilization. Although the utilization pattern varied for individual companies, total TFT LCD fab utilization hit bottom in September 2022 with fabs running at only 61% of capacity. UT% increased modestly in October and November and then paused in December resumed its increase in Q1’23. We estimate that fab UT% will exceed 80% in April with Gen 10.5 lines approaching 90%.
Our sources indicate that China TV brands are trying to get more panels for the 6/18 shopping event and that Samsung VD will increase panel purchasing in April to build inventory ahead of panel price increases. However, the supply/demand situation is a delicate balance, and panel makers risk raising UT% too high and building excess inventory, which would cause the price rally to stall. We do not forecast that prices will continue to increase in Q3’23.
As we look at pricing on an area basis, we continue to see a narrowing of the range of prices. The larger screen sizes up to 85” long enjoyed a significant price premium over smaller sizes, but the price premium for 65” was eliminated in Q2’22 and for the past year the price premium for 75” panels and for 85” panels has been rapidly eroded. The area premium for 75” and 85” will continue in Q2’23 but at a lower level than historically as the prices for smaller sizes increase at a faster rate.
Monthly Area Prices per Square Meter for TV Panels
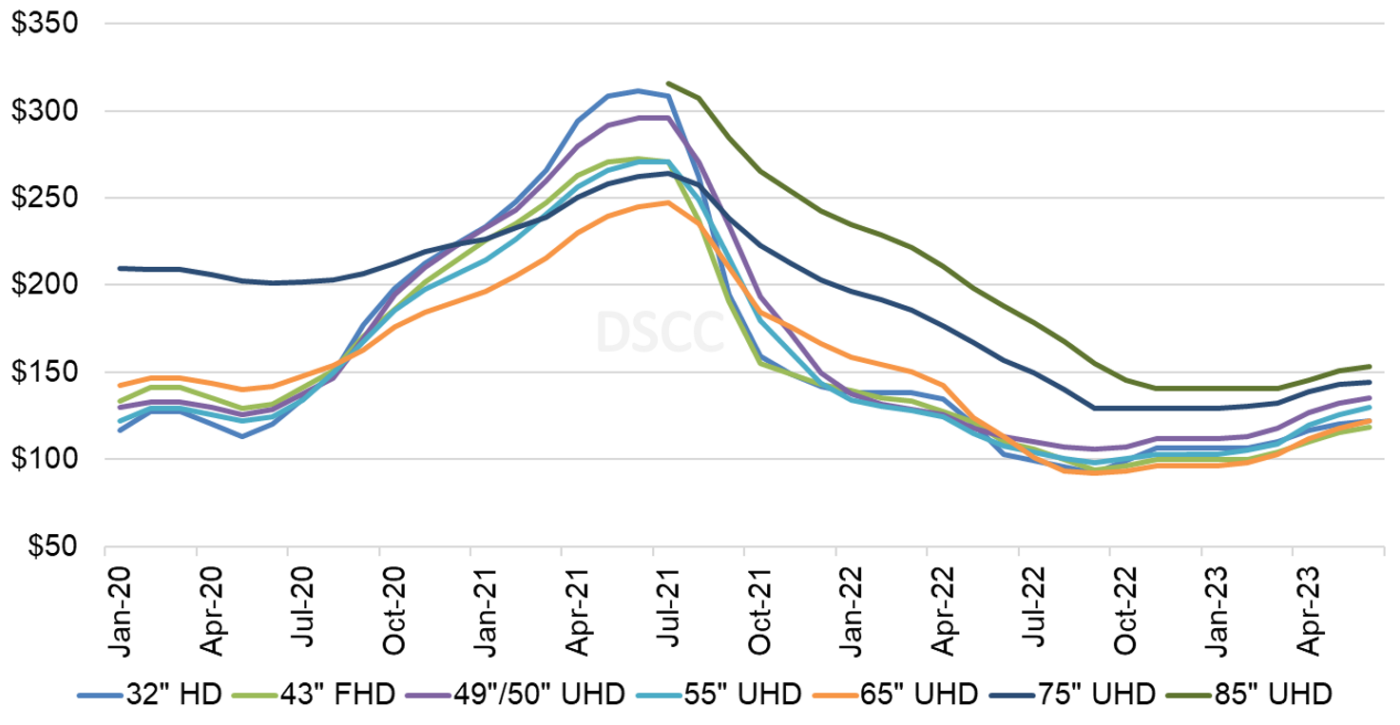
In June 2022, a 75” panel was priced at $144 per square meter, a $41 or 40% premium over the 32” area price. In September 2022, when the market hit bottom, the 75” premium over 32” had dropped to $37 but was still the same in percentage terms at 40%. By March 2023, the 32” price had increased faster than the 75” price, reducing the premium to $22 per square meter or 20%. We expect the $22 gap between 32” and 75” area prices to be stable in Q2’23.
For a period of about nine months, the 65” panel has had the lowest area price of any screen size, but that size which is efficiently made 8-up on Gen 10.5 fabs, is seeing the biggest price increases in the first half of 2023. By June, we expect that 65” prices will catch up with 32” prices, still at the lower end of the range.
The lower panel prices and soft demand led to operating losses for panel makers relying on LCD production in Q3’22 and Q4’22. The average operating margin across the flat panel display industry in Q3, excluding SDC, was a 13% loss. We still await the results of the big Chinese panel makers for Q4’22, but the results are likely to be similar. The price increases in Q1’23 along with higher fab utilization is likely to allow for a modest improvement in panel maker operating margins in the first quarter, and the price increases and higher utilization in Q2 may allow some panel makers to reach positive operating margins.
Our final chart in this sequence shows our LCD TV panel price index, taking a longer view from 2015 through June 2023. The price increases in March 2023 have brought our index up to 34, compared to the low of 30.5 in September 2022. We expect the price index to cross into positive territory in June 2023 on a Y/Y basis for the first time since September 2021, reaching 39, 27% higher than the all-time low.
LCD TV Panel Price Index
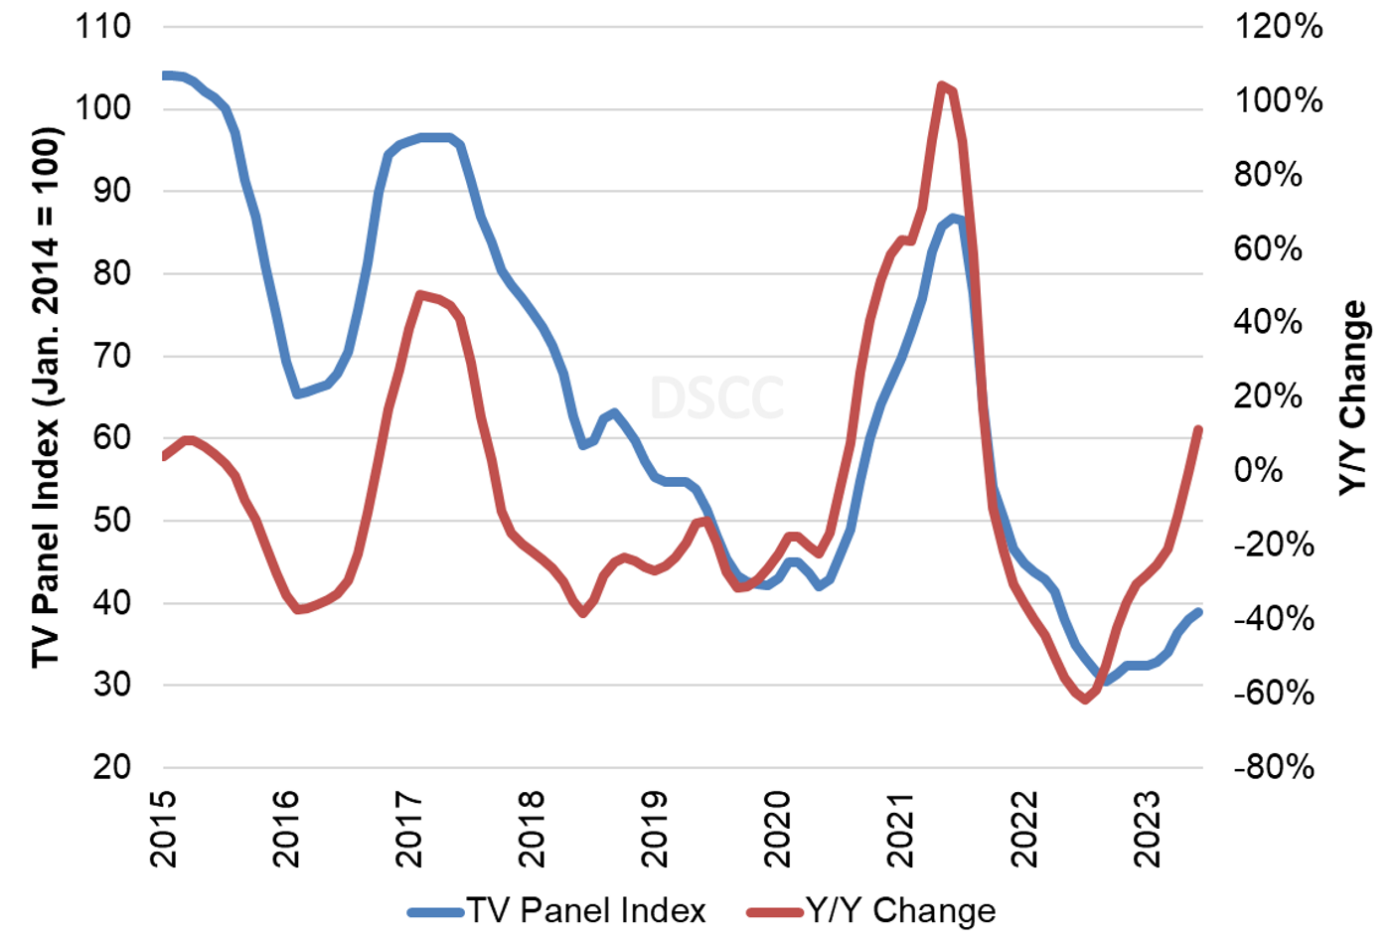
Although panel prices are clearly showing a rally, the industry’s capacity still far outstrips the likely demand for the foreseeable future. The modest rally in the first half of 2023 may allow panel makers to break even, but LCD makers will need to restrain their enthusiasm and not overbuild or excess inventory will kill the rally.
