FPD供給能力の最新動向~地域別/用途別/技術別/メーカー別の分析ハイライト
冒頭部和訳
[冒頭部和訳] DSCCではかつて、LCD市況の改善に合わせて、レポート発行毎に6回連続でFPD供給能力予測を引き上げた。しかしその後に状況は悪化し、低迷が続く市況下で設備投資の延期と中止が発生していることから、今回のレポートでは4四半期連続のFPD供給能力予測の引き下げとなった。例えばTV用LCDの価格は最近になって限界費用レベルに達しており、価格がキャッシュコストを上回るには2023年下半期までかかると予測している。
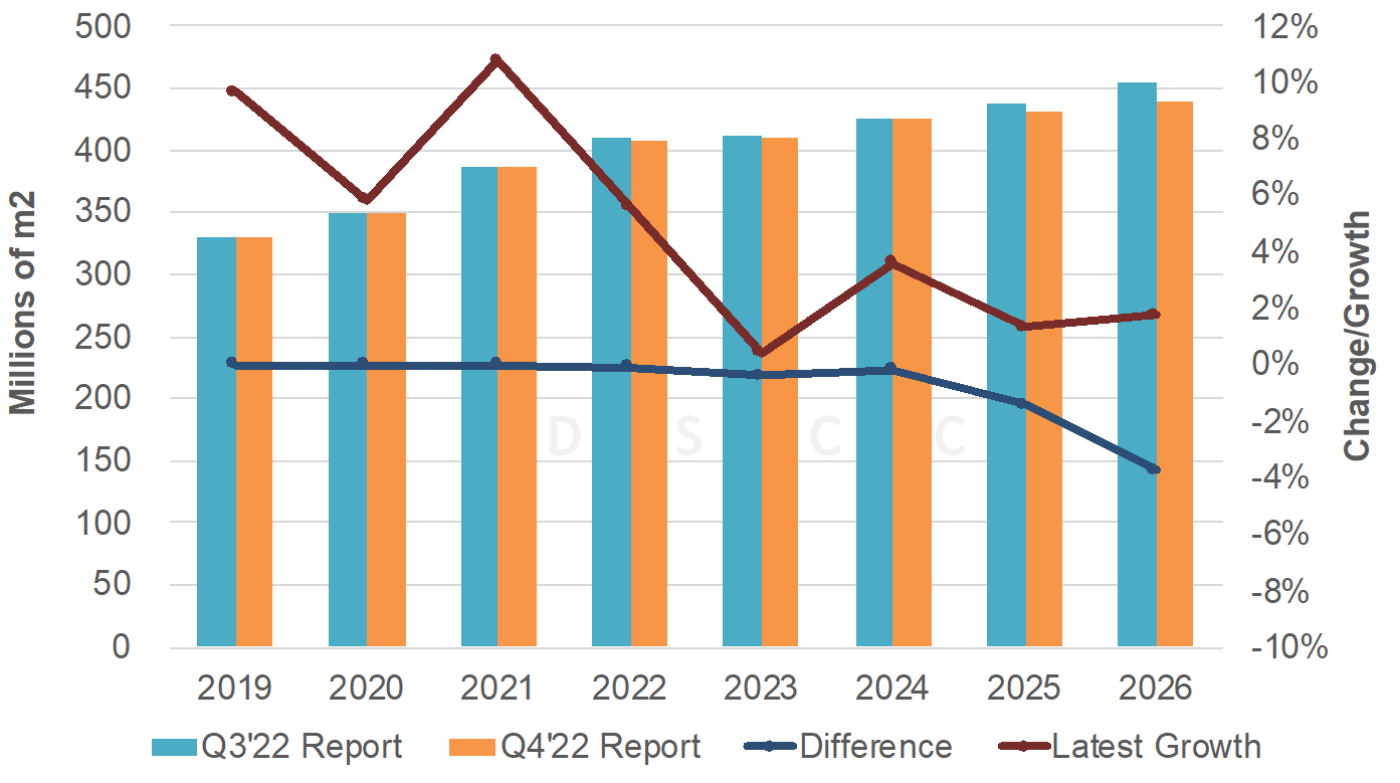
Quarterly Display Capex and Equipment Market Share Report (一部実データ付きサンプルをお送りします) の最新号に示す通り、2021年から2026年にかけてのFPD供給能力の年平均成長率は3.3%から2.5%に引き下げられた。生産ライン建設の中止と延期により、供給能力予測はOLED、LCDともに引き下げとなった。最新予測による2026年の能力は以前の予測と比較して4%低く、ピークレベルと比較すれば12%も低くなっている。
2021-2026年の供給能力の年平均成長率は、LCDは2.5%から1.8%に引き下げ、OLEDは11.2%から9.5%に引き下げとなっている。
最新のレポートおよびピボットテーブルでは、供給能力の予測期間が2027年まで延長となっているほか、IT用OLEDラインの増加で予想されるリジッド+TFE 基板の供給能力を異なるセグメントとして区別している。
DSCC Downgrades Display Capacity Growth
After upgrading display capacity for six straight issues on improved market conditions in LCDs, DSCC has now lowered its display capacity forecast for four consecutive quarters on delays and cancellations as conditions worsen and remain weak. Prices were recently at marginal costs for LCD TV panels and it is projected that it will take until 2H’23 for prices to rise above cash costs.
As indicated in our latest Quarterly Display Capex and Equipment Market Share Report (一部実データ付きサンプルをお送りします), our 2021-2026 display capacity CAGR was downgraded from 3.3% to 2.5%. Both OLED and LCD capacity forecasts came down on fab cancellations and delays. Our latest capacity forecast for 2026 is down 4% vs. our previous forecast and is down 12% vs. peak levels.
We lowered our LCD 2021-2026 CAGR from 2.5% to 1.8% with OLEDs reduced from 11.2% to 9.5%.
The latest report and pivot tables extend the capacity forecast out to 2027 and now includes distinct segmentation for rigid + TFE substrates capacity, which are expected in a growing number of IT OLED fabs.
DSCC’s Latest Display Capacity Forecast, Growth and Change
Other highlights include:
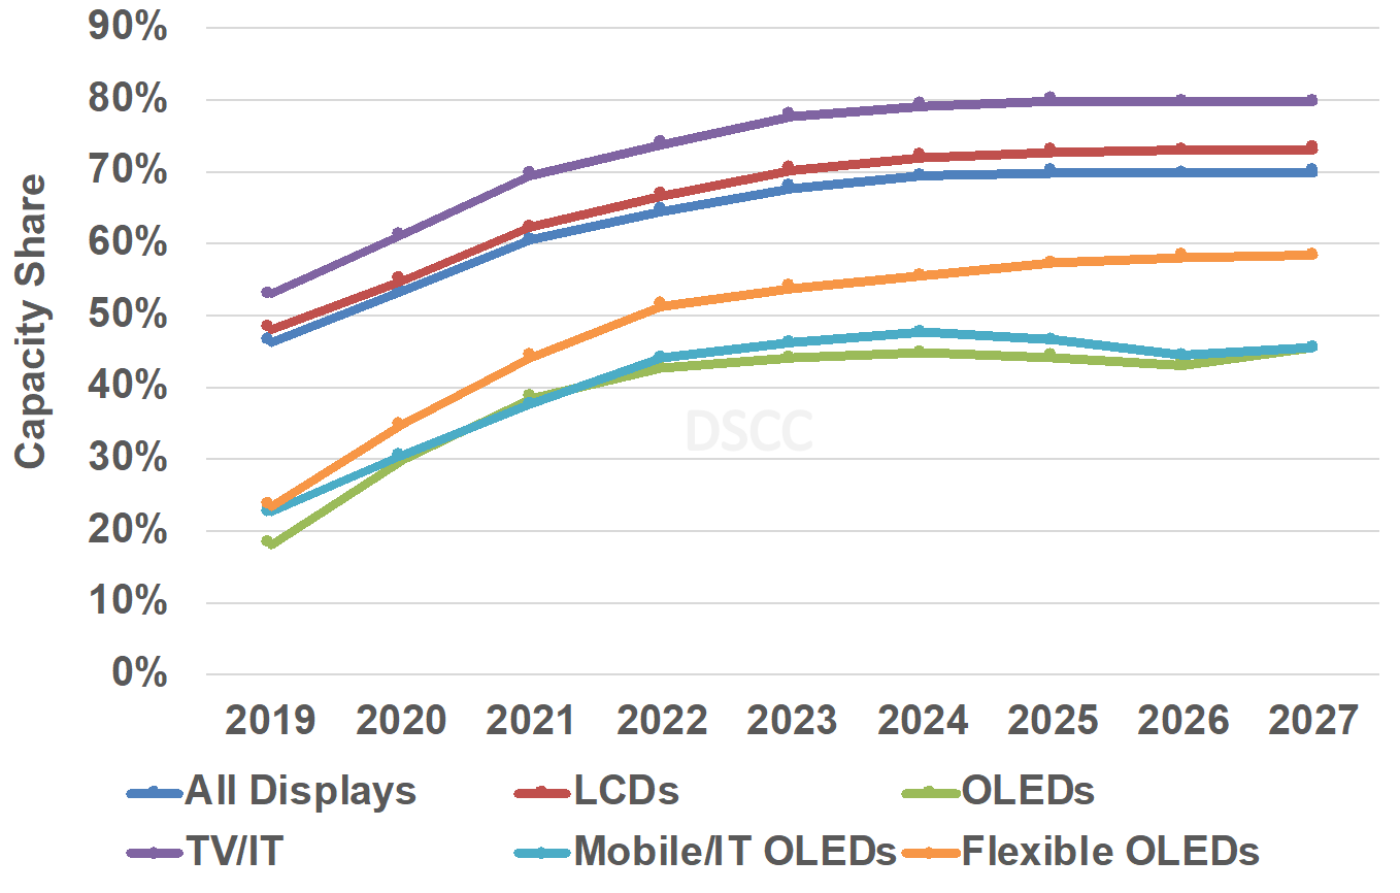
- LCD TV/IT will continue to dominate the forecast with at least a 71% share through 2027 followed by LCD Mobile/IT with at least a 17% share. OLED Mobile/IT will rise from a 5% share to a 7% share in 2026, with OLED TV/IT rising from a 3% to a 5% share.
- OLED TV/IT is expected to enjoy the fastest growth from 2021-2027 at an 11% CAGR followed by OLED Mobile/IT at 8% with LCD TV/IT at 2% and LCD Mobile/IT at a 0.4% CAGR.
- China is expected to dominate display capacity, growing from a 61% share in 2021 to a 70% from 2024-2027, down from 71% on the cancellation of B17+. China’s capacity is expected to grow at a 5% CAGR, down from 7%.
- Korea’s share is expected to fall from 14% in 2021 to 9% in 2027, same as last quarter, on a -6% CAGR, improved from -7% last quarter.
- China is projected to have at least a 46% share, up from 45%, in all applications/technologies by the end of the forecast period with an 80% share in TVs. Over-reliance on China is already a significant concern given all the supply chain disruptions we saw in China in 2021 and 2022. Will any other regions emerge? Doesn’t look like it yet.
- G7+ capacity for LCDs and OLEDs is now expected to rise at a 2.6% CAGR from 2021 – 2027, down from 3.7%% last quarter covering 2021-2026. After double-digit growth in 2021, 2022 capacity growth will slow to 7% followed by no growth in 2023 on fab delays and closures on weak market conditions. 5% growth is expected in 2024 followed by 1% - 2% growth from 2025-2027.
- Rigid + TFE substrates are expected to reach an 8% share of OLED capacity and a 15% share of mobile/IT OLED capacity in 2027.
- By backplane technology:
- a-Si is expected to decline from an 84% share of backplane capacity in 2021 to 80% in 2027 on greater demand for advanced TV and IT display technologies and increased penetration by mobile/IT OLEDs. a-Si capacity is now expected to rise at just a 1.6% CAGR from 2021 to 2026, down from 2.5%.
- Metal oxide is expected to rise from 8% in 2020 to 10% in 2027 on the growth in OLED TV, IT OLED and IT LCD capacity from both new fabs and conversions, rising at a 7% CAGR from 2021 to 2027, down from 8% last quarter, and overtaking LTPS capacity in 2022. Metal oxide will become the #1 backplane in OLED capacity from 2025.
- In terms of manufacturer leadership:
- Total Display Capacity
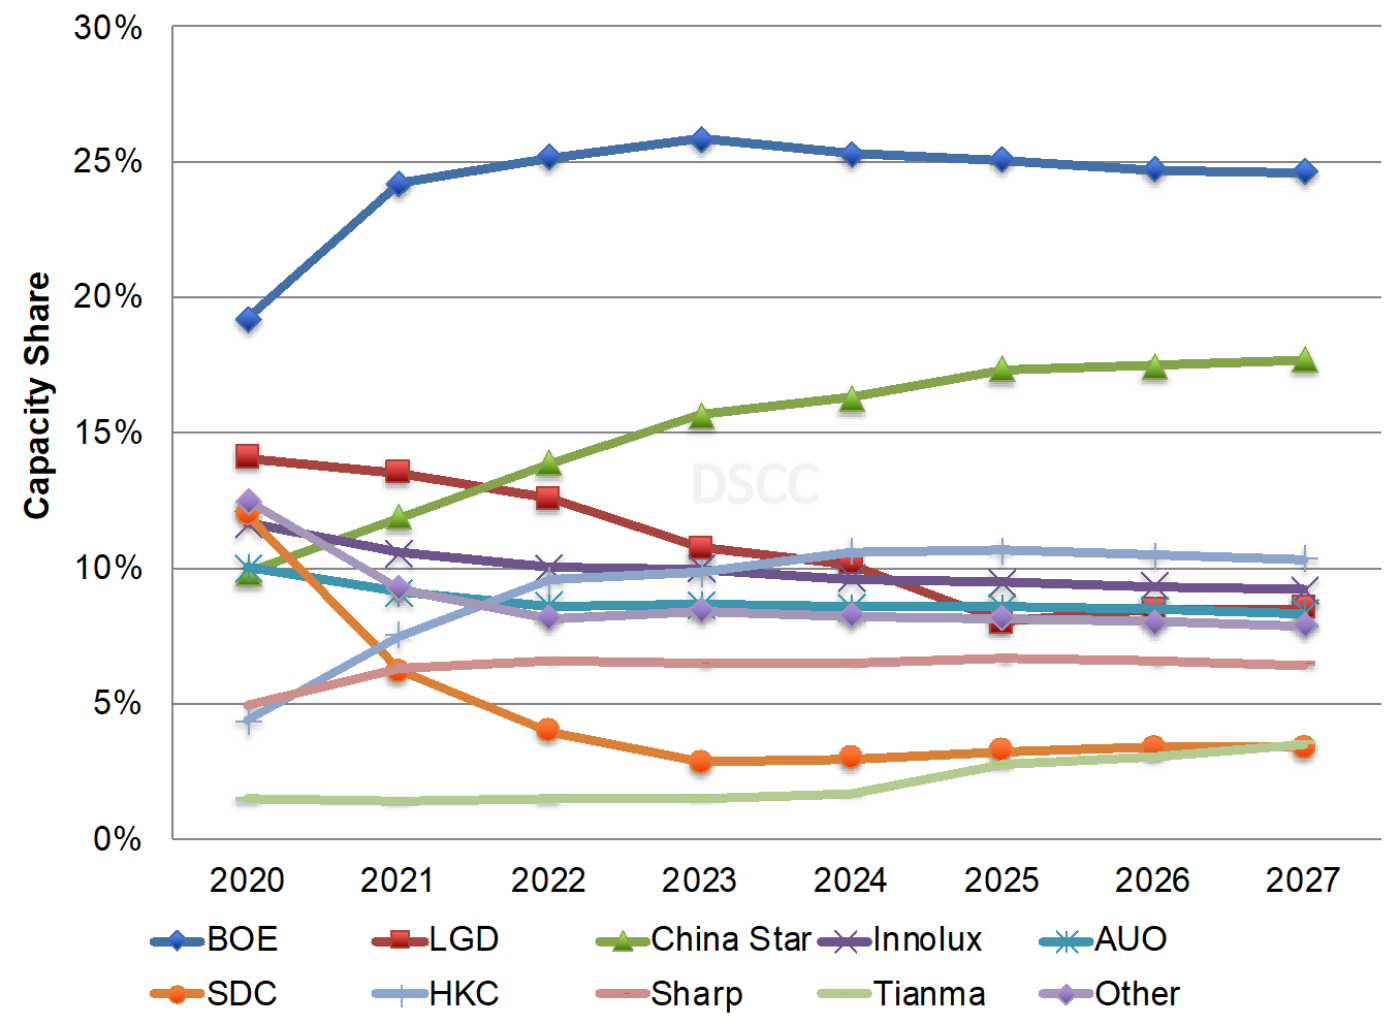
- BOE is expected to maintain a large advantage, but its CAGR from 2021-2027 is now expected to be just 3%. Its 2022-2027 capacity share will be 27% vs. China Star at 19%.
- Display Capacity
- BOE’s 2021-2027 LCD capacity is now expected to rise at a 2.4% CAGR, down from 5% on the cancellation of B17+, with its LCD market share rising from 21% in 2021 to 27% from 2024-2027, down from 29%. China Star’s LCD capacity is expected to rise at an 8.5% CAGR enabling its share to rise from 13% in 2021 to 19% from 2025-2027. HKC is now expected to reach #3 from 2024.
- OLED Capacity
- While SDC led in OLED capacity in 2020, LGD is expected to lead from 2021 with a four-to-eight-point advantage. LGD is growing at a 7% 2021-2027 CAGR with SDC rising at a 6% CAGR. BOE is expected to remain #3 throughout the forecast with a 10%-12% share on a 9% CAGR.
- Mobile/IT OLED Capacity
- SDC will maintain a dominant position throughout the forecast, with its share not falling below 41% throughout due to its strong position in both rigid and flexible OLEDs. BOE is expected to maintain the #2 position throughout the forecast with its share flattish at 16% - 19% from 2021-2027. In 2027, LGD is expected to be #3 followed by Tianma, Visionox, EDO and China Star.
- Flexible OLED Capacity
- We show SDC holding onto its advantage although its share will fall from 40% in 2021 to 29% in 2027 on just a 1% CAGR. BOE’s share is flattish from 2021 to 2027 at a 7% CAGR. LGD holds on to the #3 position through 2024 with Tianma rising to #3 from 2025 with LGD at #4, Visionox at #5 and China Star #6.
- Total Display Capacity
Display Capacity by Manufacturer
China’s Share of Display by Technology and Application
For more information on display capacity and/or DSCC’s Quarterly Display Capex and Equipment Market Share Report (一部実データ付きサンプルをお送りします), please contact info@displaysupplychain.co.jp.
本記事の出典調査レポート
Quarterly Display Capex and Equipment Market Report
一部実データ付きサンプルをご返送
ご案内手順
1) まずは「お問い合わせフォーム」経由のご連絡にて、ご紹介資料、国内販売価格、一部実データ付きサンプルをご返信します。2) その後、DSCCアジア代表・田村喜男アナリストによる「本レポートの強み~DSCC独自の分析手法とは」のご説明 (お電話またはWEB面談) の上、お客様のミッションやお悩みをお聞かせください。本レポートを主候補に、課題解決に向けた最適サービスをご提案させていただきます。 3) ご購入後も、掲載内容に関するご質問を国内お客様サポート窓口が承り、質疑応答ミーティングを通じた国内外アナリスト/コンサルタントとの積極的な交流をお手伝いします。