Q3’22のOLED出荷金額は前年比11%減~スマホ用16%減とTV用12%減の影響
冒頭部和訳
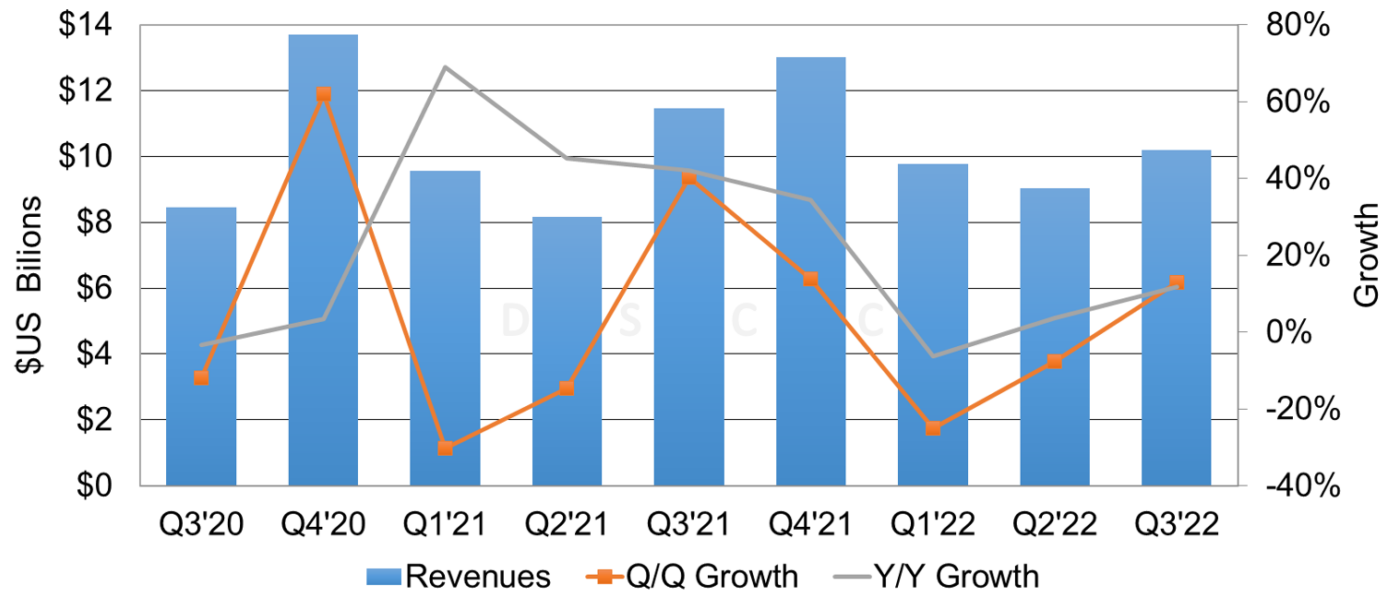
DSCCが Quarterly OLED Shipment Report (一部実データ付きサンプルをお送りします) 最新刊の「速報版」を発行した。Q3’22におけるOLEDの出荷枚数は前年比17%減となり、その結果、出荷金額は前年比11%減となっている。合計シェアが数量ベースで全体の70%、金額ベースで85%を占めるスマートフォン、タブレット、TVの3用途が減少傾向の一方、他のカテゴリーでは出荷枚数が前年比ベースで増加している。
OLED用途別の出荷状況は以下の通り。
• スマートフォン用の出荷枚数は前年比26%減、出荷金額は前年比16%減
• スマートウォッチ用の出荷枚数は前年比11%増、出荷金額は前年比37%増
• TV用の出荷枚数は前年比4%減、出荷金額は前年比12%減
• モニター用の出荷枚数は前年比222%増、出荷金額は前年比66%増
• ノートPC用の出荷枚数は前年比9%増、出荷金額は前年比2%減
• タブレット用の出荷枚数は前年比21%減、出荷金額は前年比36%減
• 車載用の出荷枚数は前年比152%増、出荷金額は前年比119%増
• ゲーム端末用の出荷枚数は前年比7%増、出荷金額は前年比2%増
OLED Panel Revenues Decreased 11% Y/Y in Q3’22 as Smartphones and TVs Drop 16% and 12%
As revealed in DSCC’s latest release of Quarterly OLED Shipment Report (一部実データ付きサンプルをお送りします) - Flash Edition, OLED panel revenues decreased 11% Y/Y on a 17% Y/Y decline in panel shipments. Smartphones, tablets and TVs, which have a combined 70% unit share and 85% panel revenue share, decline while other categories had Y/Y unit growth.
By OLED application:
- Smartphones decreased 26% Y/Y in units and 16% Y/Y in panel revenues;
- Smartwatches increased 11% Y/Y in units and increased 37% in revenues;
- TVs decreased 4% Y/Y in units and 12% in revenues;
- Monitors increased 222% Y/Y in units and increased 66% in revenues;
- Notebook PCs increased 9% Y/Y in units and decreased 2% in revenues;
- Tablets decreased 21% Y/Y in units and decreased 36% in revenues;
- Automotive increased 152% Y/Y in units and increased 119% in revenues;
- Game platforms increased 7% Y/Y in units and increased 2% in revenues.
AMOLED Panel Revenue and Y/Y Growth
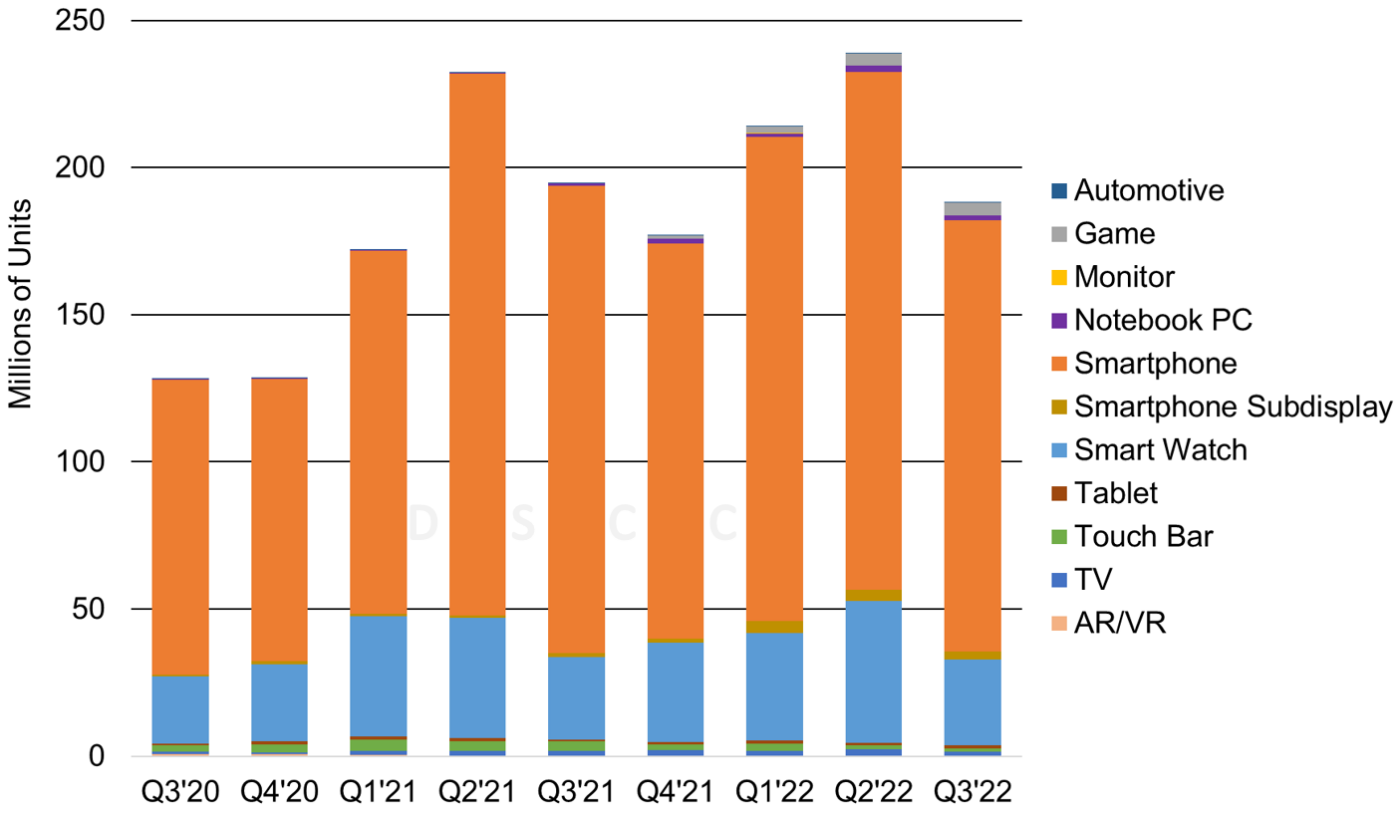
In Q3’22, smartphones remained the largest OLED application with a 68% unit and 75% panel revenue share, down from 77% and 76% respectively in Q2’22. OLED smartwatches had a 23% unit share and 9% revenue share, up from 15% and 6% respectively in Q2’22. OLED TVs had a 1% unit share and a 9% revenue share (revenue share was 11% in Q2’22). All other applications remained with single digit panel revenue share.
For OLED applications that had Y/Y unit and panel revenue growth, several brands launched new products in Q3’22 that helped lift those categories. For OLED monitors, Asus launched the 27” Model PA27DCE and LG launched a new 27” and their 42” OLED Flex LX3 model. For OLED notebook PCs, Asus launched the 16” Swift Edge and Zenbook Flip 13 as well as Xiaomi launching their 14” and 16” Book Pro models. In addition to the new products, blended panel ASPs were higher in Q3’22 for smartphones and smartwatches, the higher ASPs were driven by form factor mix changes and the launch of the Apple iPhone 14 series and new smartwatches.
AMOLED Panel Shipments by Application
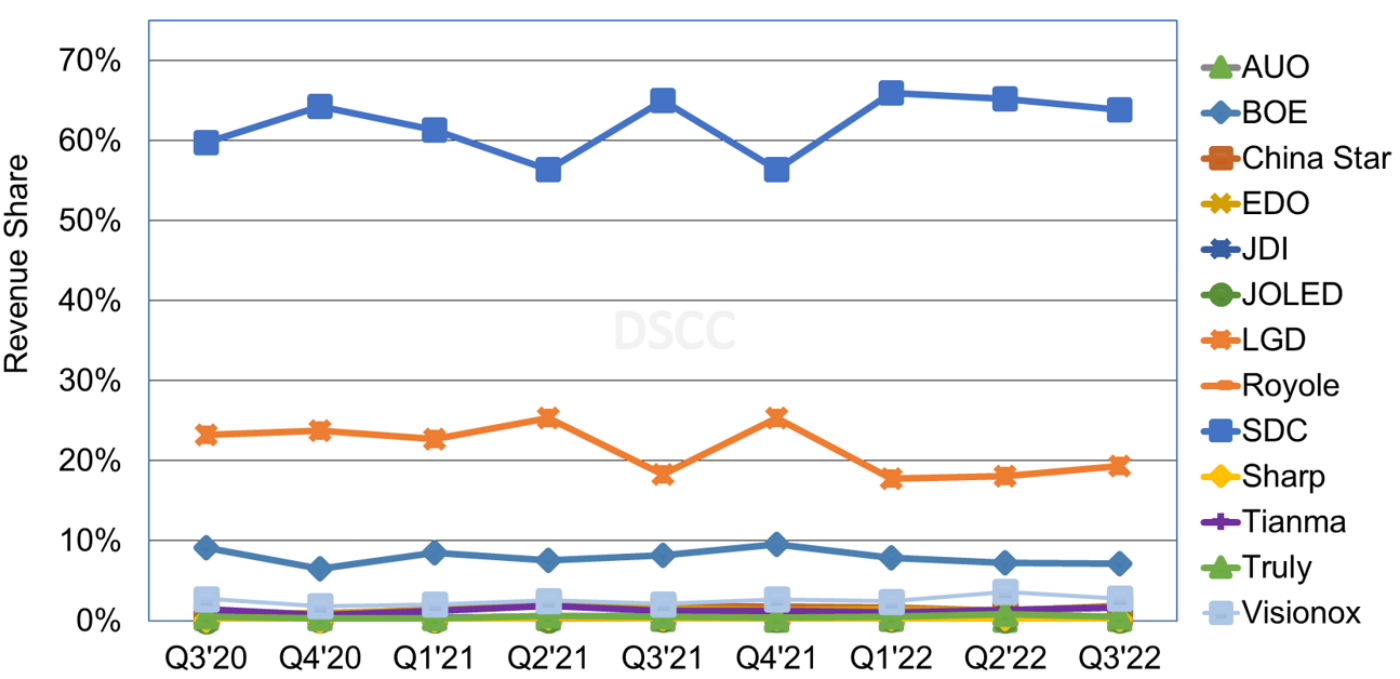
In Q3’22 panel revenues, SDC accounted for a 64% revenue share, down from 65% in Q2’22, followed by LGD with 19%, up from 18% in Q2’22 and BOE with 7%, similar to Q2’22. For SDC, although OLED smartphone units were down 17% Q/Q, SDC had significant Q/Q unit growth from the iPhone 14 models. SDC is the only panel supplier that is providing panels for all four iPhone 14 models. Its QD-OLED volumes were up 11% Q/Q, but are expected to be well short of 1M units for the year. For LGD, OLED smartphones units were up 15% Q/Q as a result of a 512% Q/Q increase for the iPhone 14 and a 47% Q/Q increase for the iPhone 13 Mini. Its OLED TV volumes were down 4% Q/Q. For BOE, OLED smartphones were up 5% Q/Q as a result of a 102% Q/Q increase for the iPhone 14.
AMOLED Panel Revenue by Panel Supplier
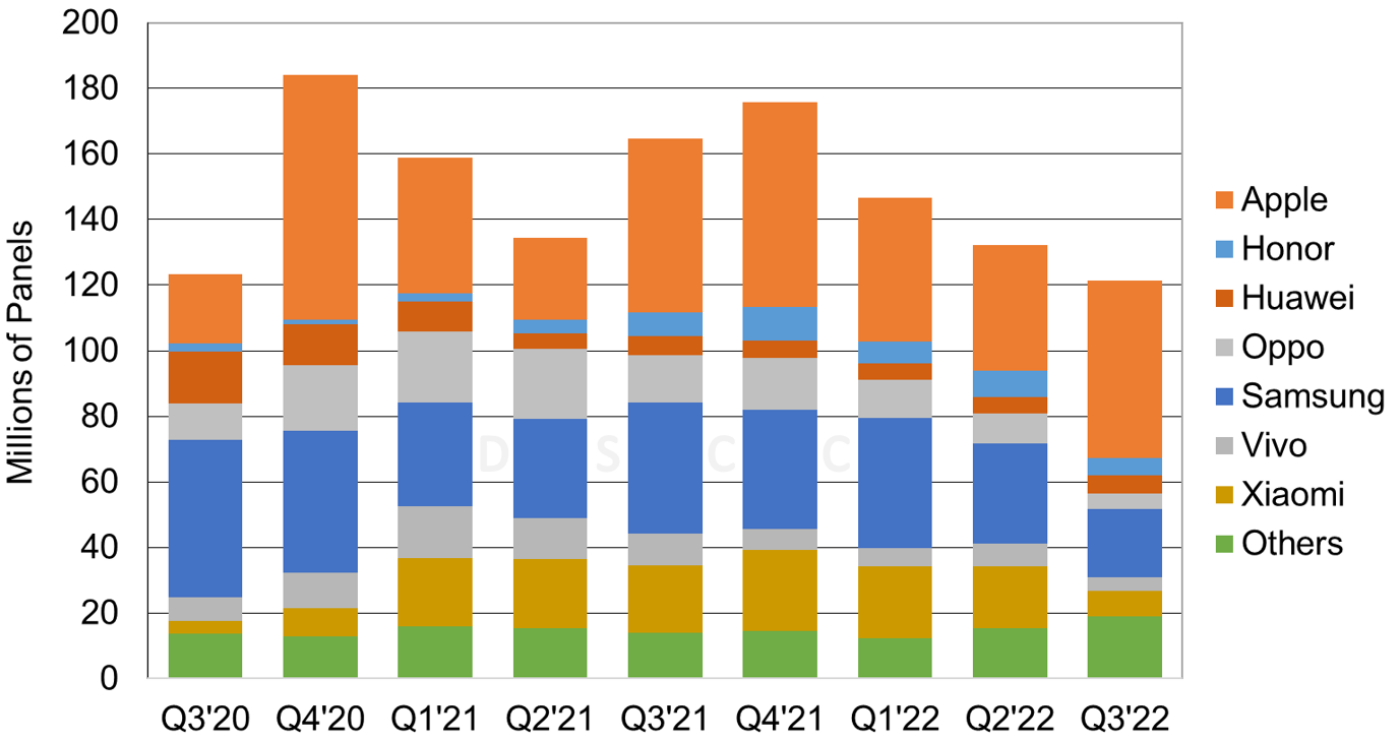
In Q3’22, for OLED smartphone panel procurement by brand, Apple’s share increased to 45% from 29% in Q2’22 on 41% Q/Q unit growth and significant growth for the iPhone 14 series, followed by Samsung with a 17% unit share, down from 23% in Q2’22. In Q3’22, rigid OLED smartphones were down 41% Q/Q, flexible OLED smartphones were up 9% Q/Q and foldable OLED smartphones were up 103% Q/Q.
AMOLED Smartphone Panel Shipments by Brand
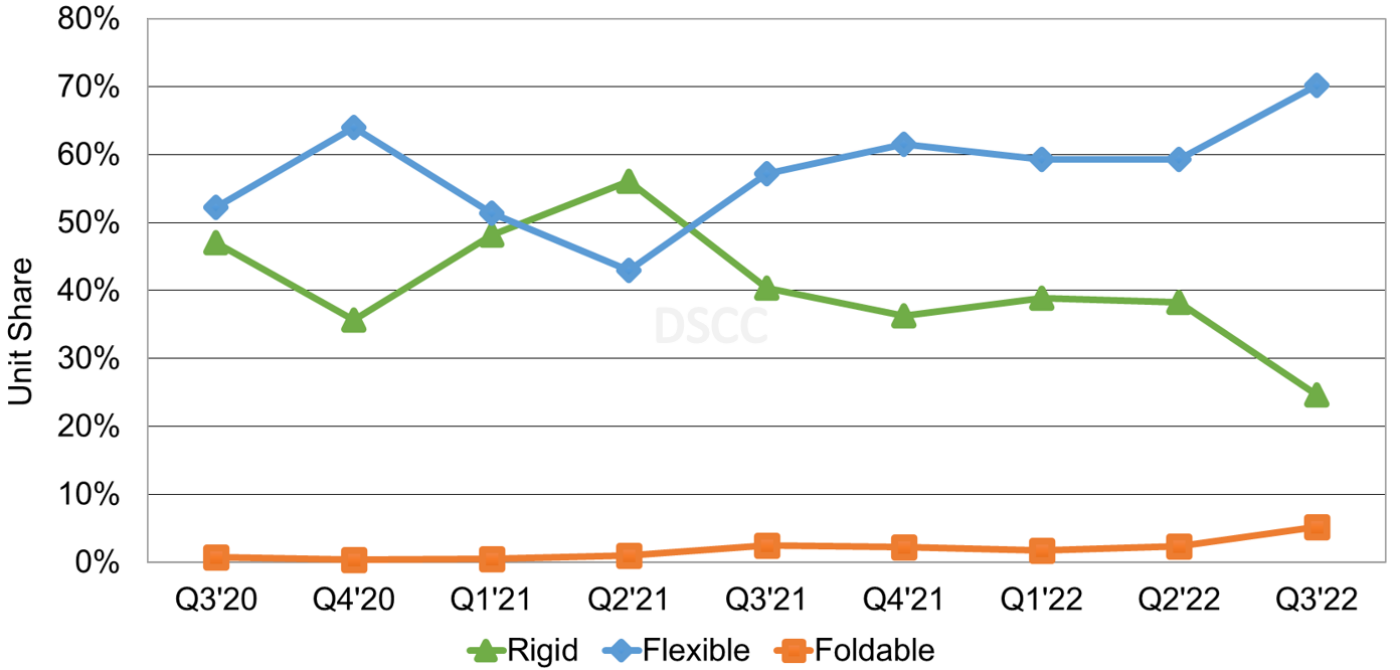
In Q3’22, the smartphone form factor mix was 25% rigid (versus 40% in Q3’21), 70% flexible (versus 57% in Q3’21) and 5% foldable (versus 2% in Q3’21). Although flexible smartphone OLED panels captured more share, Apple was the only brand that increased flexible smartphone OLED panel shipments while other brands had Y/Y double-digit declines.
AMOLED Smartphone Panel Shipments by Form Factor
DSCC’s long-term forecast for OLED units, revenues, area, panel supplier share, brand share, etc. will be available next month. For more information, please contact info@displaysupplychain.co.jp.
本記事の出典調査レポート
Quarterly OLED Shipment Report
一部実データ付きサンプルをご返送
ご案内手順
1) まずは「お問い合わせフォーム」経由のご連絡にて、ご紹介資料、国内販売価格、一部実データ付きサンプルをご返信します。2) その後、DSCCアジア代表・田村喜男アナリストによる「本レポートの強み~DSCC独自の分析手法とは」のご説明 (お電話またはWEB面談) の上、お客様のミッションやお悩みをお聞かせください。本レポートを主候補に、課題解決に向けた最適サービスをご提案させていただきます。 3) ご購入後も、掲載内容に関するご質問を国内お客様サポート窓口が承り、質疑応答ミーティングを通じた国内外アナリスト/コンサルタントとの積極的な交流をお手伝いします。