Q3'22のFPDメーカー業績比較~LCDとOLEDの大きなギャップが浮き彫りに
冒頭部和訳
FPDメーカー全社のQ3’22決算発表が完了したことを受け、DSCCではFPD業界プロフィールを更新した。Q3’22には、OLEDに重点を置くメーカー、特にSamsung Displayと、LCDに重点を置くメーカーとの間に大きなギャップが見られた。LCDメーカーにとってはここ数年間で最悪の四半期であり、おそらく史上最悪の四半期だったと言える。一方、Samsung DisplayはLCD生産中止後の最初の四半期に過去最高の利益を記録した。
DSCCの Quarterly Display Supply Chain Financial Health Report (一部実データ付きサンプルをお送りします) は上場FPDメーカー13社を対象とした、企業の財務情報開示に基づくレポートである。米国および国際会計基準では四半期報告書に損益計算書、貸借対照表、キャッシュフロー計算書を含めるよう求められるが、中国の会計基準ではキャッシュフロー計算書は必要ではなく、事業セグメント別の業績も求められない。DSCCの分析では、Q3’22のEBITDAを計算するにあたってQ2’22の水準をベースに減価償却費を推定した。
1つ目のグラフはFPDメーカーの四半期別収益 (Revenues) を示している。総収益は前期比1%増・前年比28%減の268 億ドルとなり、過去最高だったQ4’21の382億ドルから30%減少している。FPD総収益が前期比で微増となっているため、LCD重視のメーカーとOLED重視のメーカーとの間の大きなギャップが見えづらくなっている。Samsung Displayの収益は前期比15%増、LGDの収益は前期比14%増だったが、これは両社ともiPhone 14の発売によるスマートフォン用OLED需要急拡大の恩恵を享受したためである。これら韓国系2社を除くと、収益は前期比7%減・前年比37%減となる。
Q3’22 Flat Panel Display Financials Highlight Wide Gap Between LCD and OLED
Now that all of the industry’s flat panel display makers have reported their Q3’22 financial results, we update our industry profile. The third quarter showed a gaping chasm between OLED-focused display makers, especially Samsung Display, and the companies focused on LCD technology. For LCD makers, it was the worst quarter in years and perhaps the worst ever. Meanwhile, Samsung Display recorded its highest profits ever in the first quarter after it discontinued LCD production.
DSCC’s Quarterly Display Supply Chain Financial Health Report (一部実データ付きサンプルをお送りします) covers the 13 publicly traded panel makers and is based on company financial disclosures. Although US and International accounting standards call for quarterly reports to include an income statement, a balance sheet and a cash flow statement, in China the accounting standards do not require a cash flow statement and do not require results by business segment. For our analysis we have estimated Depreciation/Amortization based on Q2’22 levels to calculate EBITDA for Q3’22.
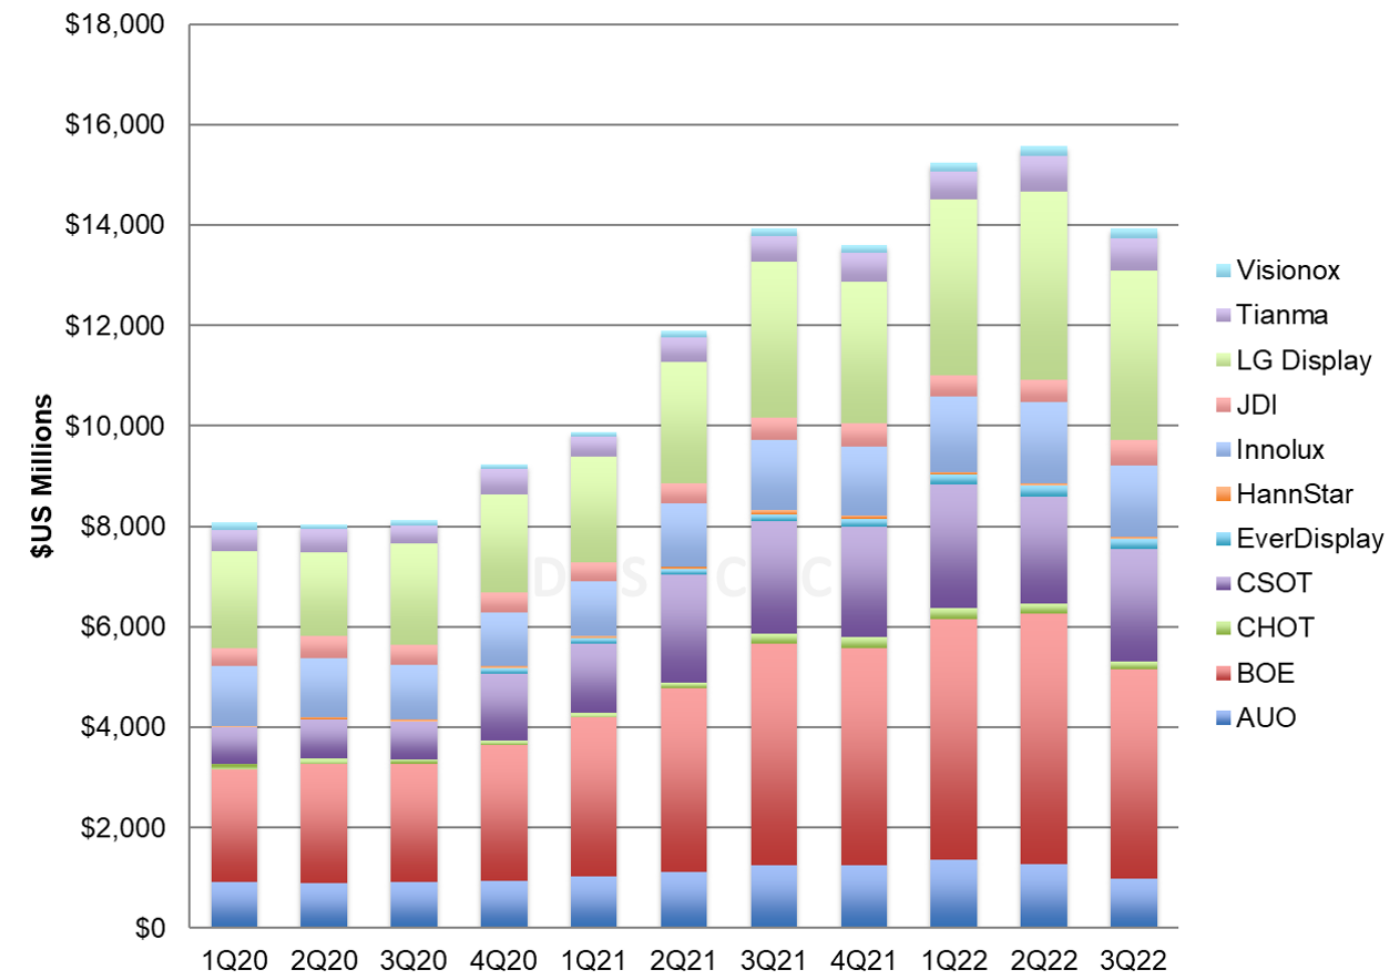
The first chart in this section shows quarterly revenues for FPD makers. Total revenues increased by 1% Q/Q but declined by 28% Y/Y at $26.8B, down 30% from their all-time high of $38.2B in Q4’21. The slight sequential increase in total display revenues obscures the huge gap between LCD-focused and OLED-focused companies. Samsung Display revenues increased 15% and LGD revenues increased 14% Q/Q as both companies enjoyed the surge in demand for OLED smartphone panels with the iPhone 14 launch. Excluding the two Korean companies, revenues declined 7% Q/Q and 37% Y/Y.
Flat Panel Display Maker Revenues
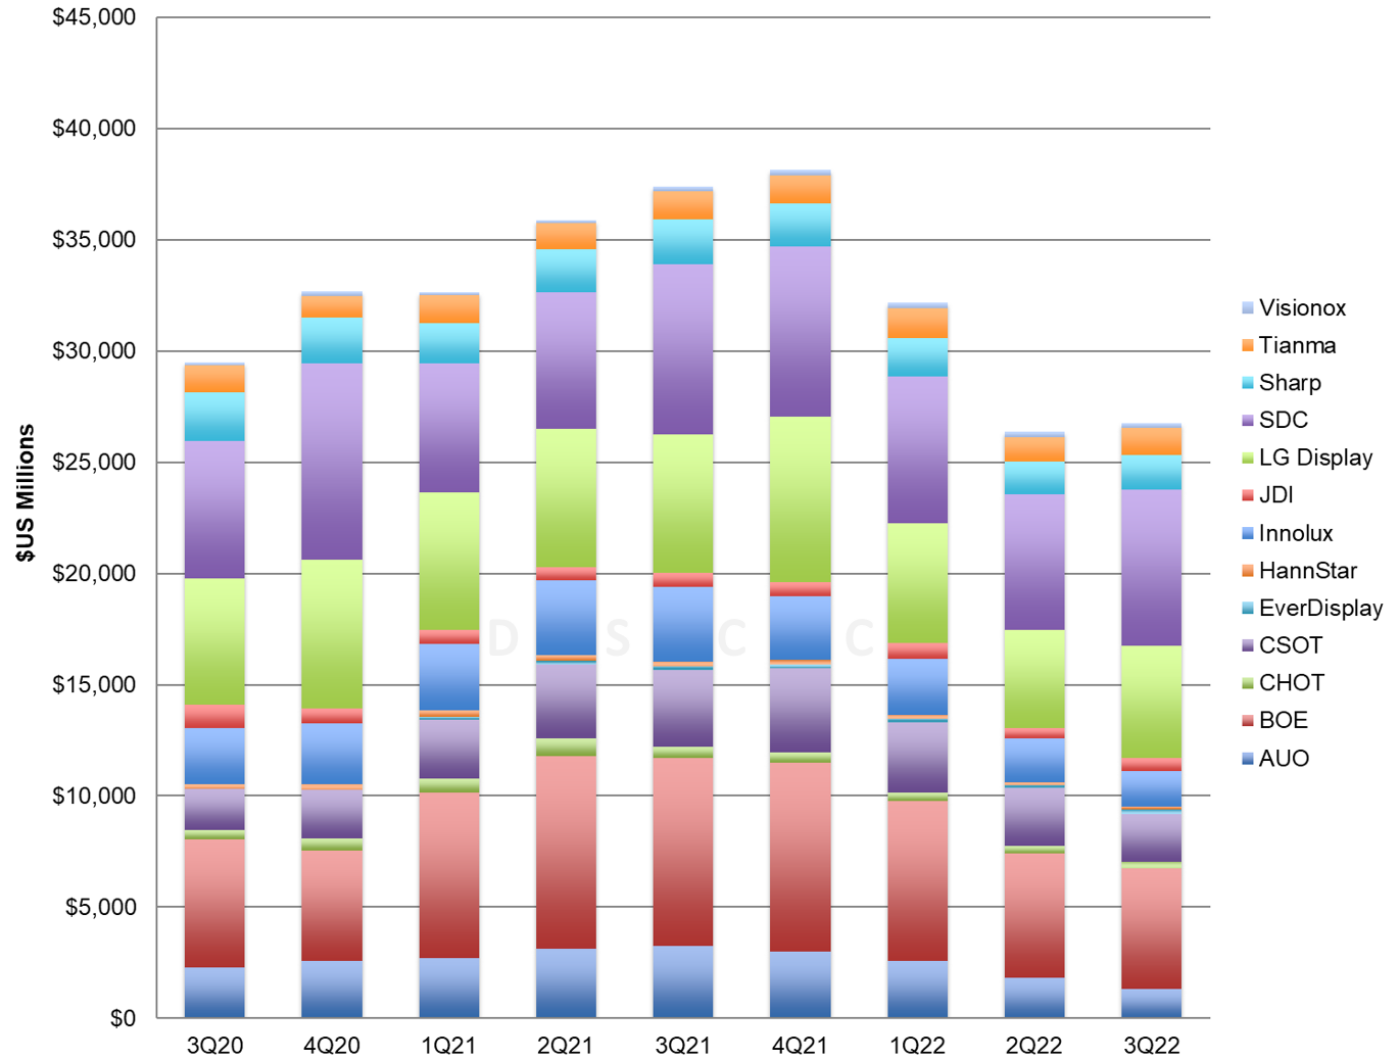
While BOE held the leading position in revenue share for five quarters during the pandemic demand surge, SDC revenues surpassed those of BOE in Q2’22 and SDC extended its lead in Q3. SDC’s share of FPD revenue increased to 26.2%, its highest share since Q4’20, while BOE’s share fell to 20.2% as its revenues declined 3% sequentially and LGD’s share increased to 18.9% in the quarter. The shares for LCD-centric AUO, Innolux and CSOT all decreased sharply in Q3’22 as sequential revenues at those companies declined 28%, 17% and 20%, respectively.
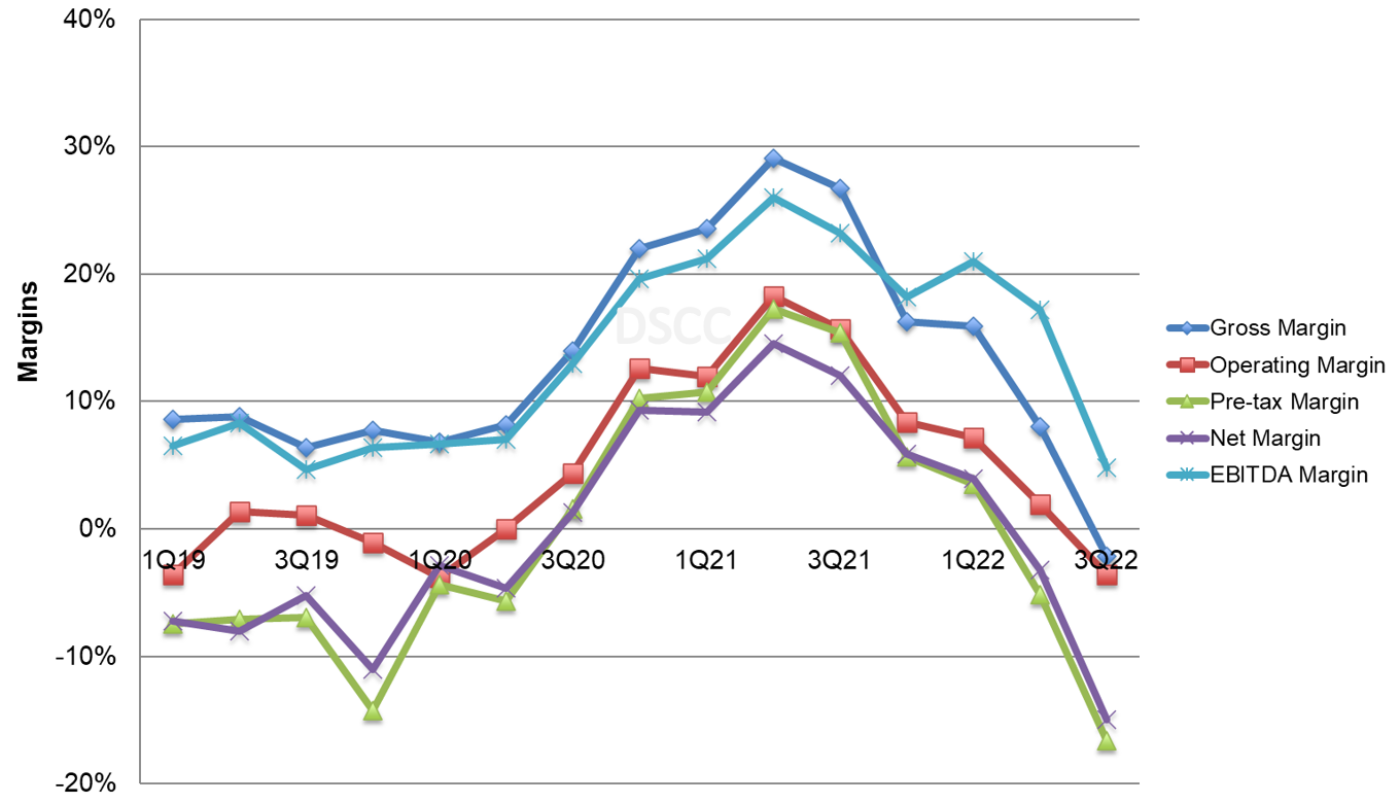
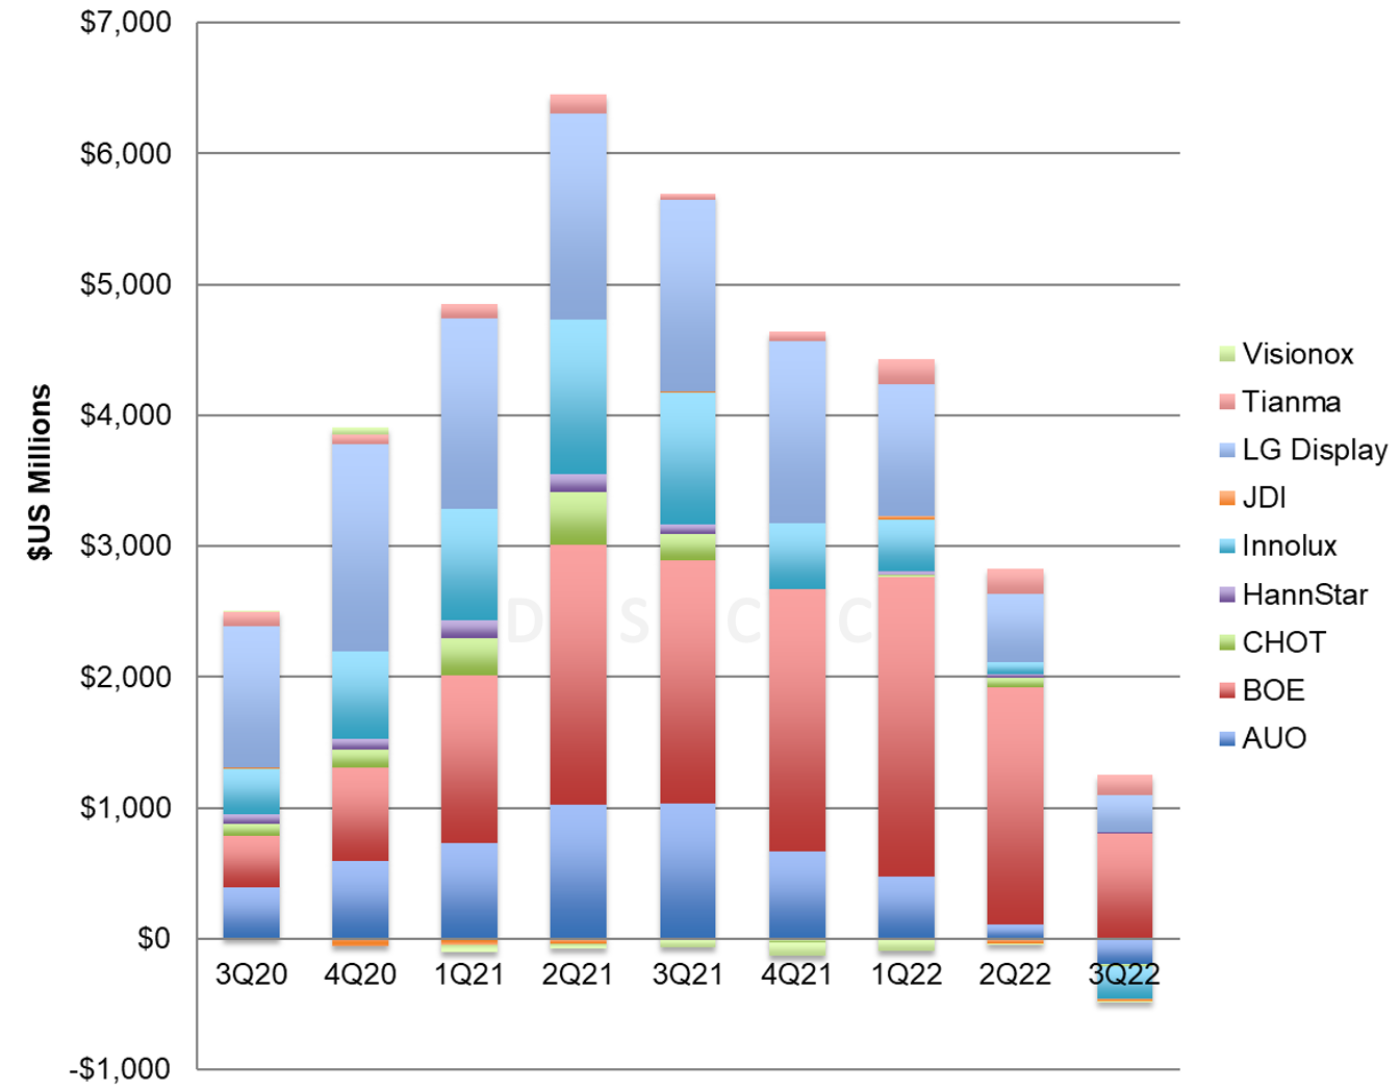
The effect of the Crystal Cycle is clearly shown on the next chart of industry margins. The pandemic-fueled increase in LCD panel prices for TVs and IT products increased gross margins and EBITDA margins for five straight quarters to a peak in Q2’21. The down part of the cycle started in Q3’21 and has continued since. In Q3’22, industry margins declined between 6% and 12% Q/Q and are now down 22%-34% from their all-time highs set in Q2’21.
Note that while operating margin figures include SDC, all other metrics exclude SDC because Samsung does not provide a full income statement at the business segment level. SDC’s positive OPM% brings up the industry average substantially in Q3’22; excluding SDC the industry’s operating margin fell to -13% in Q3.
Display Industry Margins
The decline in LCD panel prices has hit gross margins for every company in the industry, as shown in the next chart. Industry gross margin figures exclude SDC, Sharp and China Star because these companies do not report gross profits for their display business segments, but for the ten companies that report gross profits, total industry gross profits were negative for the first time ever. Even before operating expenses such as Research and Development (R&D) and Selling, General and Administrative (SG&A) expenses, flat panel display makers were losing money.
Display Industry Gross Margins by Company
While BOE and LG Display managed to continue to report positive gross margins, gross profits declined by 84% and 83% Q/Q, respectively, for the two companies. AUO, CHOT, EverDisplay, Innolux and Visionox all reported negative gross margins. Gross margins for the industry peaked at more than $7B in Q2’21 but have fallen by nearly $7.5B from that height in the latest quarter.
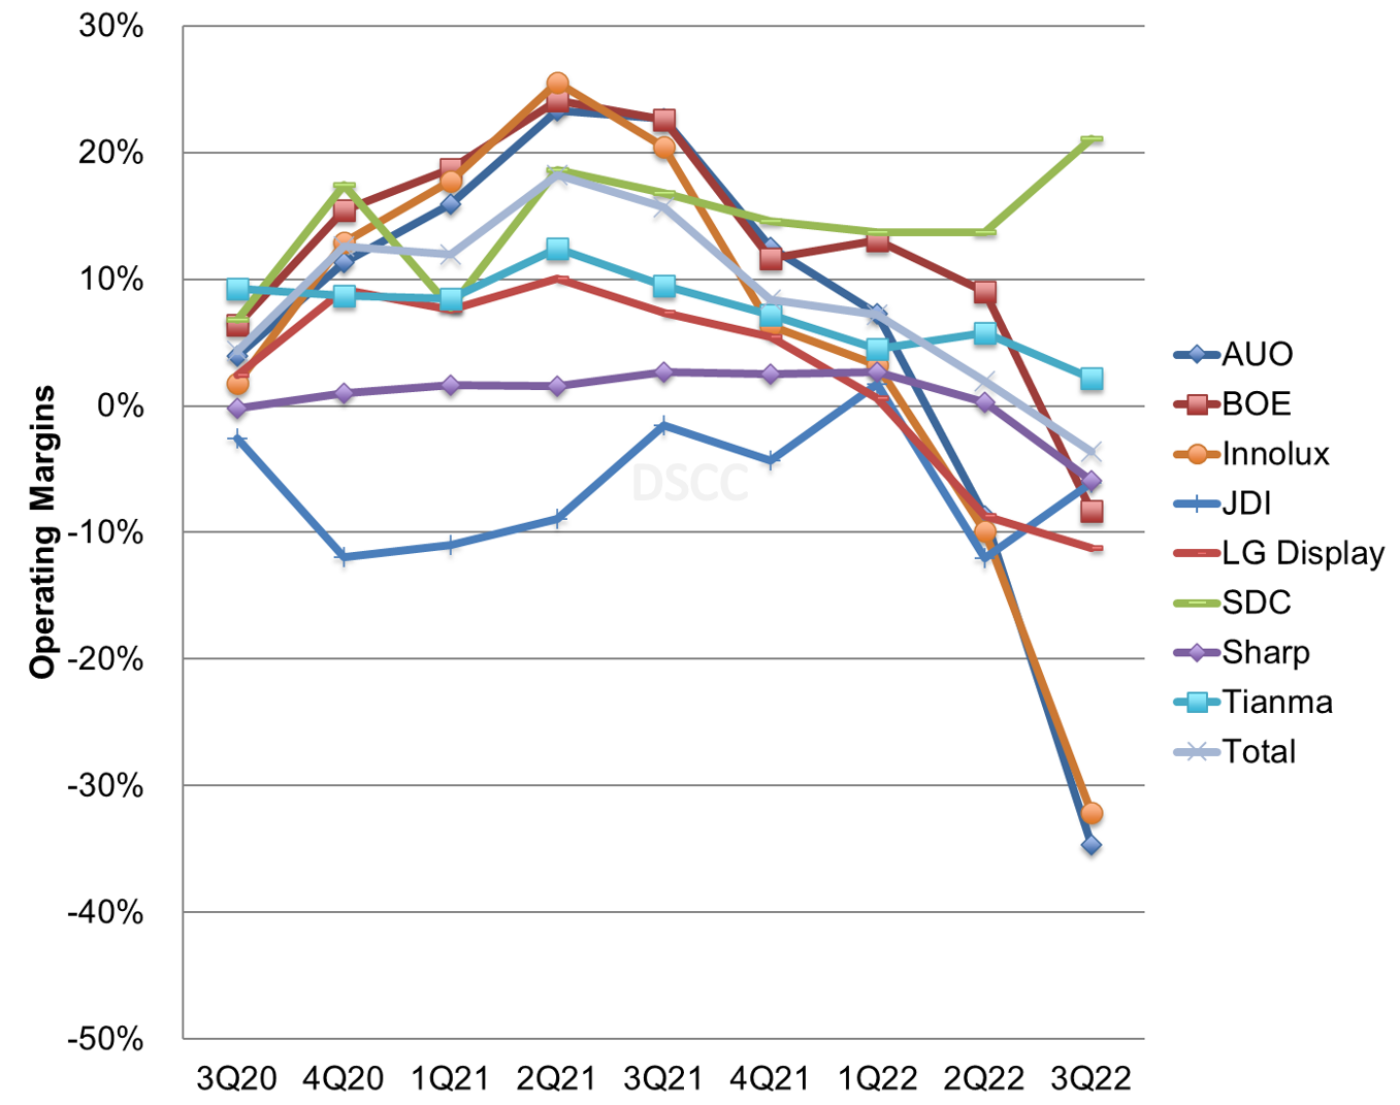
The next chart showing operating margins demonstrates the huge gap between Samsung Display and all other companies in the industry. While LCD-focused companies’ profits surged in 2021, the fortunes of these companies have fallen precipitously while SDC’s profitability has improved. Not shown on this chart is CHOT, an extreme case which requires a different scale: CHOT operating margin peaked at +43% in Q2’21 but fell to -42% in Q3’22. Among other companies in the industry, besides SDC only Tianma reported a positive operating profit in Q3.
Panel Maker Operating Margin %
Net profit figures exclude Samsung and Sharp, which do not report net profits of their display businesses, and in Q3’22 the figures also exclude CSOT as parent TCL Technologies did not report its business segment results. TCL Technologies reported a net loss for the quarter. All ten companies that report net results reported a net loss in Q3, and the industry in total lost $2.4B in the third quarter, an increase from $900M in Q2’22 and the second consecutive quarter of net losses after seven quarters of net profits. In one year, the quarterly net profit of panel makers decreased by nearly $6 billion.
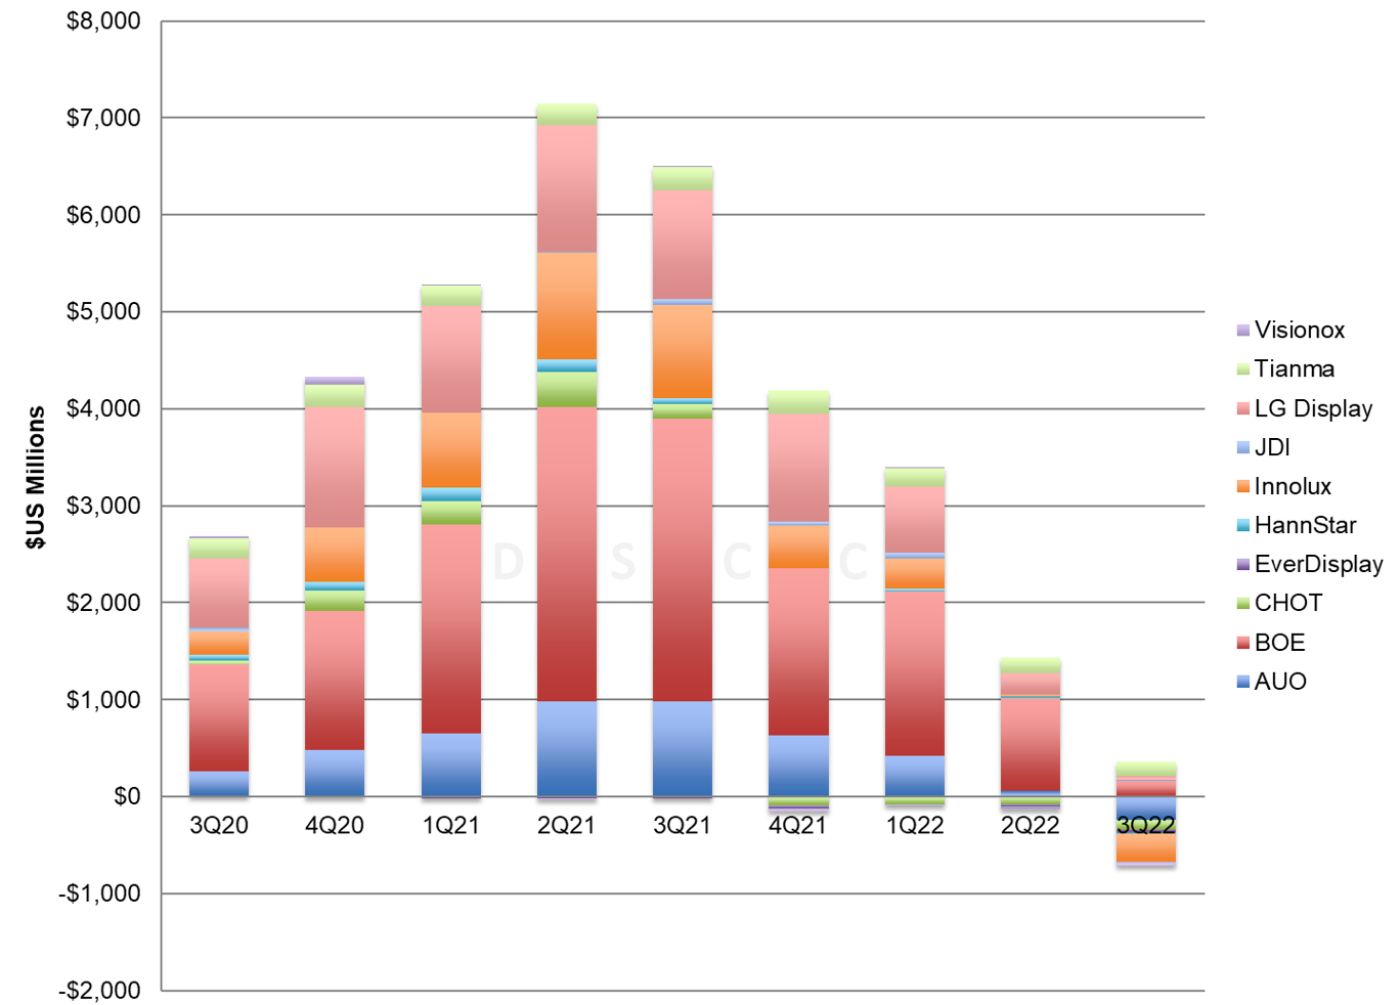
EBITDA by company is shown in the next chart, and estimated EBITDA for the industry decreased by 72 Q/Q and by 86% Y/Y to $767M. Since Chinese panel makers do not publish a quarterly cash flow statement, Q3’22 Depreciation & Amortization is estimated by Q2’22 DA, and EBITDA is calculated. The DA figures will be revised when full-year results are available. AUO, CHOT, Innolux, JDI and Visionox reported negative EBITDA. With massive depreciation charges on its huge industrial base, BOE continued to report positive EBITDA, but BOE EBITDA decreased by 55% Q/Q.
Panel Maker EBITDA
Turning to company balance sheets, we see that the sharp reductions in fab utilization in Q3 helped to bring down inventory at most companies. Inventory decreased by about 10% or $1.6B from the end of June to the end of September even though shipments declined for these companies, but they remain nearly $6 billion higher than two years ago. Inventory days decreased by 13 days Q/Q but are still 10 days higher than a year ago. High inventory continues to put pressure on panel prices in Q4.
Panel Maker Inventory Value
The profits during the pandemic allowed most of the panel makers to pay down debt and establish clean balance sheets, but with net losses and difficult cash positions debt to equity ratios started increasing again in Q2’22 and worsened in Q3. Taiwan makers AUO, Innolux and HannStar have conservative balance sheets with negative net debt/equity, but BOE’s D/E increased from 59% to 62%, China Star parent TCL Technology’s increased from 115% to 124%, and LG Display’s D/E increased from 96% to 107%.
The industry saw its best upswing of the Crystal Cycle in 2020-2021 and is now seeing its worst downswing since at least 2008-2009. The companies which benefitted most during the upcycle concentrated on LCD panels for large-area applications; this includes the Taiwan panel makers but also CHOT, BOE and CSOT in China. With the start of the downcycle in Q3’21, the companies focused on large-area LCD are suffering disproportionately. Meanwhile, Samsung Display remains uniquely profitable in making OLED display panels and enjoyed record profits in the third quarter. With LCD panel prices showing slight increases in October, we may see that operating results for LCD makers improves in the fourth quarter, but it will be a long climb upward toward profitability for most companies in the industry.
本記事の出典調査レポート
Quarterly Display Supply Chain Financial Health Report
一部実データ付きサンプルをご返送
ご案内手順
1) まずは「お問い合わせフォーム」経由のご連絡にて、ご紹介資料、国内販売価格、一部実データ付きサンプルをご返信します。2) その後、DSCCアジア代表・田村喜男アナリストによる「本レポートの強み~DSCC独自の分析手法とは」のご説明 (お電話またはWEB面談) の上、お客様のミッションやお悩みをお聞かせください。本レポートを主候補に、課題解決に向けた最適サービスをご提案させていただきます。 3) ご購入後も、掲載内容に関するご質問を国内お客様サポート窓口が承り、質疑応答ミーティングを通じた国内外アナリスト/コンサルタントとの積極的な交流をお手伝いします。
