FPDメーカーのQ3’22業績 (LGD、AUO、Innolux編)
冒頭部和訳
LG Display、AUO、Innoluxが先週の決算発表で報告したように、価格下落と需要低迷がFPDメーカーの第3四半期の収益性に大きな打撃を与えた。3社とも今四半期は純損失が拡大、ここ数年で最悪の四半期となったと報告している。
Panel Maker Q3 Earnings: LGD, AUO and Innolux Pile Up Big Losses
Falling prices and weak demand hit hard on panel maker profitability in the third quarter, as reported by LG Display, AUO and Innolux in their earnings releases last week. All three companies reported larger net losses for the quarter, the worst quarter in years.
LG Display
After a tiny net profit in the first quarter of 2022, LGD results were down sharply in the second quarter. The company continued to reiterate its strategy to shift to OLED but will find it increasingly difficult to fund the required investments from LCD operations.
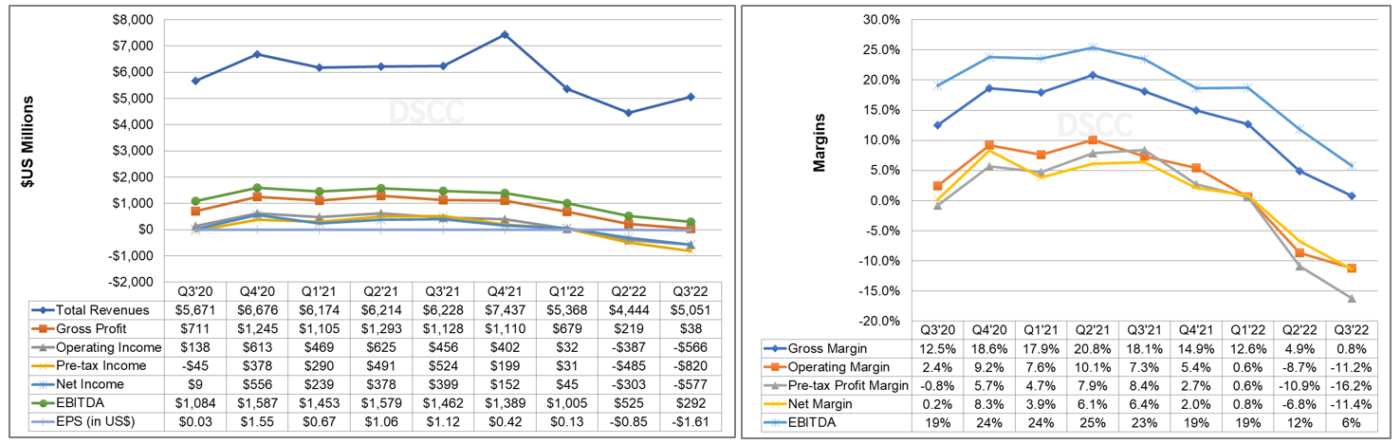
Although increased sales of smartphone panels helped it record a revenue increase sequentially in the third quarter, LGD reported a net loss of KRW 774B ($577 M) on revenues of KRW 6.8T ($5.1B). In US$, revenues were up 14% Q/Q but down 19% Y/Y; the Korean won depreciated 6% in the quarter and 13% compared to Q3’21. LGD fell to an operating loss of KRW 759B ($566 M), compared to a smaller operating loss in Q2’22 and an operating profit in Q3’21. Revenues were in line with consensus estimates but EBITDA, operating profit and net income all fell below consensus by KRW 300-400B.
EBITDA of KRW 391B ($292M) was 47% lower than consensus of KRW 741B, and net income was KRW 359B worse than consensus of KRW -415B. Gross margin, operating margin, EBITDA margin and net margin all declined Q/Q by 3%-6% to the worst levels since at least 2012.
LG Display Income Statement Highlights
LGD’s inventory decreased by about KRW 200B Q/Q and inventory days were reduced from 81 to 61 with higher shipments. LGD intends to reduce inventory by an additional KRW 1T by the end of the year and keep it below the normal level.
From an application perspective, revenues from IT applications increased by 14% Q/Q but decreased by 19% Y/Y, while revenues from TV decreased by 8% Q/Q and 37% Y/Y. Revenues from Mobile applications increased by 42% Q/Q and 6% Y/Y. LGD area shipments decreased 1% Q/Q and 8% Y/Y to 7.7M m2. Area price increased 19% Q/Q but decreased 10% Y/Y to $675 as the portion of mobile phone shipments increased sequentially. LGD's mobile phone shipments could have been even stronger, but it was unable to make the LTPO panels for the iPhone 14 Pro Max, shifting revenue and profits to Samsung.
LG Display Revenue by Application

LGD continued to spend heavily on capital expenditures, with KRW 1843B ($1.38B) in the quarter. For the full year 2022, LGD said that capex would be reduced by more than KRW1T from the plan early this year. In January, LGD had said that 2022 capex would be less than EBITDA. In April, LGD said that capex will be "around" EBITDA. In July, LGD said capex for 2022 is expected to be in line with depreciation/amortization and did not refer to EBITDA. In October, LGD said capex would be “within D&A level,” referring to Depreciation and Amortization. Through the first three quarters, LGD has booked KRW 3.5T in D&A, KRW 2.3T in EBITDA and KRW 4.3T in capex.
LGD’s balance sheet and cash position remain a concern. LGD's cash flow from operations increased by 92% Q/Q but decreased by 45% Y/Y in $US terms, and free cash flow fell to a negative KRW 906B (-$676M).
LGD’s debt increased by more than $300 million in the quarter, and debt/equity worsened from 96% to 107%.
The debt picture continues to look worse if you consider the market value of LGD’s equity has fallen to less than half its book value. LGD’s market capitalization as of October 28th, 2022, was $3.32B compared to a book value of $10.7B, so LGD’s debt to market equity is 344%, a level which may make it difficult for LGD to raise debt.
LGD provided the following guidance for Q3’22:
- LGD expects area shipments to be up by low-to-mid-single digit % Q/Q;
- LGD expects ASPs to increase a low-to-mid-single digit % Q/Q on increased mobile shipments;
- For OLED TV; LGD now expects shipments to decline Y/Y (from 7.8M in 2021); in January it had communicated a target for 10M panels in 2022. LGD’s guidance for panel shipment in 2023 is 7M units for OLED TV (with some additional units for monitors), which implies that it will not exceed its 2021 total until 2024 at the earliest.
In other notes from the earnings call:
- LCD TV business is being downsized in accelerated phases, LGD will pull up the timing of terminating production in the Gen 7 fab in Korea and reduce production of Gen 8 TV fab in China to accelerate the shift to OLED;
- LGD's P7 fab has capacity of 150K/month; it will be reduced by 130K by 1H’23 (in the prior quarter it was a reduction of 90K). Capacity for P8 will be reduced by 80K/month in the same time frame;
- The Russia-Ukraine war has been very hard on the OLED TV market because 45% of sales were in Europe.
- For LCD Supply/demand, LGD is seeing "some positive sign" on LCD TV panel prices; panel companies have begun to increase the prices.
AUO
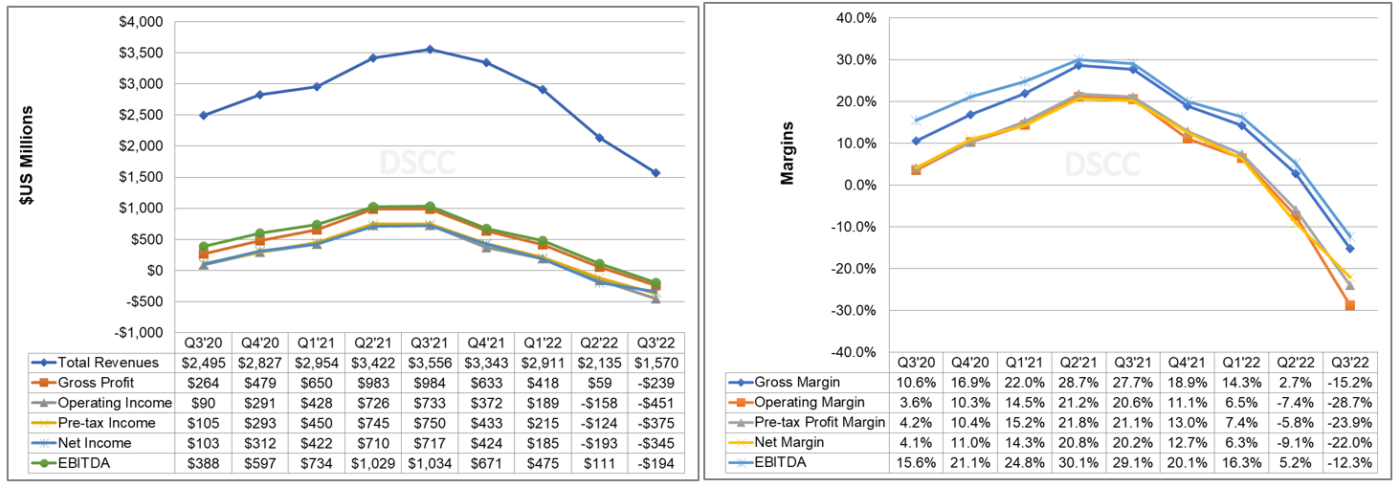
In Q3’22, price declines and weaker demand decimated AUO's results as the company fell to its worst net loss since at least 2012. AUO reported a net loss of TWD 10.5B ($345M) on revenue of TWD 47.7B ($1.6B). Q3 revenues, operating income, net income and EBITDA all fell far short of consensus expectations. Q3 Margins fell sequentially by a double-digit % for the second quarter in a row, falling by 13%-21% Q/Q as lower panel prices took a toll. Margins fell to their lowest point since at least 2012.
AUO Quarterly Income Statement Highlights and Margins
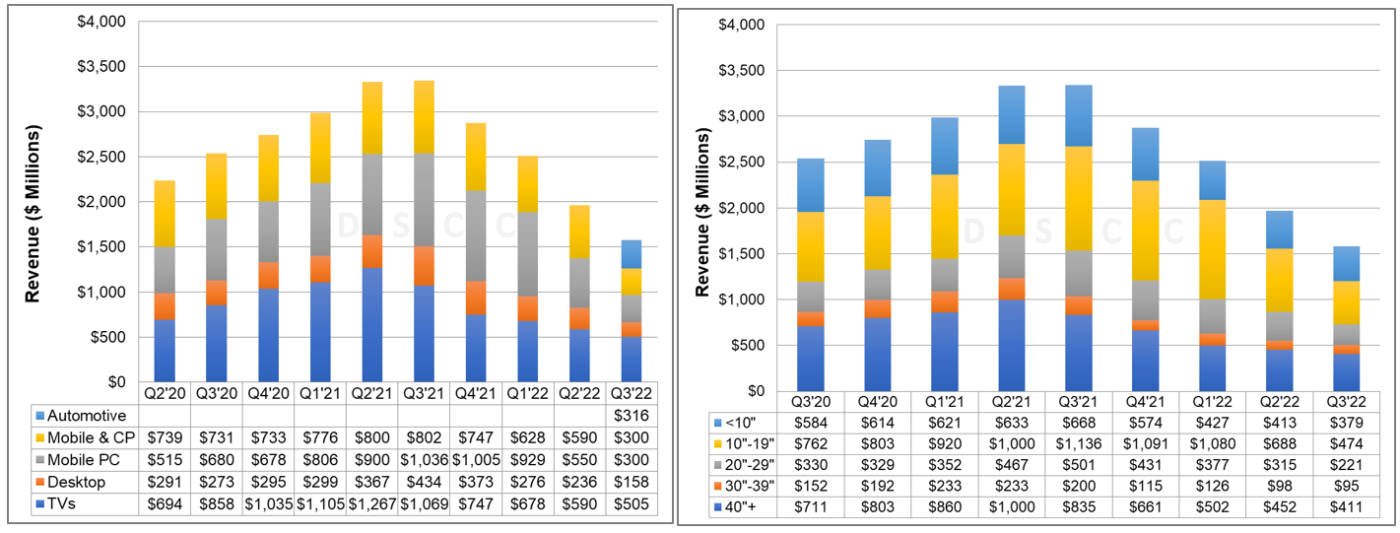
In revenues by application, product mix shifted away from TV and monitor and toward mobile PC, automotive and Other (non-Display). Revenues for TVs fell 49% Q/Q and 78% Y/Y and revenues for monitors fell by a similar %. No display application had a Q/Q or Y/Y increase in revenues; automotive revenues were the least bad, falling 11% Q/Q and 6% Y/Y. AUO reported that its solar business had increased to 10% of revenues in the third quarter.
AUO Quarterly Revenues by Application and Screen Size
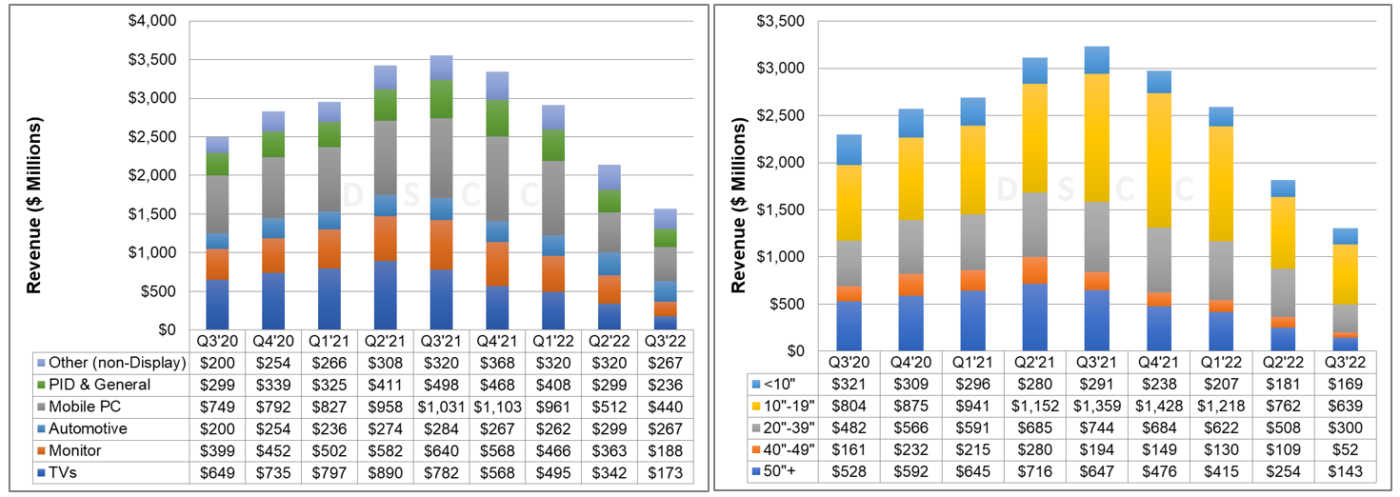
Screen size mix shifted away from 20" and larger categories toward 10-19" and <10", but revenues for every screen size category declined Q/Q between 7% and 52%. Area shipments decreased by 21% Q/Q and 40% Y/Y to 3.9 million square meters and area ASP decreased by 4% Q/Q and 29% Y/Y to $360. AUO restrained its inventory, reducing by TWD 7B, and inventory days decreased from 55 to 49 despite lower sales revenue.
For the first time since Q1'20, AUO recorded negative operating cash flow of TWD 5.0B (-$164 million) and negative free cash flow of TWD 16.5B ($544 million). Capital expenditures increased 43% Q/Q and 126% Y/Y, but AUO said that its Gen 8.6 expansion in Taichung would be put on hold indefinitely.
AUO debt increased in the quarter by TWD 6B, but with a weaker currency this increase was only $133M. Debt/equity increased from 23% to 29% and net debt/equity remained well below zero at -11%. As of October 28th, 2022, AUO has a market value of TWD 131B ($4.2B) or 65% of book value, so debt to market equity remains a very healthy 44%.
AUO offered cautious guidance for the fourth quarter of 2022. AUO expects sequentially:
- Area shipments to be up by low-to-mid-single digits % Q/Q;
- Area ASP to be down by mid-single digit % Q/Q;
- Will dynamically adjust product mix based on market conditions.
AUO notes that some other factors, such as increasing energy (i.e., solar) revenue or favorable FX may have positive impacts.
Innolux
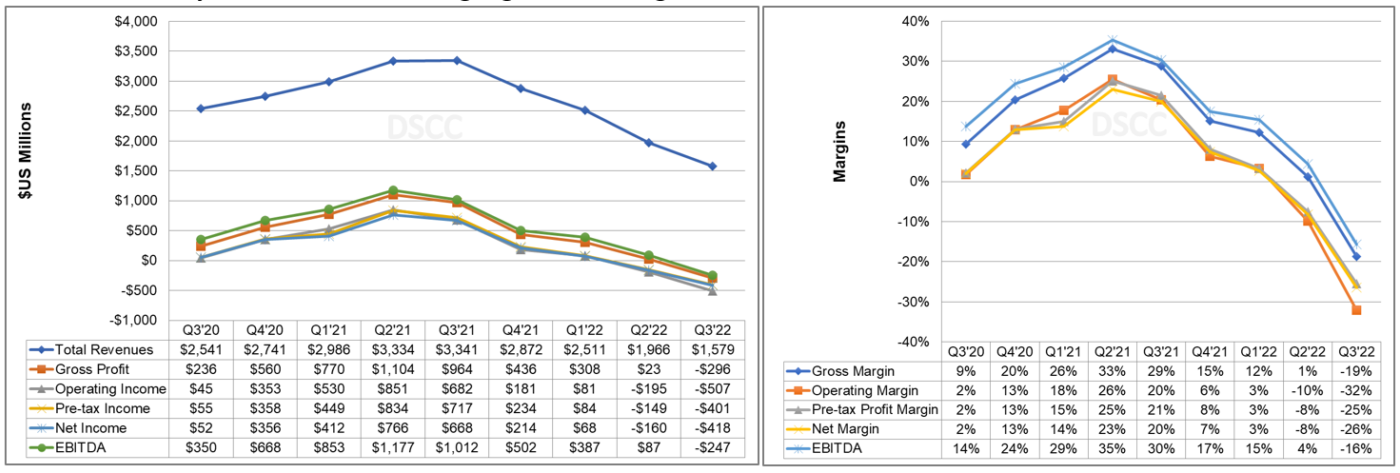
Innolux cited the Russian-Ukrainian war, China's epidemic lockdown, inflation and interest rate increases resulting in a weakening of panel demand and lower panel prices. Innolux revenues decreased 20% Q/Q and 53% Y/Y to TWD 48B ($1.6B), falling just short of analyst expectations of TWD 48.9B. Innolux’ operating loss of TWD 15.4B (-$507M) was much worse than analysts' expectations of a loss of TWD 7.9B, and net loss of TWD 12.7B (-$418M) also was much worse than analysts' expectations of a loss of TWD 7.2B. Margins fell by 17-22% across the board and have fallen 49%-58% from the record-high margins of Q2’21.
Innolux Quarterly Income Statement Highlights and Margins
In Q3, Innolux area shipments decreased 6% Q/Q and 17% Y/Y to 6.1M square meters, while area prices decreased 14% Q/Q and 43% Y/Y to $254 per square meter. Innolux product mix shifted away from mobile PC with the % of revenues decreasing from 28% to 19%.
Innolux split out Automotive panel revenues for the first time; it was formerly included in mobile phones and commercial products. Automotive panels supplied 20% of revenues in Q3'22, while the category mobile phones and commercial products went from 30% in Q2 (including auto) to 19% in Q3 (excluding auto).
Revenues from all applications and all screen size groups declined Q/Q and Y/Y. The biggest declines were in mobile PC, down 45% Q/Q and 71% Y/Y. Similarly, 10-19" panel revenue declined 44% Q/Q and 68% Y/Y. TV panel revenues declined 12% Q/Q and 48% Y/Y while revenues from desktop declined by 31% Q/Q and 60% Y/Y.
Innolux Revenues by Application and Screen Size
Innolux’s guidance suggested that Q4’22 would be even more difficult:
- Large panel shipments to be flat Q/Q;
- Blended ASP to be down low single-digit % Q/Q;
- Small & medium panel shipments to be down low teens % Q/Q.
Innolux cautioned that although Q4 is a peak season in Europe and US, the global economy is still severe. In response to the demand slowdown, Innolux has carefully managed costs, resulting in a 19% decrease in operating expenses in Q3’22 compared to a year earlier. Following its customary practice, Innolux did not release its full balance sheet and cash flow statement; this is expected in 7-10 days. However, Innolux disclosed that its deprecation charges in Q3’22 were TWD 7.9B ($260M) and capital expenditures were TWD 4.6B ($151M).
本記事の出典調査レポート
Quarterly Display Supply Chain Financial Health Report
一部実データ付きサンプルをご返送
ご案内手順
1) まずは「お問い合わせフォーム」経由のご連絡にて、ご紹介資料、国内販売価格、一部実データ付きサンプルをご返信します。2) その後、DSCCアジア代表・田村喜男アナリストによる「本レポートの強み~DSCC独自の分析手法とは」のご説明 (お電話またはWEB面談) の上、お客様のミッションやお悩みをお聞かせください。本レポートを主候補に、課題解決に向けた最適サービスをご提案させていただきます。 3) ご購入後も、掲載内容に関するご質問を国内お客様サポート窓口が承り、質疑応答ミーティングを通じた国内外アナリスト/コンサルタントとの積極的な交流をお手伝いします。
