TV用LCD価格が過去最安値を更新
アジア代表・田村喜男の一言補足
8月のLCD TV用パネル価格は、先月予測より65インチ以上で下振れという結果となった。基本的にマージナルコスト (限界費用=部材コストと間接経費の総計であり、減価償却費と人件費の固定費を除く、いわゆる変動費総計を意味する) 近辺か、その上方で底打ちになるとみられる。32インチから65インチまでのパネル価格は、2022年下期でほぼマージナルコストに肉薄し、下げ止まる流れとなるようだ。75インチや85インチのパネル価格はまだ余力があるため、下げ足がまだ緩和されずに、2023年初頭にかけてマージナルコストに肉薄していくかもしれない。
LCD TV Panel Prices Reach New Lows
LCD TV panel prices reached all-time lows in August but they continue to decline in September, and we continue to forecast that the industry will have an “L-shaped” recovery in the fourth quarter. In other words, no recovery at all until 2023; the only question is how low prices will go before they flatten out. The ‘perfect storm’ of a continued oversupply, near-universally weak demand and excessive inventory throughout the supply chain has combined, and every screen size of TV panel has reached an all-time low price. Although fab utilization slowed sharply starting in July, we do not see any signal to suggest that prices can increase any time soon.
Price declines slowed in Q1 but accelerated in Q2 and are continuing to decline at a rapid pace in the current quarter. The results of panel maker and TV maker earnings reports for Q2 suggest that inventory continued to build in the quarter at panel makers. Inventory at LG Displays increased to an all-time record of 81 days at the end of June.
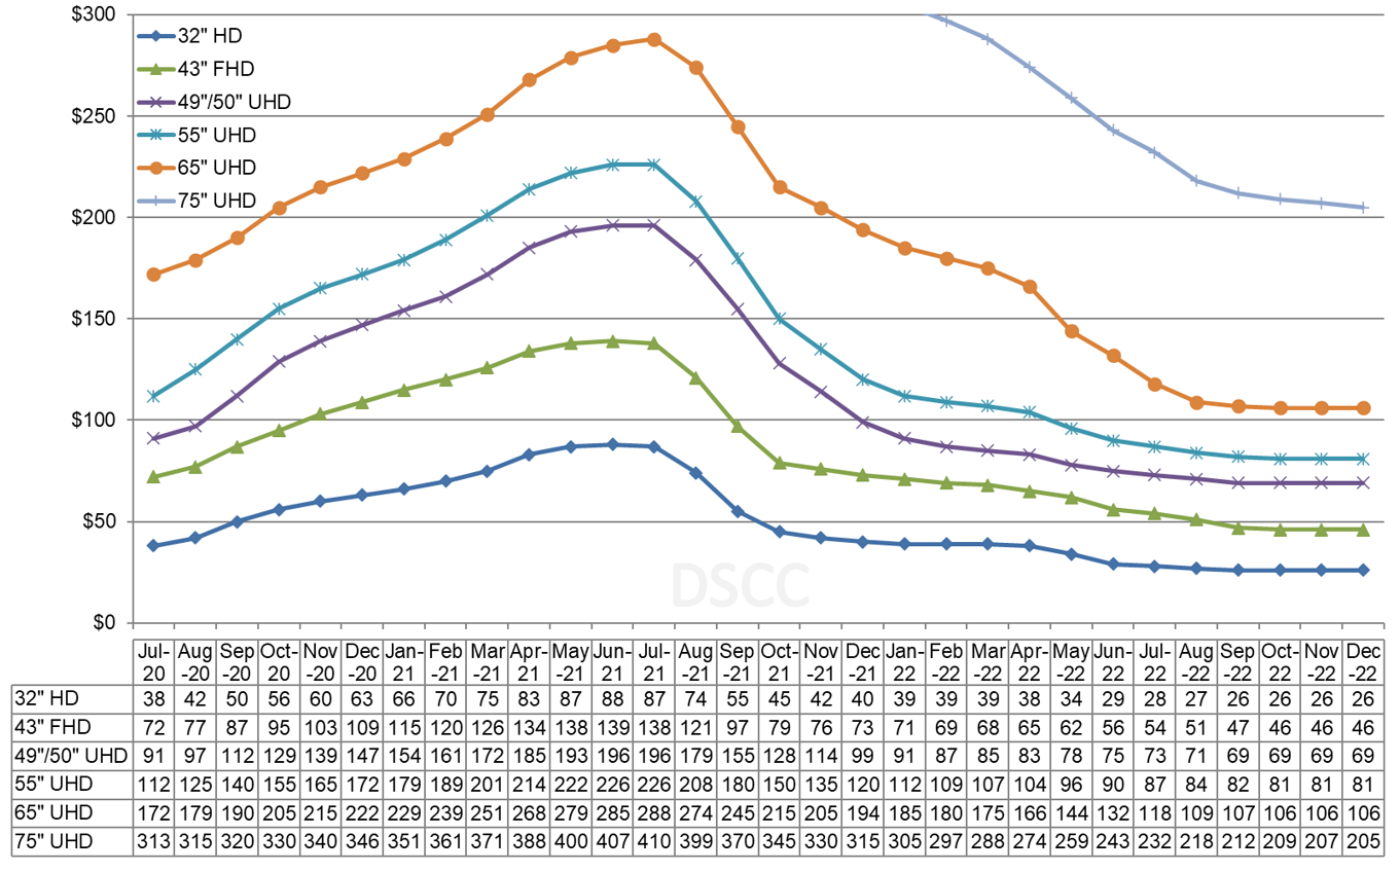
The first chart here highlights our latest TV panel price update, showing the pandemic-fed surge from mid-2020 to mid-2021 and then the fastest price decreases in the industry starting in the autumn of 2021. The average M/M price decline increased each month during the second quarter, from 1.9% in March to 8.1% in June. The average price decline in Q2 was 13.1%.
LCD TV Panel Prices
Prices for all screen sizes below 75” have now fallen below cash costs for most industry players. As a result, we saw significant reductions in utilization in May, June and July. According to DSCC’s Quarterly All Display Fab Utilization Report, LCD industry utilization declined from 87% in April to 83% in May to 73% in June and 70% in July. Although the rate of decline slowed after June, prices have continued to decline by 4% for each month of July, August and September. The damage of the sharp price drops in June will make the Q/Q drop more severe. We expect prices to fall by an average of 15.7% in Q3. These Q3 declines have brought prices even further below cash costs for commodity producers.
As we look at pricing on an area basis, the larger screen sizes made efficiently on Gen 10.5 fabs, 65” and 75”, long enjoyed a significant price premium over smaller sizes, but the price premium for 65” was eliminated in Q2 and in Q3 even the price of 75” panels is falling rapidly. In January 2022, the area price for 65” panels was 14% higher than the area price for 43” panels. In June 2022, that premium dropped to zero.
Monthly Area Prices per Square Meter for TV Panels
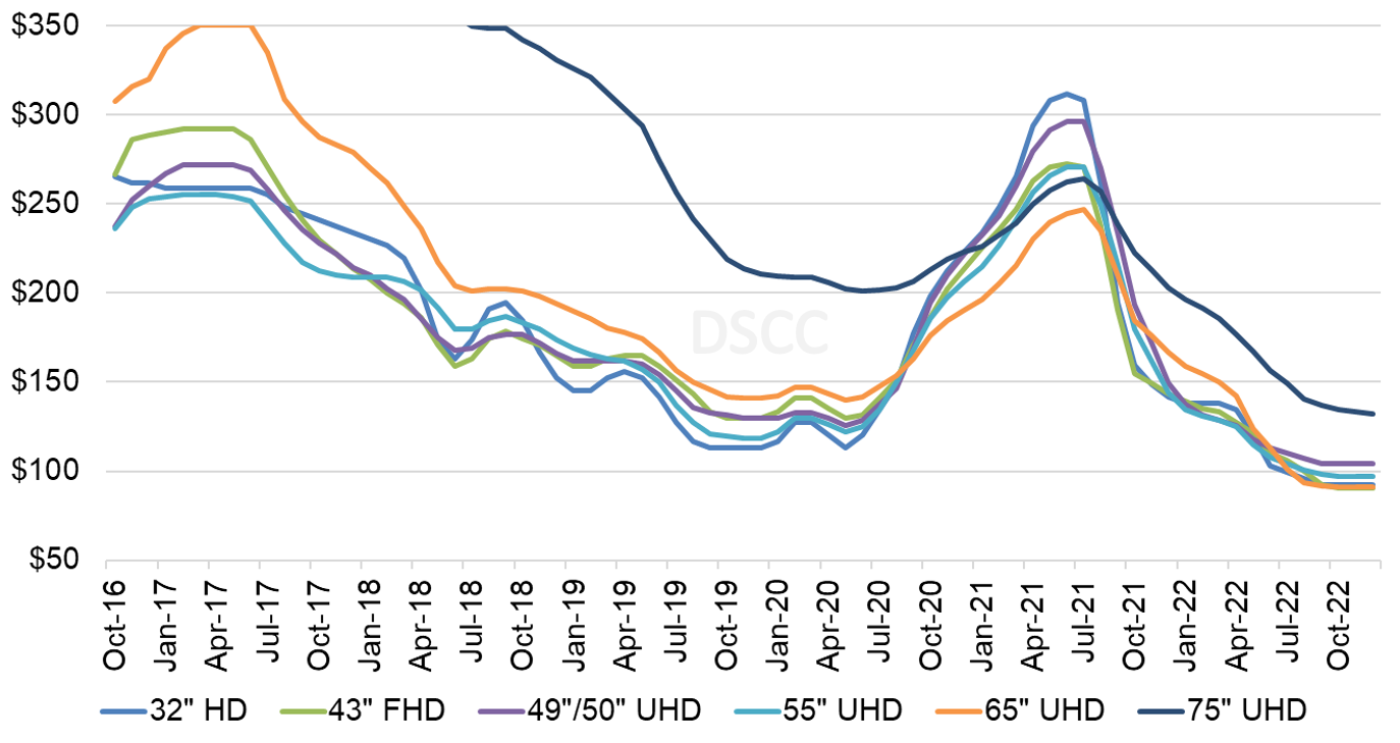
In August, area prices for all screen sizes up to 65” fell in a range from $94 to $107 per square meter, and the 65” area price was the lowest in the industry at $94 per square meter. For September, the largest screen size in our survey, 75” panels, continues to have a premium of $45 or 49% over the benchmark 32”, and this premium has remained roughly stable in the last six months in percentage terms, but that just means that 75” panel prices have been falling as fast as other panel sizes.
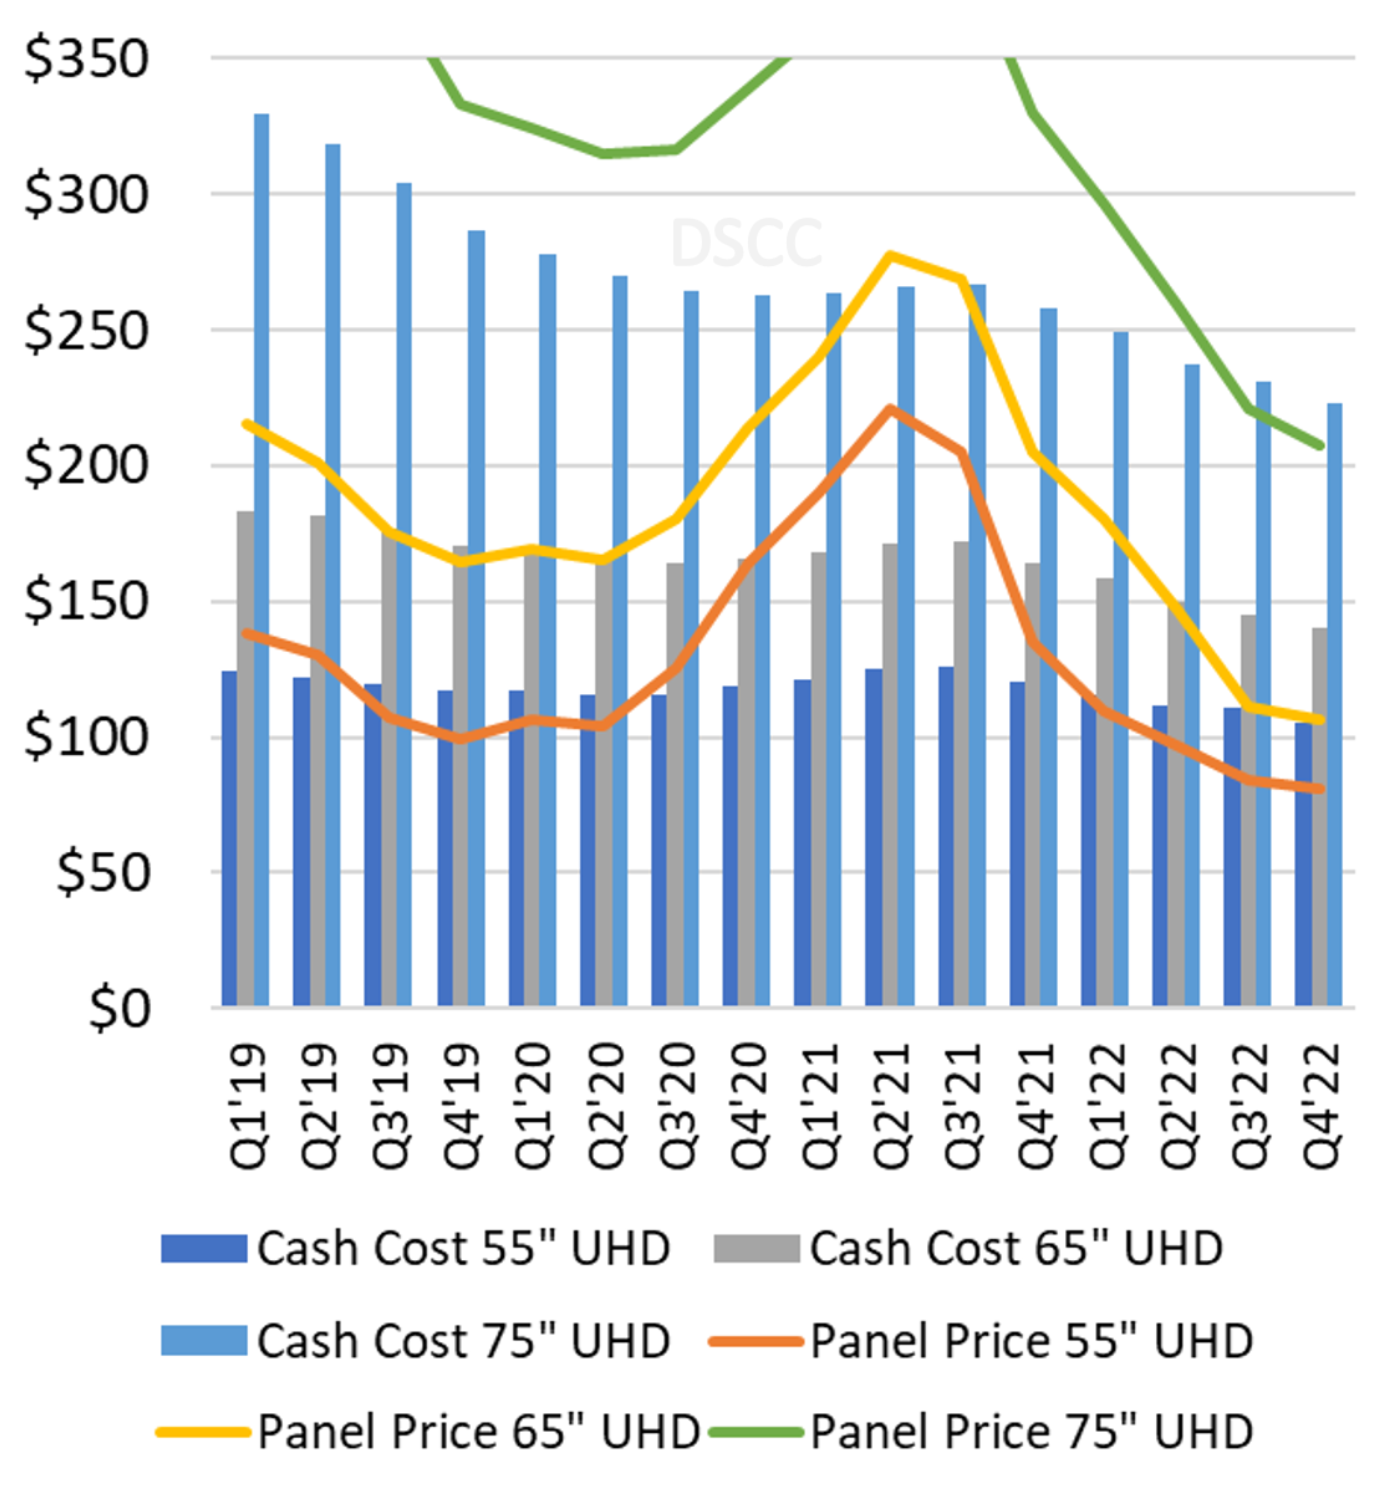
The next chart shows our estimates of cash costs vs. panel prices for large TV panels. While 55” panels have been below cash costs for most of the year, 65” prices reached cash costs in Q2 and for the first time 75” panel prices have fallen below cash costs in Q3.
LCD TV Panel Prices vs. Cash Costs
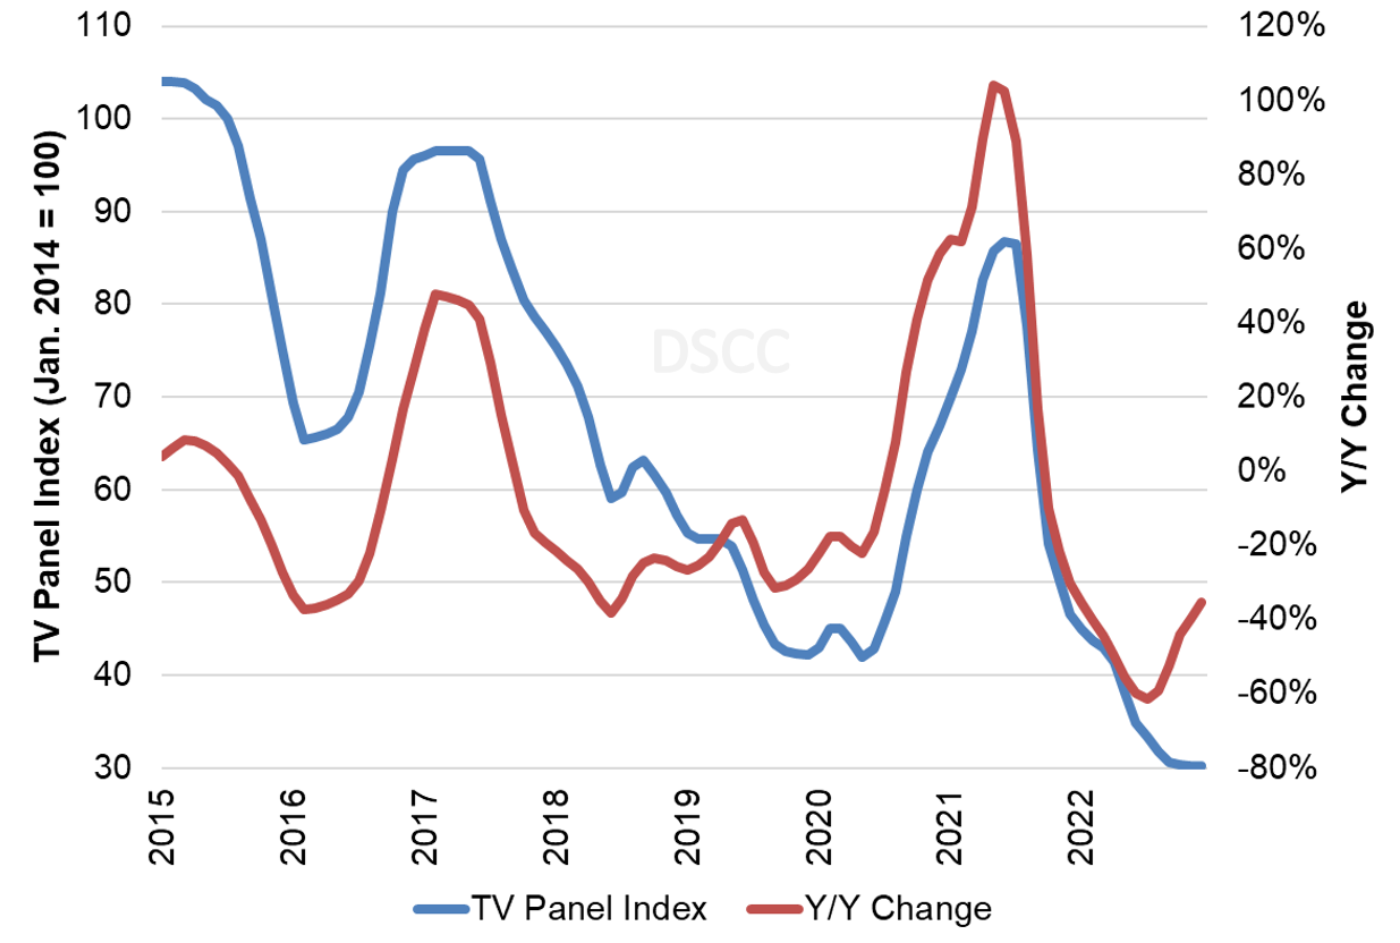
The last chart here shows our TV panel price index, set to 100 for prices in January 2014, and the Y/Y change of LCD TV panel prices. Our index increased from its all-time low of 42 in May 2020 to 87 in June 2021, but prices hit a new all-time low at 41.4 in April and have declined further to 31.8 in August. We now expect the index to continue to decline to 30.2 by December, 65% lower than the peak in June 2021.
TV Panel Price Index and Y/Y Change
As we expected, the lower panel prices and soft demand has led to reduced operating margins for panel makers, based on the companies that have reported Q2 earnings. We expect Q2 and 1H earnings releases by the Chinese panel makers in the week of August 29th and expect them to show sharply reduced margins. With prices continuing to fall we expect Q3 will be even worse.
For many reasons we have described in the last few months, the current oversupply is unlikely to be resolved by an increase in demand, it can only be reversed by a decrease in supply. This has started in Q2 and has accelerated in Q3. That is the first step toward stabilizing the supply/demand balance. Over the decades of the flat panel display industry, we have seen the Crystal Cycle turn many times, and we expect that eventually low prices will drive a combination of reduced supply and increased demand. Unfortunately for flat panel display makers, that point does not appear imminent.
