中国FPDメーカー各社のQ2'22業績比較 (BOE, CSOT, Tianma, CHOT, Visionox)
冒頭部和訳
中国の上場FPDメーカー6社のうち5社が2022年上半期の財務報告を発表した。第2四半期 (Q2'22) の市場低迷の影響が収益と利益に及んでいる。
BOE
BOEは411億元 (62億ドル) の収益に対して22億元 (3.34億ドル) の純利益を報告した。収益は前期比22%減、前年同期比30%減となっている。営業利益は33億元 (5.06億ドル) で、前期のQ1’22は59 億元、前年同期のQ2’21は135億元だった。BOEの純利益はアナリストのコンセンサス予想である35億元を37%下回り、収益はコンセンサス予想の519億元を21%下回った。EBITDAは119億元で、コンセンサス予想の114億元を5%上回った。
BOEのQ2’22の売上総利益は15%で、Q1’22の21%、Q2’21の34%から低下している。営業利益率と純利益率は前期比で3-4%低下したが、EBITDAマージンは29%で前期から変わっていない。
Panel Maker Q2 Earnings: BOE, CSOT, Tianma, CHOT and Visionox
Five of the six publicly traded panel makers in China released their financial reports for the first half of 2022, and the market downturn in Q2 affected revenues and profits.
BOE
BOE reported a net profit of CNY 2.2B ($334M) on revenues of CNY 41.1B ($6.2B). Revenues were down 22% Q/Q and down 30% Y/Y. BOE reported an operating profit of CNY 3.3B ($506M), compared to an operating profit of CNY 13.5B in Q2’21 and an operating profit of CNY 5.9B in Q1’22. BOE net income fell short by 37% of consensus analyst expectations of CNY 3.5B, and revenue was 21% below consensus expectations of CNY 51.9B. EBITDA was CNY 11.9B, 5% better than consensus expectations of CNY 11.4B.
BOE’s gross margin declined from 34% in Q2’21 and 21% in Q1’22 to 15% in Q2’22. Operating and net margins fell by 3-4% Q/Q but EBITDA margin held steady Q/Q at 29%.
BOE Income Statement and Margins
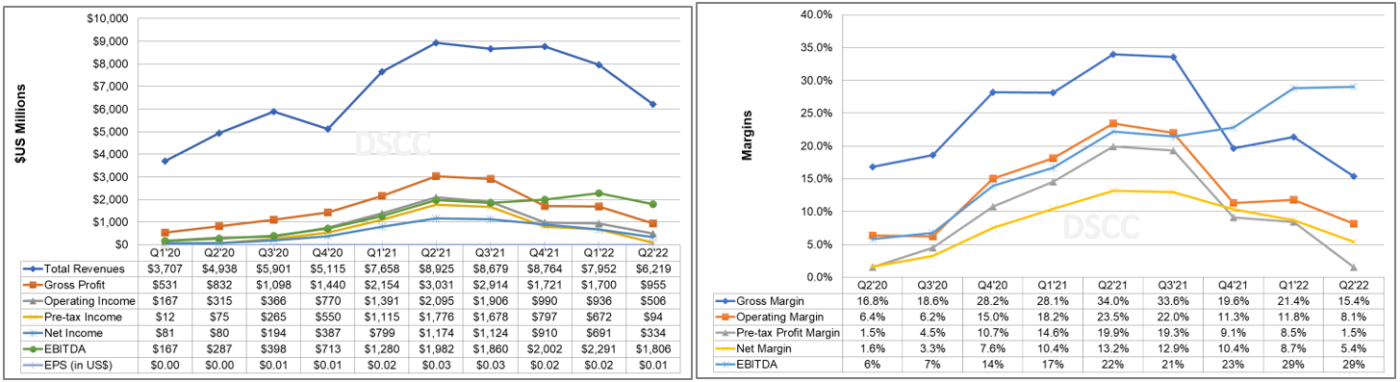
BOE Display revenues decreased 19% Q/Q and 34% Y/Y to CNY 37.1B ($5.6B). Display represented 90.2% of corporate revenues in 1H’22, down from 97.4% in 1H’21. Revenues from BOE’s non-Display businesses, which include IoT Innovation, Sensors and Solutions, MLED and smart medical, increased by 165% Y/Y to CNY 4.03B ($610M) in Q2.
BOE’s inventory increased by 8% Q/Q to CNY 33B ($5.0B) and with lower revenues inventory days increased from 79 to 97.
BOE continues to hold a substantial cash reserve: cash increased 1% Q/Q to CNY 101.5B; in US$ cash decreased by 3% to $15.3B because of currency effects. BOE debt increased by CNY 9B and equity decreased by CNY 7B, so debt/equity increased from 53% to 59% and net debt/equity increased from 8% to 12%.
CSOT
China Star’s corporate parent, TCL Technologies, issued its first half Interim Report last week. TCL cited geopolitical conflicts, rising inflationary pressures, and repeated outbreaks of COVID-19 as leading to weakening demand and lower prices for displays. At a corporate level, TCL Technologies reported a net loss in Q2’22 of CNY 690M (-$101M) on revenues of CNY 44.0B ($6.7B).
CSOT Income Statement and Margins
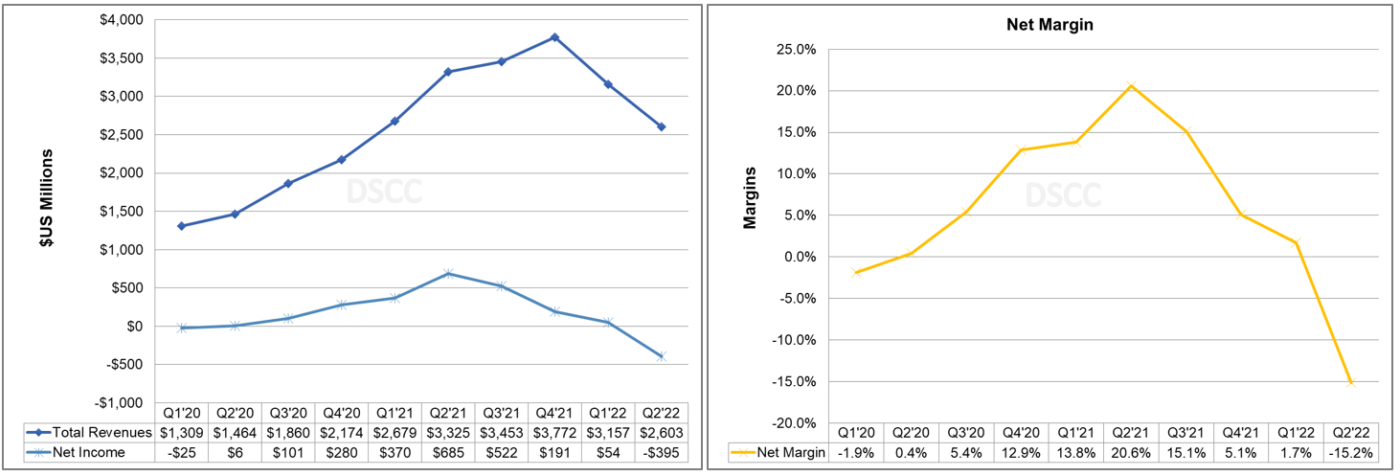
TCL's Display Business (CSOT) reported a net loss of CNY 2.6B (-$395M) on revenues of CNY 17.2B ($2.6B). Display revenues declined 18% Q/Q and 22% Y/Y. The net loss in Q2 compares with a net profit in Q2’21 of CNY 4.4B and a net profit in Q1’22 of CNY 340M. CSOT revenues represented 40% of the corporate total for TCL Technologies; TCL also has a substantial business in photovoltaic and semiconductor materials and several smaller business units. CSOT shipped 22.4M square meters of displays in the first half of 2022, an increase of 26% Y/Y, but its average area price declined by 34% Y/Y to $231 per square meter.
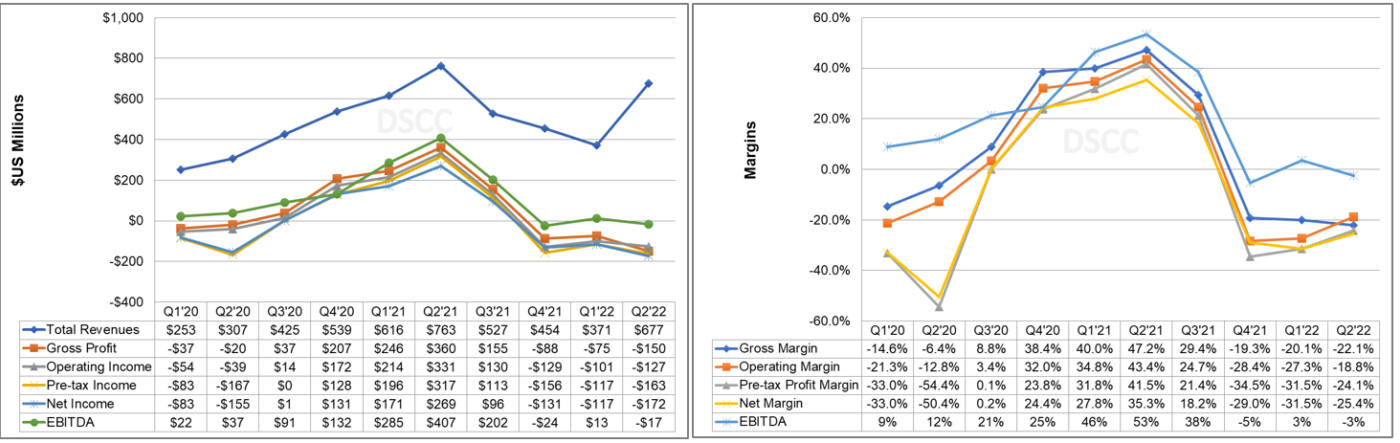
CHOT (Caihong Display)
CHOT reported a net loss of CNY 1.14B (-$172M) on revenues of CNY 4.5B ($677M). CHOT apparently bucked the trend of a slowdown in Q2; revenues were up 82% Q/Q but down 11% Y/Y. CHOT reported an operating loss of CNY 840M (-$127M), compared to an operating profit of CNY 2.14B in Q2’21 and an operating loss of CNY 644M in Q1’22. This was the third consecutive quarter of operating losses for CHOT and also the third consecutive quarter of net losses. EBITDA was a negative CNY 115M (-$17M) compared to a positive CNY 2.6B in Q2’21 and a positive CNY 81M in Q1’22.
CHOT’s gross margin got worse at -22%, and EBITDA margin was -3% in Q2’22. CHOT’s inventory decreased by 3% Q/Q but with higher revenues inventory days decreased from 54 to 28. CHOT debt increased by CNY 3B ($360M) while equity decreased. Debt/equity worsened from 62% to 78% and net debt/equity increased from 14% to 30%.
CHOT Income Statement and Margins
Tianma
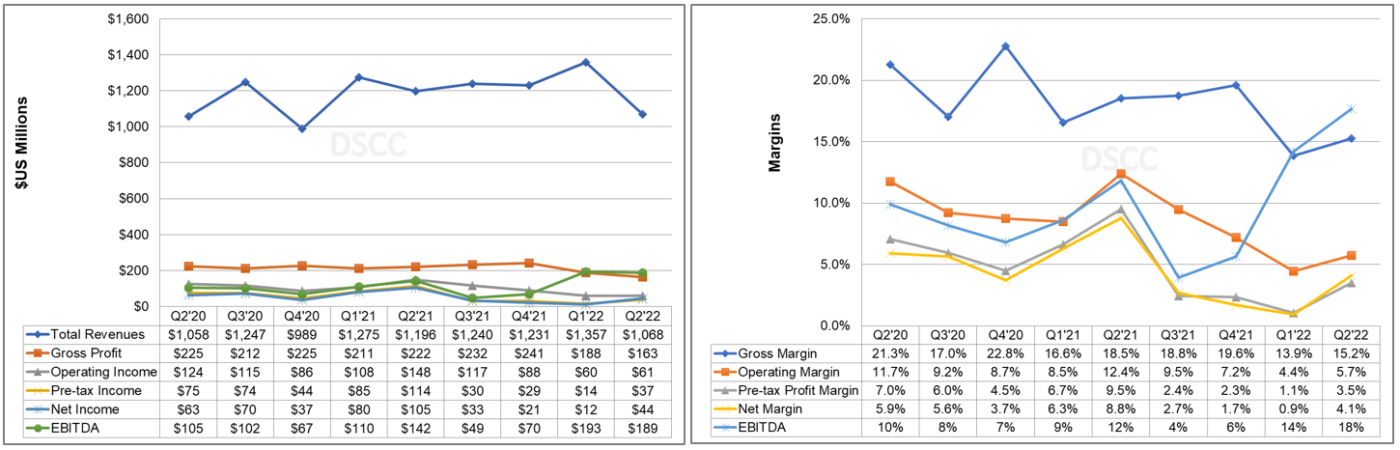
Tianma reported net profit of CNY 291 M ($44M) on revenues of CNY 7.07 billion ($1.07 billion). Revenues were down 21% Q/Q and 11% Y/Y. Tianma operating profit was CNY 404M ($61M), up 1% Q/Q but down 59% Y/Y.
Revenues, operating profit, net income and EBITDA all fell far short of consensus estimates. Revenue fell 11% short of consensus. EBITDA of CNY 1.25 B ($189M) was 12% lower than consensus of CNY 1.43 B and net income was 24% lower than consensus of CNY 291 M. Despite lower revenues, gross, operating, net and EBITDA margins all increased Q/Q by 1-4%.
Inventory increased by 31% Q/Q and with lower revenues inventory days increased from 43 to 71. Tianma debt increased by CNY 1B while equity increased slightly. Debt/equity worsened from 94% to 97% but net debt/equity decreased from 74% to 68%.
Tianma Income Statement and Margins
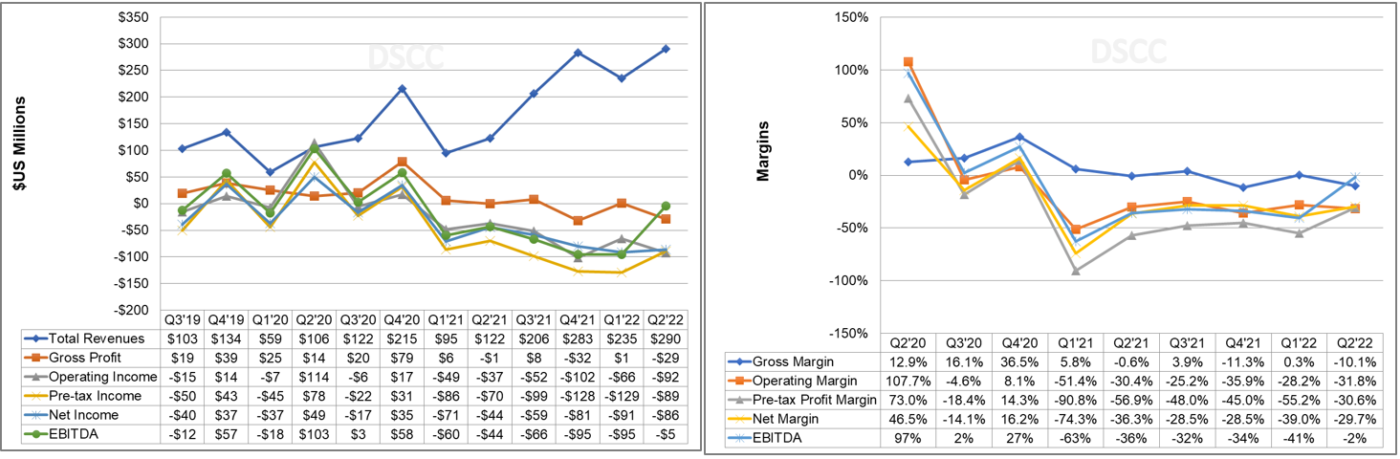
Visionox
Up through the most recent quarter, Visionox has been the only flat panel display maker with no LCD production. Starting in Q3’22, Samsung Display will join Visionox but while SDC earns healthy profits on its OLED panels, Visionox struggles to make money.
Visionox reported a net loss of CNY 570M (-$86M) on revenues of CNY 1.92B ($290M). Revenues were up 24% Q/Q and 138% Y/Y. Visionox reported an operating loss of CNY 610M (-$92M), compared to an operating loss of CNY 240M in Q2’21 and an operating loss of CNY 420M in Q1’22.
This was the sixth consecutive quarter of operating losses for Visionox and also the sixth consecutive quarter of net losses.
EBITDA was a negative CNY 30M (-$5M) but this was greatly improved from a negative CNY 281M in Q2’21 and a negative CNY 605M in Q1’22. Gross, operating, net and EBITDA margins were all negative, but EBITDA margin improved from -41% in Q1’22 to -2% in Q2’22.
Visionox inventory increased by 20% Q/Q but with higher revenues inventory days decreased from 68 to 57.
Visionox Income Statement and Margins