Q2'22のOLED出荷金額は前年比12%増
中段部和訳
DSCCが発行した Quarterly OLED Shipment Report (一部実データ付きサンプルをお送りします) の出荷速報版によると、Q2’22のFPDメーカー別のOLED出荷金額 (全アプリケーション) は、SDCがQ1’22同様のシェア64%を獲得、続くLGDもQ1’22同様のシェア18%だった。Q1’22に9%だったBOEのシェアは8%に下がった。SDCの場合、出荷枚数はスマートフォン用が前期比10%減となったが、モニター用は前期比133%増、タッチバー用が前期比51%増、ノートPC用が前期比19%増、そして車載アプリケーション向けが前期比で3桁成長を記録した。LGDの場合、出荷枚数はiPhone 13向けが前期比21%減、iPhone 13 Mini向けが前期比58%減となった結果、スマートフォン用は前期比31%減となった。TV用は前期比30%増となっている。BOEの場合、iPhone 13向けが前期比94%減、iPhone 12向けが前期比49%増となった結果、スマートフォン用は前期比26%減となった。
Q2’22のブランド別のスマートフォン用OLED調達枚数については、AppleがシェアをQ1’22の30%から 29%に下げた。これは季節要因による。続くSamsungもシェアをQ1’22の27%から23%に下げている。VivoはシェアをQ1’22の4%から5%に上げたが、これはS15シリーズ、X Note、X7 Lightを含むリジッドおよびフレキシブルOLEDスマートフォンの新モデルによる。Q2’22のフォームファクター別のスマートフォン用OLED出荷枚数については、リジッドタイプが前期比15%減、フレキシブルタイプが前期比10%減で、フォルダブルタイプが前期比19%増となっている。
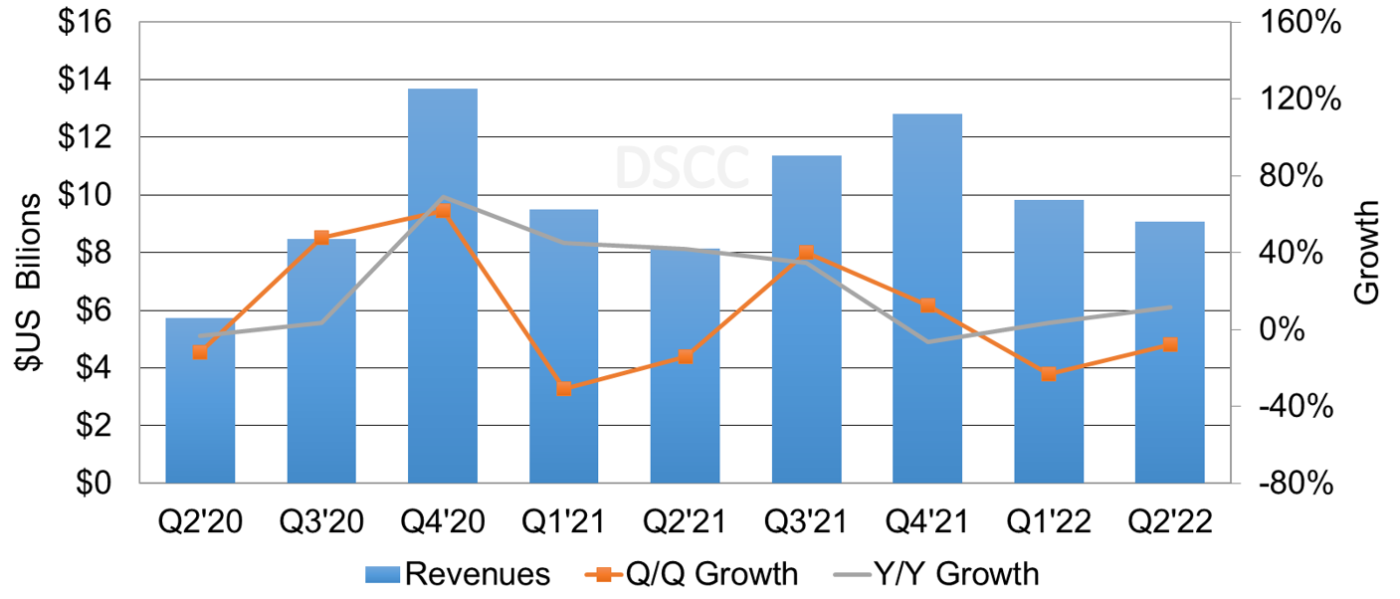
OLED Panel Revenues Increase 12% Y/Y in Q2’22
As revealed in DSCC’s latest release of the Quarterly OLED Shipment Report - Flash Edition (一部実データ付きサンプルをお送りします), OLED panel revenues increased 12% Y/Y on 3% Y/Y unit declines as a result of form factor mix changes for smartphones and Y/Y growth for automotive, game, notebook PCs, monitors, tablets and AR/VR in Q2’22.
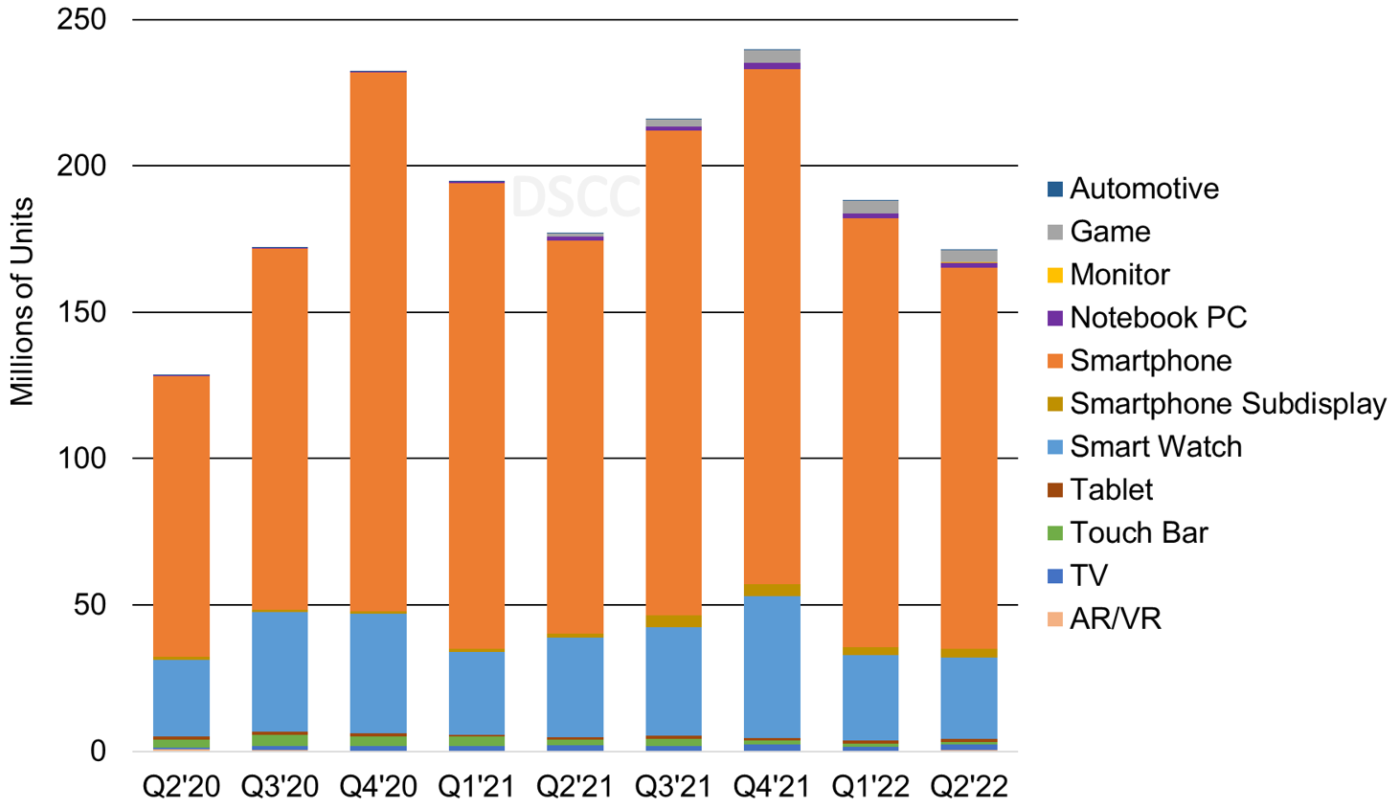
By OLED application:
- Automotive increased 55% Y/Y in units and 33% Y/Y in revenue;
- Game platforms increased 314% Y/Y in units and 302% Y/Y in revenue;
- Monitors increased 354% Y/Y in units and 142% Y/Y in revenue;
- Notebook PCs increased 22% Y/Y in units and decreased 4% Y/Y in revenue;
- Tablets increased 61% Y/Y in units and 65% Y/Y in revenue;
- Smartphones decreased 3% Y/Y in units and increased 17% Y/Y in revenue;
- Smartwatches decreased 19% Y/Y in units and decreased 11% Y/Y in revenue;
- TVs decreased 5% Y/Y in units and decreased 13% Y/Y in revenue.
AMOLED Panel Revenue and Y/Y Growth
In Q2’22, smartphones remained the largest OLED application with a 76% unit and revenue share, down from 78% and 80% respectively in Q1’22. OLED smartwatches had a 16% unit share and 6% revenue share similar to Q1’22. OLED TVs had a 1% unit share and a 11% revenue share (revenue share was 8% in Q1’22). This increase in revenue share was the result of triple-digit Q/Q unit growth for Sony and Panasonic OLED TVs. All other applications remained with single digit revenue share.
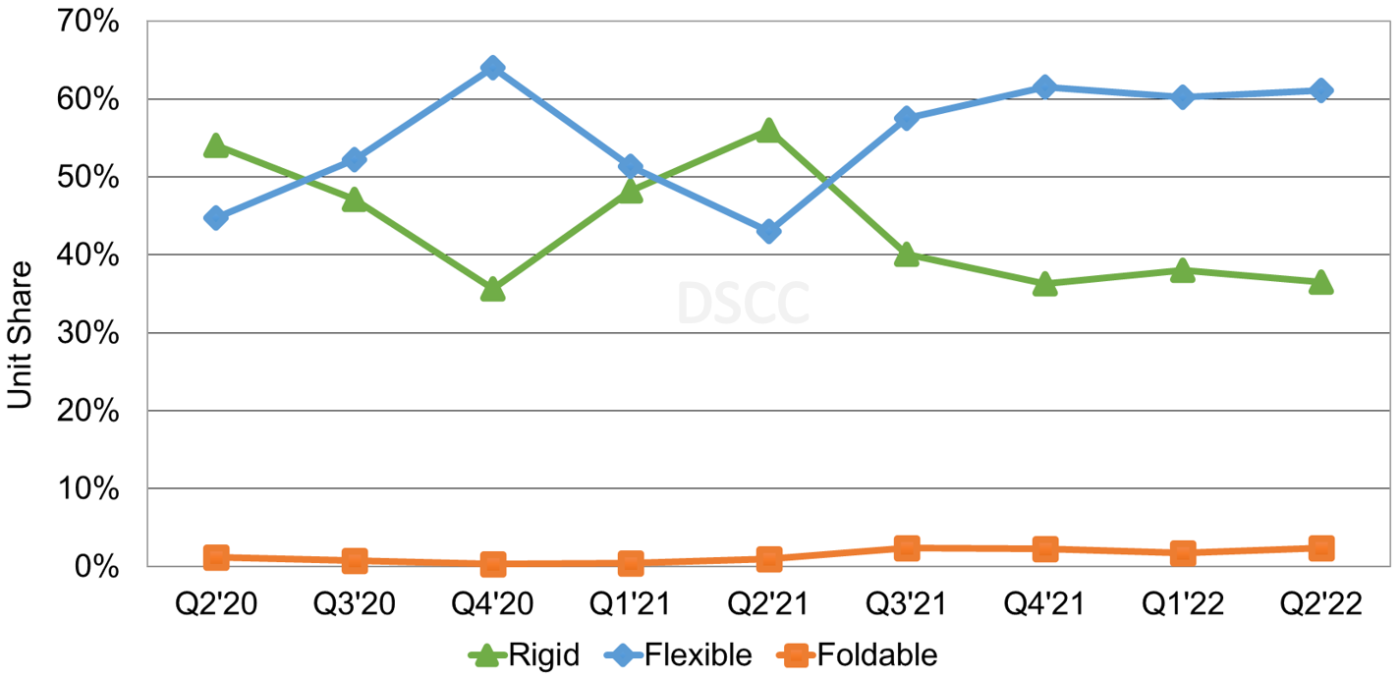
For OLED applications that had Y/Y growth, several brands launched new products in Q2’22 that helped lift those categories. For OLED monitors, LG launched the 48” CQ900 and C2 monitors and MSI launched a 34” QD-OLED monitor. For OLED notebook PCs, Asus launched several new OLED notebook PCs. Asus launched the 14” Predator Triton 300, 15.6” ConceptD 5 and 15.6” ConceptD 5 Pro. In addition to the new products, blended panel ASPs were higher in Q2’22 for smartphones, smartwatches, tablets and AR/VR applications. For smartphones, the higher ASPs were driven by form factor mix changes. In Q2’22, the form factor mix was 36% rigid (versus 56% in Q2’21), 61% flexible (versus 43% in Q2’21 and 2% foldable (versus 1% in Q2’21). As smartphone brands continue to focus on premium products and Honor and Huawei exit the rigid OLED smartphone category combined with the narrowing of the flexible vs. rigid OLED price gap in China, macroeconomic issues and the goal to maximize revenue, we expect rigid OLED smartphones to continue to lose share.
AMOLED Panel Shipments by Application
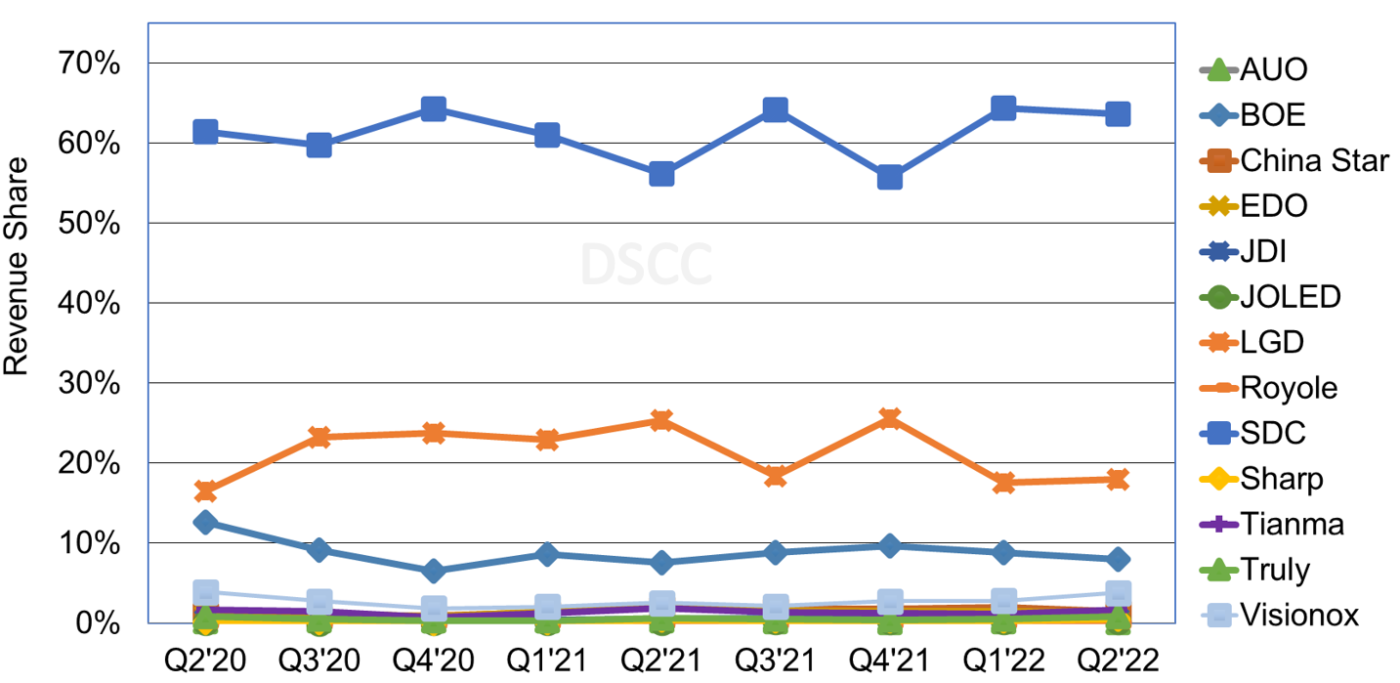
In Q2’22, for panel revenue by panel supplier for all OLED applications, SDC accounted for a 64% revenue share, similar to Q1’22, followed by LGD with 18% similar to Q1’22 and BOE with 8%, down from 9% in Q1’22. For SDC, although OLED smartphone units were down 10% Q/Q, OLED monitors were up 133% Q/Q, followed by touch bar with 51% Q/Q unit growth, 19% Q/Q unit growth for OLED notebook PCs and triple digit Q/Q unit growth for OLED automotive applications. For LGD, OLED smartphones units were down 31% Q/Q as a result of a 21% Q/Q decline for iPhone 13 and a 58% Q/Q decline for iPhone 13 Mini. OLED TVs were up 30% Q/Q. For BOE, OLED smartphones were down 26% Q/Q as a result of a 94% Q/Q decline for iPhone 13 and a 49% Q/Q increase for iPhone 12.
AMOLED Panel Revenue by Panel Supplier
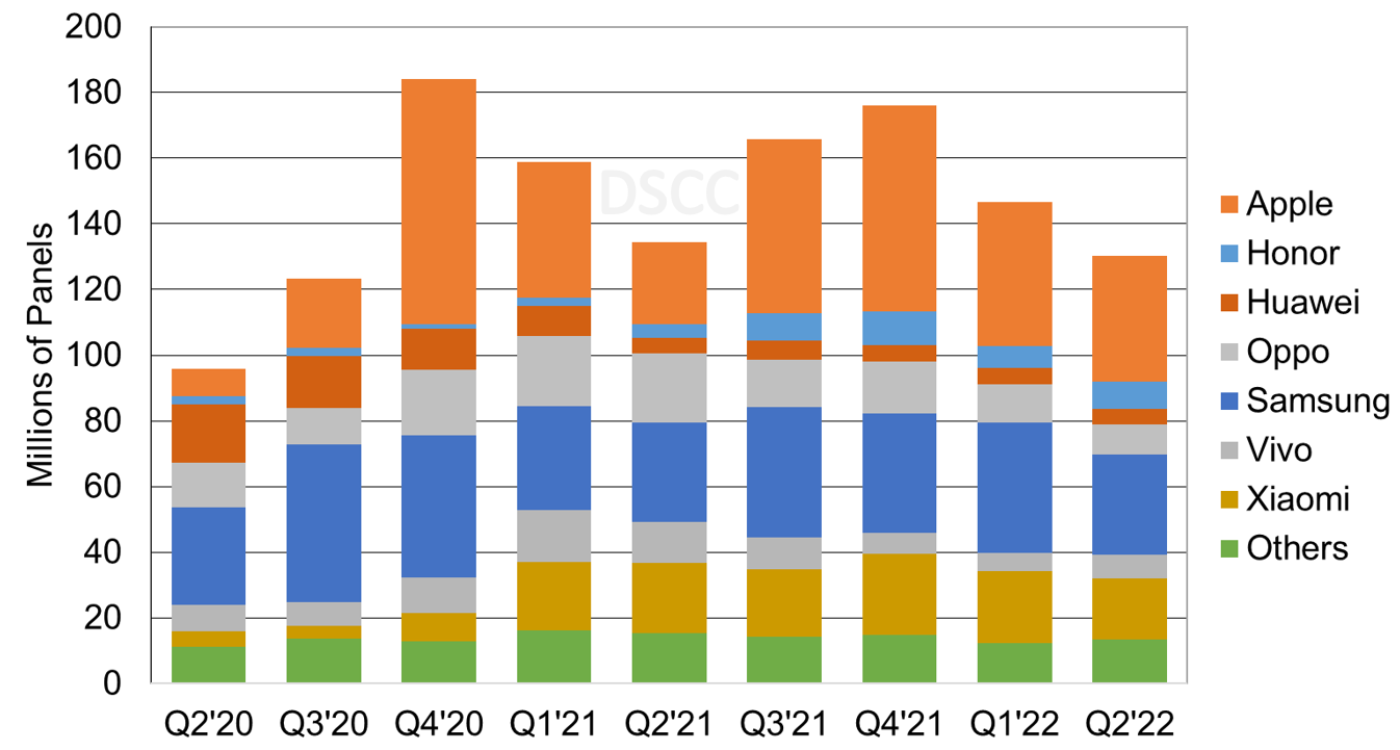
In Q2’22, for OLED smartphone panel procurement by brand, Apple’s share fell from 30% in Q1’22 to 29% in Q2’22 on seasonal weakness followed by Samsung with a 23% unit share, down from 27% in Q1’22. Vivo gained share to 5%, up from 4% in Q1’22 as a result of new rigid and flexible OLED smartphone models that included the S15 series, X Note, and X7 Light. In Q2’22, rigid OLED smartphones were down 15% Q/Q, while flexible OLED smartphones were down 10% Q/Q and foldable OLED smartphones were up 19% Q/Q.
AMOLED Smartphone Panel Shipments by Brand
AMOLED Smartphone Panel Shipments by Form Factor
DSCC’s long-term forecast for OLED units, revenues, area, panel supplier share, brand share, etc. will be available next month. For more information, please contact info@displaysupplychain.co.jp.
本記事の出典調査レポート
Quarterly OLED Shipment Report
一部実データ付きサンプルをご返送
ご案内手順
1) まずは「お問い合わせフォーム」経由のご連絡にて、ご紹介資料、国内販売価格、一部実データ付きサンプルをご返信します。2) その後、DSCCアジア代表・田村喜男アナリストによる「本レポートの強み~DSCC独自の分析手法とは」のご説明 (お電話またはWEB面談) の上、お客様のミッションやお悩みをお聞かせください。本レポートを主候補に、課題解決に向けた最適サービスをご提案させていただきます。 3) ご購入後も、掲載内容に関するご質問を国内お客様サポート窓口が承り、質疑応答ミーティングを通じた国内外アナリスト/コンサルタントとの積極的な交流をお手伝いします。