FPD出荷金額予測~2022年は20%減も2026年には1520億ドルに回復
冒頭部和訳
FPD出荷金額は、パンデミックがもたらした需要と価格上昇が弾みとなって2021年に急増したが、2022年には20%減少して地上に戻ろうとしている。しかし、FPDは依然として現代の暮らしにおいて重要な位置を占めており、出荷金額は今後数年間で成長軌道に戻り、2026年には1520億ドルまで成長すると予測される。DSCCが先週発行した Quarterly FPD Forecast Report (一部実データ付きサンプルをお送りします) に掲載の最新予測で明らかにしている。
Quarterly FPD Forecast Report はDSCCが来週発行予定の Quarterly FPD Supply/Demand Report (一部実データ付きサンプルをお送りします) の需要部分をカバーしている。 Quarterly FPD Forecast Report はFPD需要を対象としたレポートで、LCDとOLEDの2つの技術に分割される8つの異なるアプリケーション向けのFPD出荷を追跡している。同レポートでは、2018年から2026年までの全アプリケーションの出荷枚数、出荷面積、出荷金額の実績および予測データを四半期別に提供している。
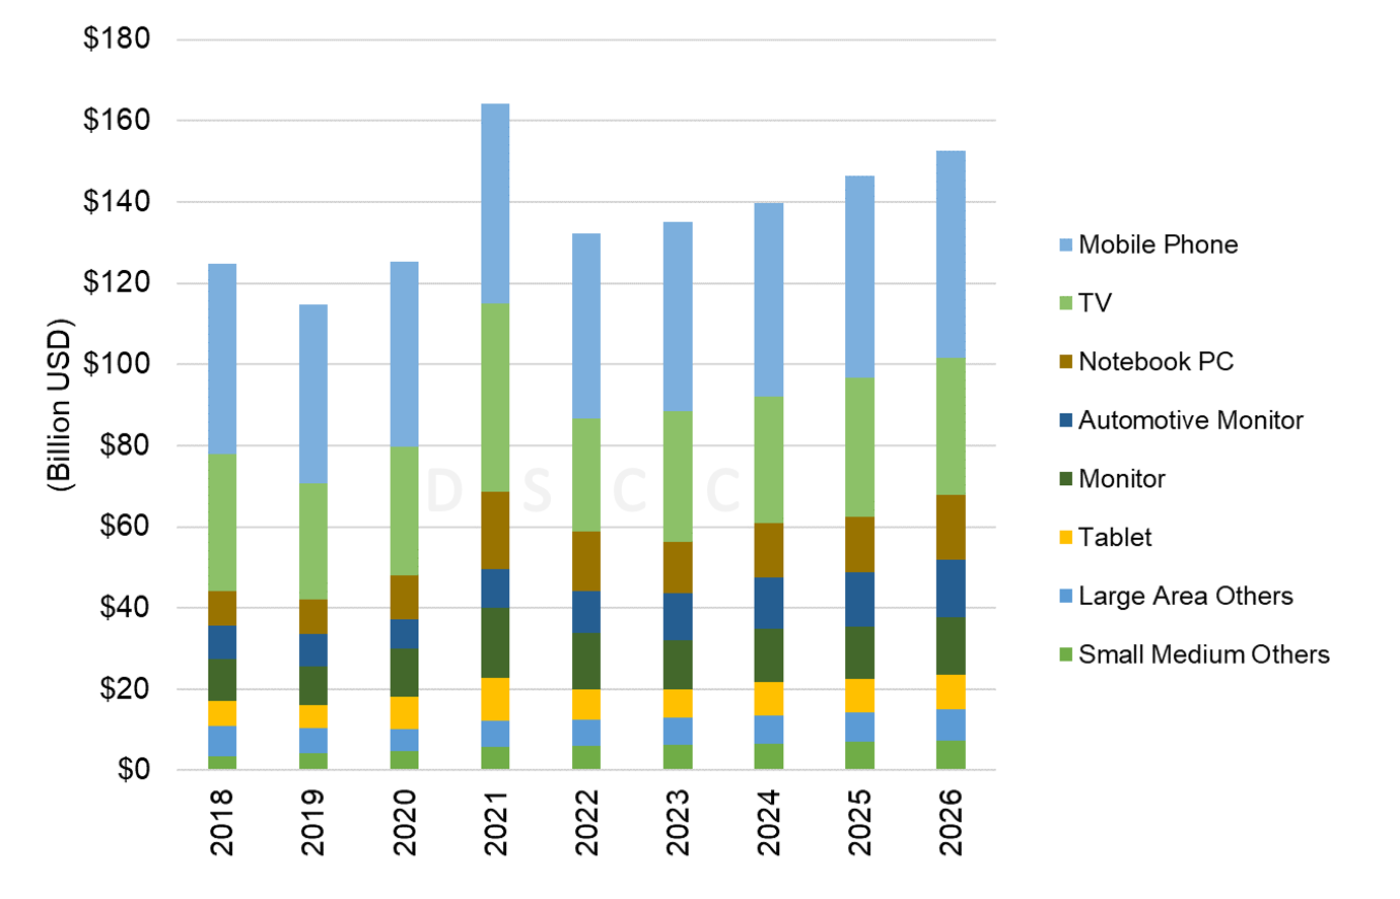
1つ目のグラフはアプリケーション別のFPD出荷金額予測を示している。総出荷金額は2018年から2019年にかけて減少した後、2020年には前年比9%増の1250億ドルとなり、力強い需要の継続とLCD価格上昇に後押しされ、2021年には31%増の1640億ドルに成長した。出荷金額が最も多いアプリケーションは依然として携帯電話 (スマートフォンと多機能携帯電話) だが、TV用LCD価格の急騰とTV用OLEDの販売増加が相まって、2021年にはTV用FPD出荷金額が46%増加した。今年のTV用FPD出荷金額は40% 減少の見通しで前年の裏返しとなるが、2026年には340億ドルまで徐々に成長すると予測される。
TVほど劇的な動きではないものの、IT アプリケーションも2020年から2021年にかけて増加した後、今年は減少すると見られる。それでも、OLED や MiniLED などのIT用先端技術FPDの成長により、タブレット、ノートPC、モニターのFPD出荷金額は今後増加する見通しだ。これらのアプリケーション向けの総出荷金額は、パンデミック前の2019年のわずか240億ドルに比べ、2026年には380億ドルに増加すると予測されている。
Flat Panel Display Revenues Falling 20% in 2022, but Revenues Will Recover to $152 Billion in 2026
After a revenue spike in 2021 spurred by pandemic-fed demand and rising prices, flat panel display revenues are returning to earth in 2022 with a decline of 20%. Revenues are expected to return to growth in the coming years as displays remain a critical part of the modern world, and will grow to $152B in 2026, according to DSCC’s latest update to the Quarterly Flat Panel Display Forecast Report (一部実データ付きサンプルをお送りします), released last week.
The FPD Display Forecast report covers the demand portion of Quarterly FPD Supply/Demand Report (一部実データ付きサンプルをお送りします), which will be updated next week. The forecast report addresses FPD demand, covering flat panel display shipments across eight different applications, with technology split between LCD and OLED. The report includes units, area and revenue history and forecasts for all applications with quarterly data from 2018 to 2026.
The first chart here shows our forecast for display revenues by application. After declining in 2018-2019, total revenues increased by 9% Y/Y in 2020 to $125B and jumped by 31% in 2021 to $164B driven by continuing strong demand and higher LCD panel prices. While Mobile Phones (smartphones plus feature phones) remain the application with the highest revenue, the spike in LCD TV panel prices combined with increasing OLED TV panel sales to drive TV flat panel revenues up by 46% in 2021. This year will see the flip side as TV panel revenues decrease by 40%, but we expect TV panel revenue to grow slowly to $34B in 2026.
IT applications saw a similar, if less dramatic, increase in 2020-2021 and decrease this year. Nevertheless, the increase in advanced IT panels including OLED and MiniLED will generate revenue growth in tablets, notebooks and monitors. We expect that combined revenue for these applications in 2026 will be $38B, compared to only $24B in pre-pandemic 2019.
Flat Panel Display Revenues by Application
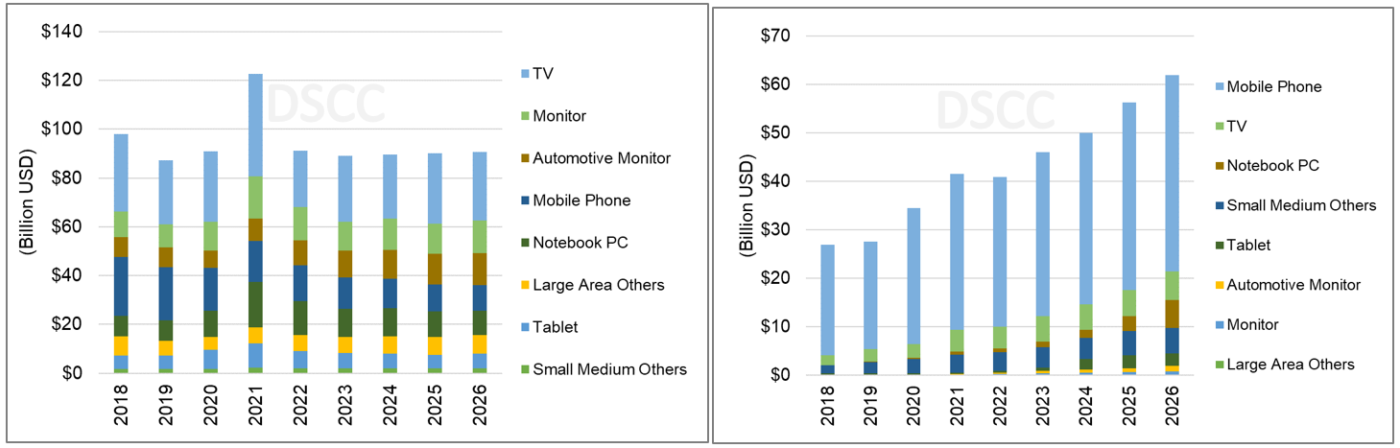
The next two charts here show our forecast of revenue by application for LCD and OLED. OLEDs will continue to gather an increasing percentage of display revenues, but the big increase in revenues in 2021 went to LCD. LCD panel revenues increased 35% in 2021 to $123B but are expected to decline by 26% in 2022 to $90B, and then to stabilize at close to the same revenue through 2026. OLED revenues saw a more modest 21% Y/Y increase in 2021 to $42B and are expected to edge down slightly by 1% in 2022 before resuming growth. The increasing penetration of OLED in smartphones, TVs, and other applications will allow OLED revenues to grow to $62B in 2026. While TV has been the largest application for LCD revenue, OLED revenue has been and will continue to be dominated by smartphones.
Flat Panel Display Revenues by Display Technology, LCD (L) and OLED (R)
While the revenue picture for the display industry shows a clear discontinuity from the pandemic, which has driven LCD panel prices up sharply, the forecast for units and area show less dramatic changes. Flat panel display units across all applications suffered a 9% decline in 2020, mainly because of a 9% decline in mobile phone panels, which make up more than half of the total. Unit shipments stabilized to increase 1% Y/Y to 3.42B units in 2021 but are expected to decline again in 2022 by 5%. We expect only modest unit growth in the longer term forecast to 3.6B units in 2026.
The following chart here shows our outlook on FPD area by application, which is dominated by TV and will continue to be so. We expect TV unit shipments to be close to flat, but area to continue to increase with increasing screen size. TV panel area grew by 6% in 2020 to 173M square meters and grew by another 4% in 2021. Even with reduced TV panel units in 2022 we expect larger screen sizes to enable 2% area growth this year. We expect TV area growth to continue in the mid-single digits % and expect total TV panel area to reach 232M square meters by 2026.
Flat Panel Display Area by Application
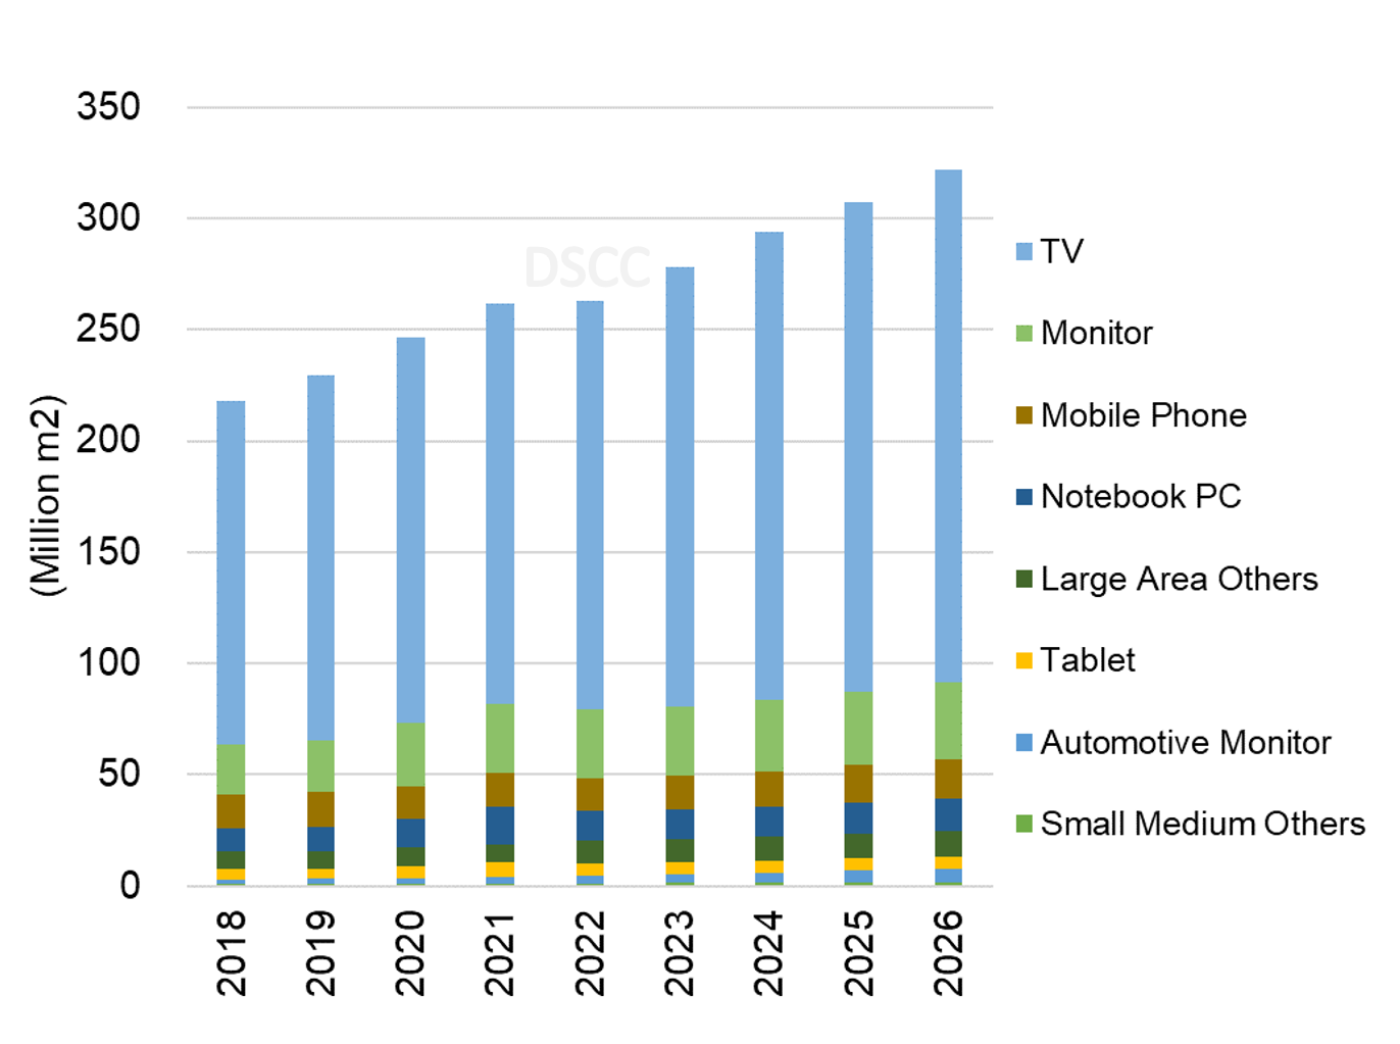
In the IT applications (monitor, notebook and tablet) display area grew by 23% in 2020 and by another 13% in 2021 but is expected to decrease by 8% in 2022. Some of the effects of the pandemic on remote working and learning are expected to be permanent and will lead to a permanent increase in IT panel demand, and we expect monitor area to continue to increase with larger screen sizes and IT panel area to continue to increase to 54M square meters in 2026.
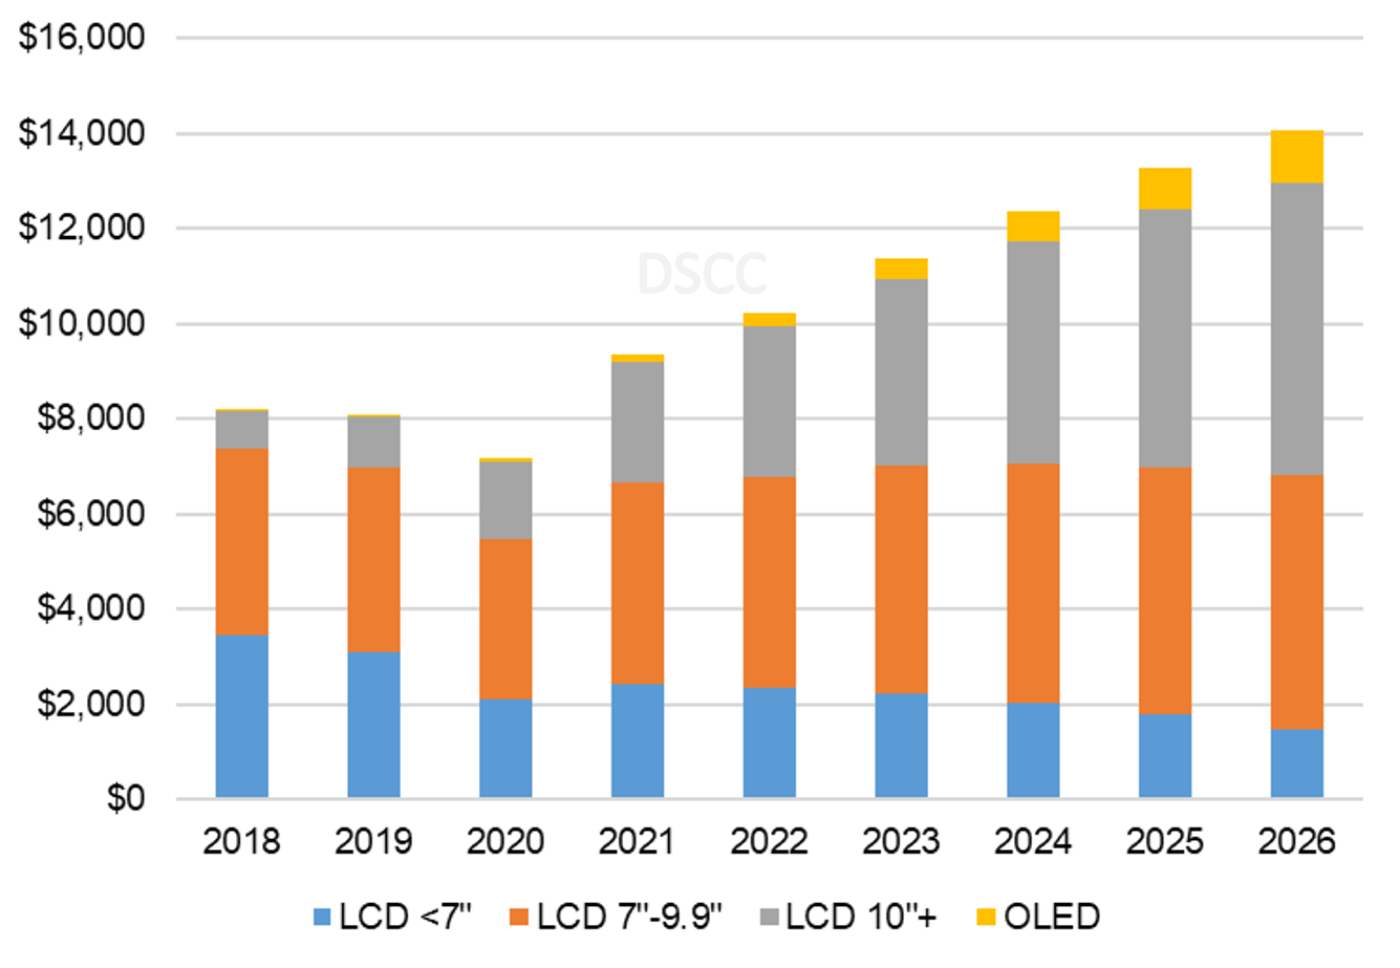
The report includes pivot tables to allow for more detailed analysis. An example is shown in the next chart here, demonstrating the promising growth of automotive displays. While auto display revenues fell 10% in 2020 with automotive production constrained by the semiconductor shortage, revenues rebounded with 30% growth in 2021 and are expected to grow with a 9% CAGR through 2026 to $14B. Three factors contribute to revenue growth in the automotive sector: increasing units, increasing screen size and increasing performance of premium displays.
Automotive Display Revenues by Technology and Screen Size
As noted above, Quarterly Flat Panel Display Forecast Report (一部実データ付きサンプルをお送りします) provides a comprehensive listing of historical panel shipments in LCD and OLED for eight different applications, plus a forecast of units, area, and revenues for each application. The report gives a complete perspective on flat panel demand for both LCD and OLED. Readers interested in subscribing to the Quarterly Flat Panel Display Forecast Report should contact info@displaysupplychain.com.
本記事の出典調査レポート
Quarterly Flat Panel Display Forecast Report
一部実データ付きサンプルをご返送
ご案内手順
1) まずは「お問い合わせフォーム」経由のご連絡にて、ご紹介資料、国内販売価格、一部実データ付きサンプルをご返信します。2) その後、DSCCアジア代表・田村喜男アナリストによる「本レポートの強み~DSCC独自の分析手法とは」のご説明 (お電話またはWEB面談) の上、お客様のミッションやお悩みをお聞かせください。本レポートを主候補に、課題解決に向けた最適サービスをご提案させていただきます。 3) ご購入後も、掲載内容に関するご質問を国内お客様サポート窓口が承り、質疑応答ミーティングを通じた国内外アナリスト/コンサルタントとの積極的な交流をお手伝いします。
