TV用LCD価格、第4四半期の回復展望は「L字型」
冒頭部和訳
TV用LCD価格は過去最安値を記録してからも下落を続けており、第3四半期に入って下落ペースは減速しているものの、第4四半期の回復は「L字型」になるとDSCCでは予測している。つまり、2023年まで回復の見通しは全くないということだ。継続的な供給過剰状態、ほぼ例外なく低迷している需要、サプライチェーン全体の過剰在庫、これらが重なった最悪の状況で、全ての画面サイズのTV用LCDがこれまでに過去最安値を記録している。生産ライン稼働率は7月に入って急激に下がったが、価格がすぐに上昇する可能性を示す兆候は見られない。
価格の下落ペースは第1四半期に減速、第2四半期には加速し、現在は再び減速している。FPDメーカー各社の第2四半期決算発表では、在庫が同四半期も引き続き増加したことが示唆されている。LG Displayの在庫日数は6月末時点で過去最高の81日を記録した。
以下の1つ目のグラフは最新のTV用LCD価格予測を示している。パンデミックによって2020年中盤から2021年中盤にかけて価格が急上昇したが、2021年秋には業界史上最も急速な価格下落が始まった。第2四半期には前月比ベースの平均価格下落率が毎月上昇し、3月の1.9%から6月には8.1%になった。第2四半期の平均価格下落率は13.1%だった。
LCD TV Panel Prices Headed for One “L” of a Recovery in Q4
LCD TV panel prices have reached all-time lows but they continue to decline, and although the pace of decline is slowing in the third quarter, we now forecast that the industry will have an “L-shaped” recovery in the fourth quarter. In other words, no recovery at all until 2023. The ‘perfect storm’ of a continued oversupply, near-universally weak demand and excessive inventory throughout the supply chain has combined, and every screen size of TV panel has reached an all-time low price. Although fab utilization has slowed sharply in July, we do not see any signal to suggest that prices can increase any time soon.
Price declines slowed in Q1 but accelerated in Q2 and are slowing again in the current quarter. The first indications from panel maker earnings reports for Q2 suggest that inventory continued to build in the quarter for panel makers. Inventory at LG Display increased to an all-time record of 81 days at the end of June.
The first chart here highlights our latest TV panel price update, showing the pandemic-fed surge from mid-2020 to mid-2021 and then the fastest price decreases in the industry starting in the autumn of 2021. The average M/M price decline increased each month during the second quarter, from 1.9% in March to 8.1% in June. The average price decline in Q2 was 13.1%.
LCD TV Panel Prices
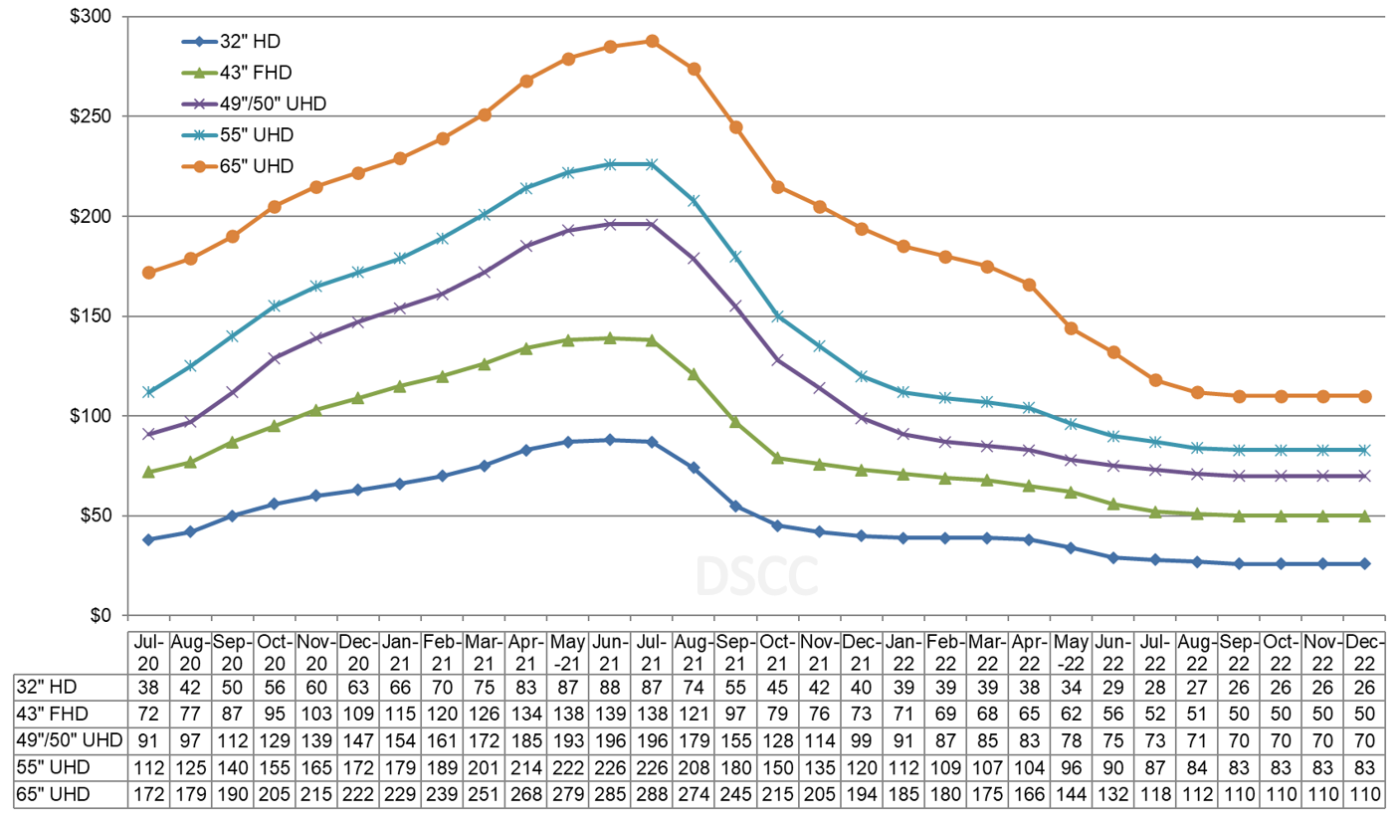
Prices for all screen sizes below 75” have now fallen below cash costs for most industry players. As a result, we have seen significant reductions in utilization in May, June and July. According to DSCC’s Quarterly All Display Fab Utilization Report, LCD industry utilization declined from 87% in April to 83% in May to 73% in June and 70% in July. Although the M/M price decline slowed to 4.8% in July and is expected to slow further in August and September, the damage of the sharp price drops in June will make the Q/Q drop more severe. We expect prices to fall by an average of 15.6% in Q3. These Q3 declines will bring prices even further below cash costs for commodity producers.
As we look at pricing on an area basis, the larger screen sizes made efficiently on Gen 10.5 fabs, 65” and 75”, long enjoyed a significant price premium over smaller sizes, but the price premium for 65” was eliminated in Q2. In January 2022, the area price for 65” panels was 14% higher than the area price for 43” panels. In June 2022, that premium dropped to zero.
Monthly Area Prices per Square Meter for TV Panels
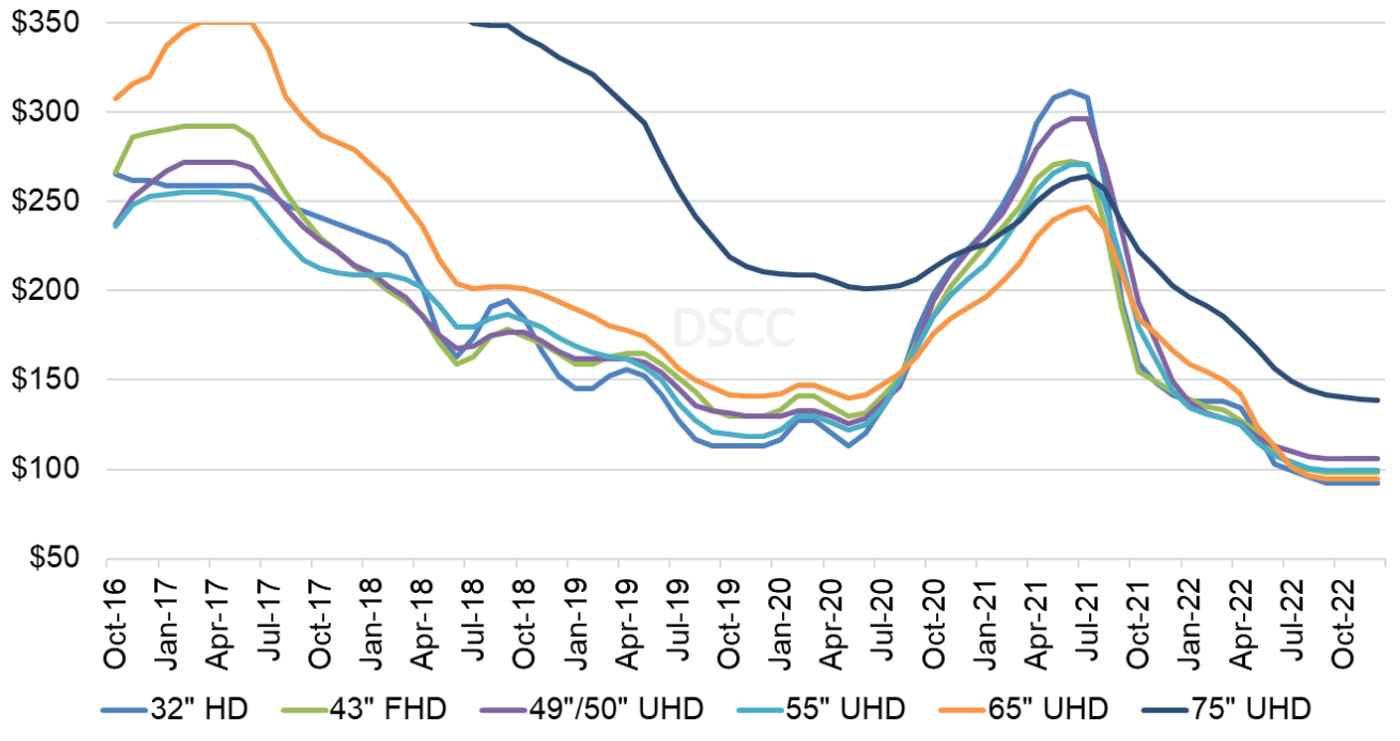
In July, area prices for all screen sizes up to 65” fell in a range from $99 to $110 per square meter. In August we expect that 65” area price will be even with 32” area price, the lowest in the industry at $96 per square meter. The largest screen size in our survey, 75” panels, continues to have a premium of $48 or 50% over the benchmark 32”, and this premium has remained roughly stable in the last six months, but that just means that 75” panel prices have been falling as fast as other panel sizes.
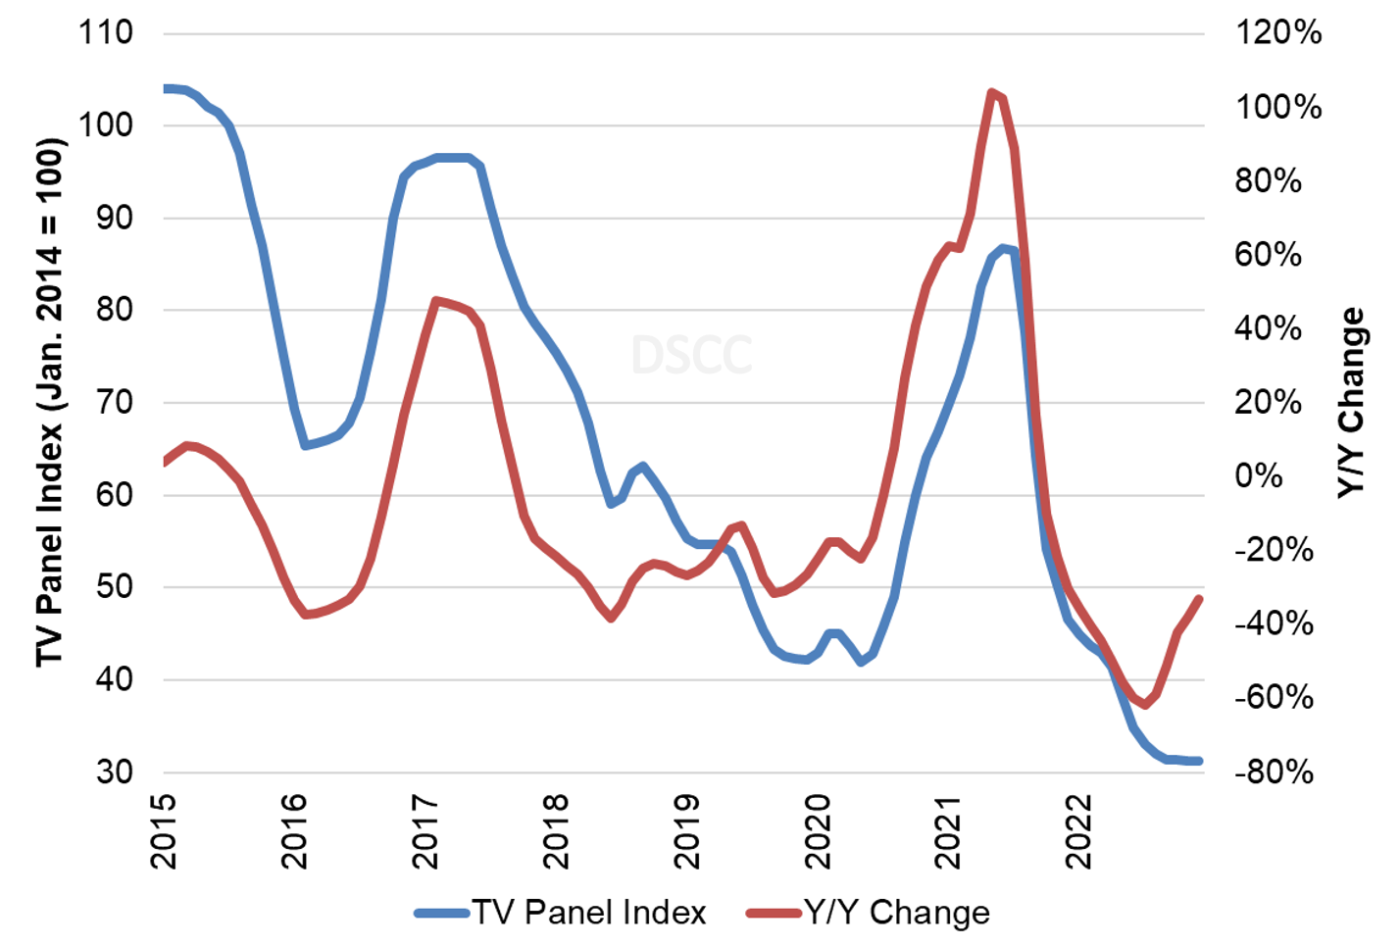
The last chart here shows our TV panel price index, set to 100 for prices in January 2014, and the Y/Y change of LCD TV panel prices. Our index increased from its all-time low of 42 in May 2020 to 87 in June 2021, but prices hit a new all-time low at 41.4 in April and have declined further to 33.1 in July. We now expect the index to continue to decline to 31.3 by December, 64% lower than the peak in June 2021.
TV Panel Price Index and Y/Y Change
As we expected, the lower panel prices and soft demand has led to reduced operating margins for panel makers, based on the first two companies to report Q2 earnings, LGD and AUO (see separate articles). With prices continuing to fall we expect Q3 will be even worse.
Some information from Q2 earnings reports suggests that the problem of excess inventory was even bigger at the end of Q2 than it was after Q1. LG Display inventory increased by more than $200 million and inventory days ballooned from 68 to 81 in the second quarter. The inventory for Samsung Electronics increased by almost $2B despite that company’s call to halt purchases in mid-June. Samsung’s inventory days increased from 94 to 102 during the period. US retailer Best Buy gave a profit warning and said that it expects same-store sales to decline by 13% Y/Y, and its purchases would be reduced by 20% compared to a year ago.
For many reasons we have described in the last few months, the current oversupply is unlikely to be resolved by an increase in demand, it can only be reversed by a decrease in supply. This has started in Q2 and has accelerated in Q3. That is the first step toward stabilizing the supply/demand balance. Over the decades of the flat panel display industry, we have seen the Crystal Cycle turn many times, and we expect that eventually low prices will drive a combination of reduced supply and increased demand. Unfortunately for flat panel display makers, that point does not appear imminent.
