第3四半期はFPD生産ライン稼働率が急落~供給過剰でメーカーは在庫制御に腐心
[田村喜男] 本記事の解説動画を進呈します [8月特別企画]
DSCC Japanのメルマガ読者様 (ご登録はこちらから) 向け企画として、アジア代表・田村喜男が本記事を詳細解説した動画 (約20分間※再生速度変更可) を無料提供します。ご希望者様はご所属情報をご明記の上、info@displaysupplychain.co.jp 宛に「稼働率動画希望」とメールしてください。翌日中に動画URLをメール返信します。ご応募をお待ちしています。
冒頭部和訳
DSCCが先週発行した Quarterly All Display Fab Utilization Report (一部実データ付きサンプルをお送りします) 最新版によると、今年初めに予測されていたFPD生産ライン稼働率の低下は今や本格化しており、当初予測よりもさらに深刻であることが明らかになった。FPD価格は丸1年間下がり続けてもその終わりが見えず、FPDサプライチェーン全体で過剰在庫が積み上げられた結果、FPDメーカー各社は第2四半期に稼働率を下げ始め、第3四半期には稼働率低下に拍車がかかった。FPDメーカー全社の合計TFT投入量はQ2’22に前期比6%減・前年比2%減の8280万㎡となったが、現四半期であるQ3’22には前期比11%減・前年比15%減とさらに減少し7400万㎡となる見通しだ。
本レポートには、業界のすべてのFPD生産ライン (全部で100以上) の月間生産能力、TFT基板投入量、生産ライン稼働率の詳細データを収録しており、併せて提供のExcelデータベースには、FPDメーカー、国、TFT世代、バックプレーン、フロントプレーン、基板タイプの項目別に表示可能なピボットテーブルが含まれている。レポートには、Q1’19以降の実績と2022年通年の月別予測の稼働率データを収録している。
2020年上半期のCOVID-19による減速の後、生産ライン稼働率は台湾と中国で特に高かったことが、以下の1つ目のグラフに示されている。Q4’21に減速が一旦落ち着いた後、Q1’22には全世界の稼働率が87%に上昇したが、同時にマクロ経済的および地政学的ショックによって需要が急落した。稼働率は第2四半期に7%低下、Q3’22にもさらに7%低下して73%となった。これは、2008年から2009年の金融危機以来の最も低い値である。
Sharp Slowdown in Display Fab Utilization in Q3 as Panel Makers Try to Control Inventory Amid Display Panel Glut
The slowdown in display fab utilization that we predicted earlier this year is now in full swing and even more severe than we expected, according to the latest release of DSCC’s Quarterly All Display Fab Utilization Report (一部実データ付きサンプルをお送りします) issued last week. After a full year of panel prices falling with no end in sight, and after the entire display supply chain built excessive inventory, panel makers started to reduce utilization in Q2 and the slowdown has accelerated in Q3. In Q2’22, total TFT input for all display makers was down 6% Q/Q and down 2% Y/Y at 82.8M square meters, and in the current Q3’22 we expect total TFT input to be down another 11% Q/Q and 15% Y/Y to 74.0M square meters.
The report details monthly capacity, TFT input, and utilization for every flat panel display fab in the industry, more than 100 fabs in all, and includes pivot tables to allow segmentation by the supplier, country, TFT fab generation, backplane, frontplane or substrate type. The report provides historical utilization back to Q1’19 and a forecast by month for the full year 2022.
After a COVID-19 induced slowdown in the first half of 2020, fab utilization has been particularly strong in Taiwan and China, as shown in the first chart here. After an aborted slowdown in Q4’21, worldwide utilization in Q1’22 increased to 87% at the same time that macroeconomic and geopolitical shocks caused demand to plunge. Utilization fell 7% in Q2 and is falling another 7% in Q3’22 to 73%, the lowest point since the financial crisis of 2008-2009.
TFT Quarterly Fab Utilization by Region
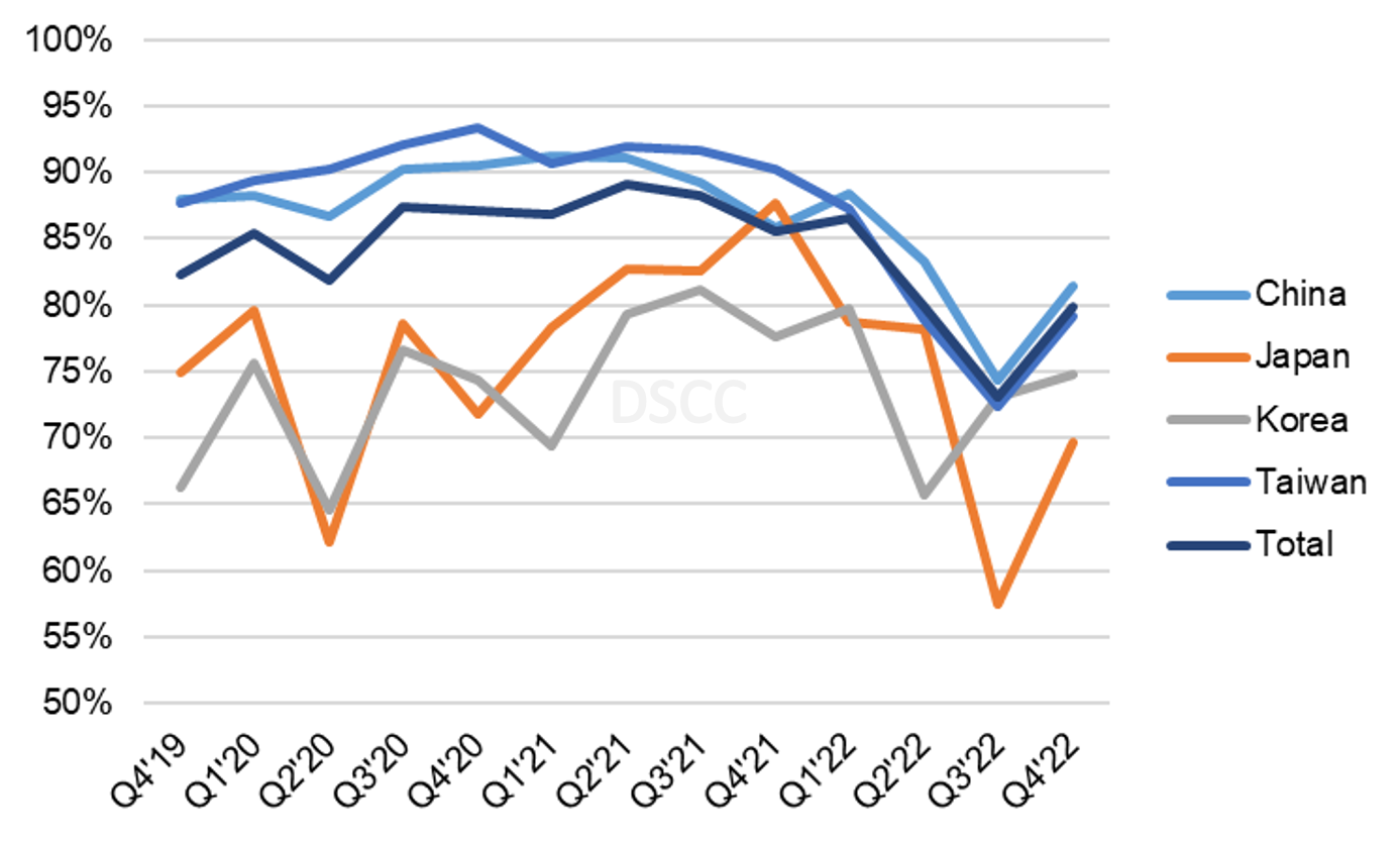
As shown in the chart, the slowdown is broad-based across China, Taiwan and Japan but Korea utilization is increasing. Korea has a dramatically higher share of its capacity as OLED, while all other regions are dominated by LCD. In Q3’22, 45% of Korea capacity produces OLED panels, while the percentage of OLED in China is only 5% and it is negligible in all other regions. While OLED is not immune to the general market downturn in both TVs and smartphones and has lower utilization in 2022 as a result, the seasonality of OLED smartphone sales remains a dominant attribute in the market. In addition, SDC’s utilization increase to supply the iPhone 14 series launch explains the Q3 utilization increase in Korea.
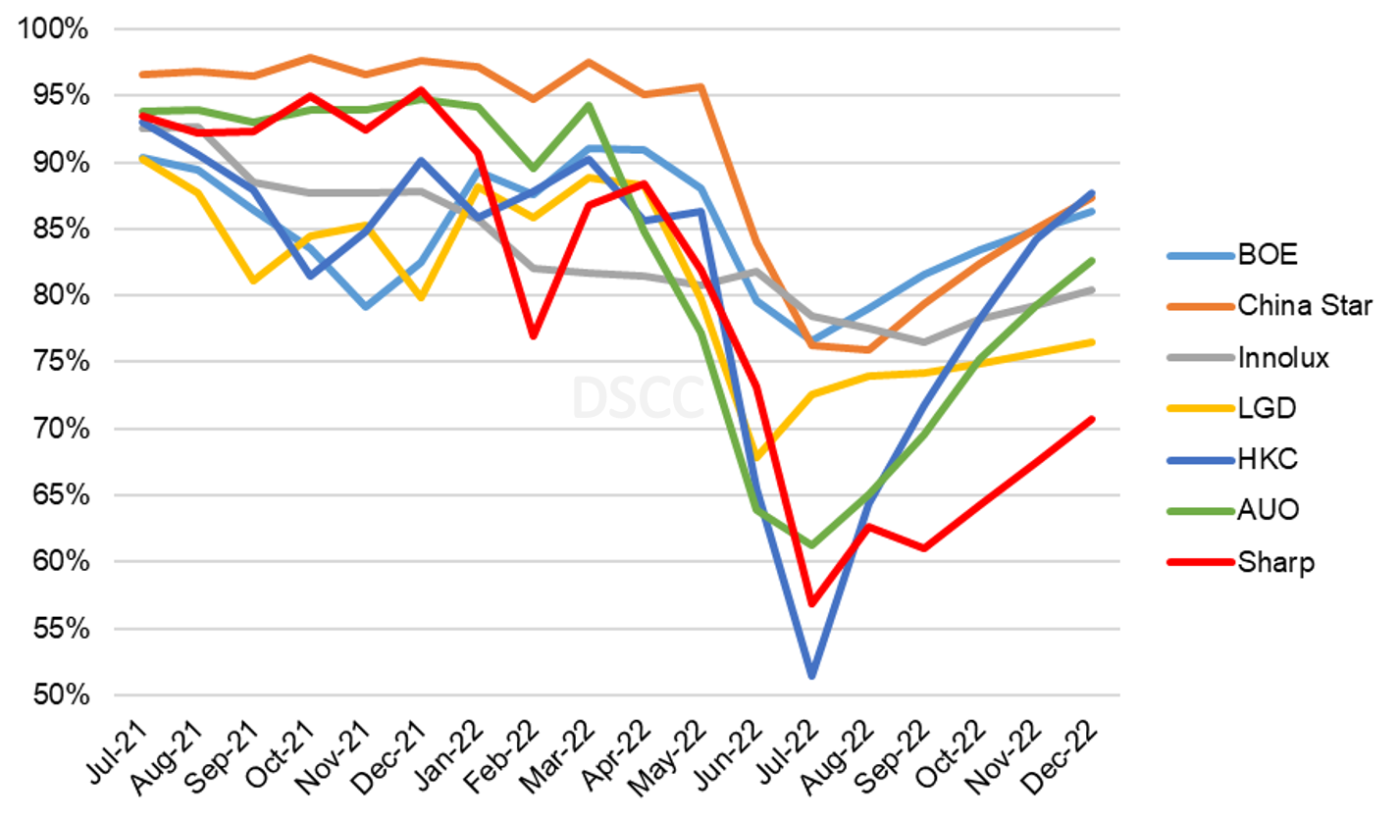
Looking more closely at LCD, a view of utilization by manufacturer by month shows the dramatic slowdown in June and July for each of the top seven LCD makers, which have a combined 90% of the industry’s LCD capacity. The downturn appears particularly painful for HKC which has two Gen 8.6 fabs which are ramping, H4 in Mianyang and H5 in Hunan. These two fabs have increased input by more than 1.7M square meters from Q2’21 to Q2’22, more than offsetting utilization declines elsewhere, and because they are ramping and HKC is expected to target an initial public offering the company has a strong incentive to maintain production. HKC has attempted to maintain high utilization as it prepares for an IPO, but with major TV vendors such as Samsung stopping orders, they have been forced to slow down dramatically. Similarly, Sharp (which in our report includes Sakai Display Products and SIO) has an overabundance of capacity for large TVs and faces a sustained slowdown for the rest of the year.
TFT LCD Monthly Fab Utilization by Manufacturer
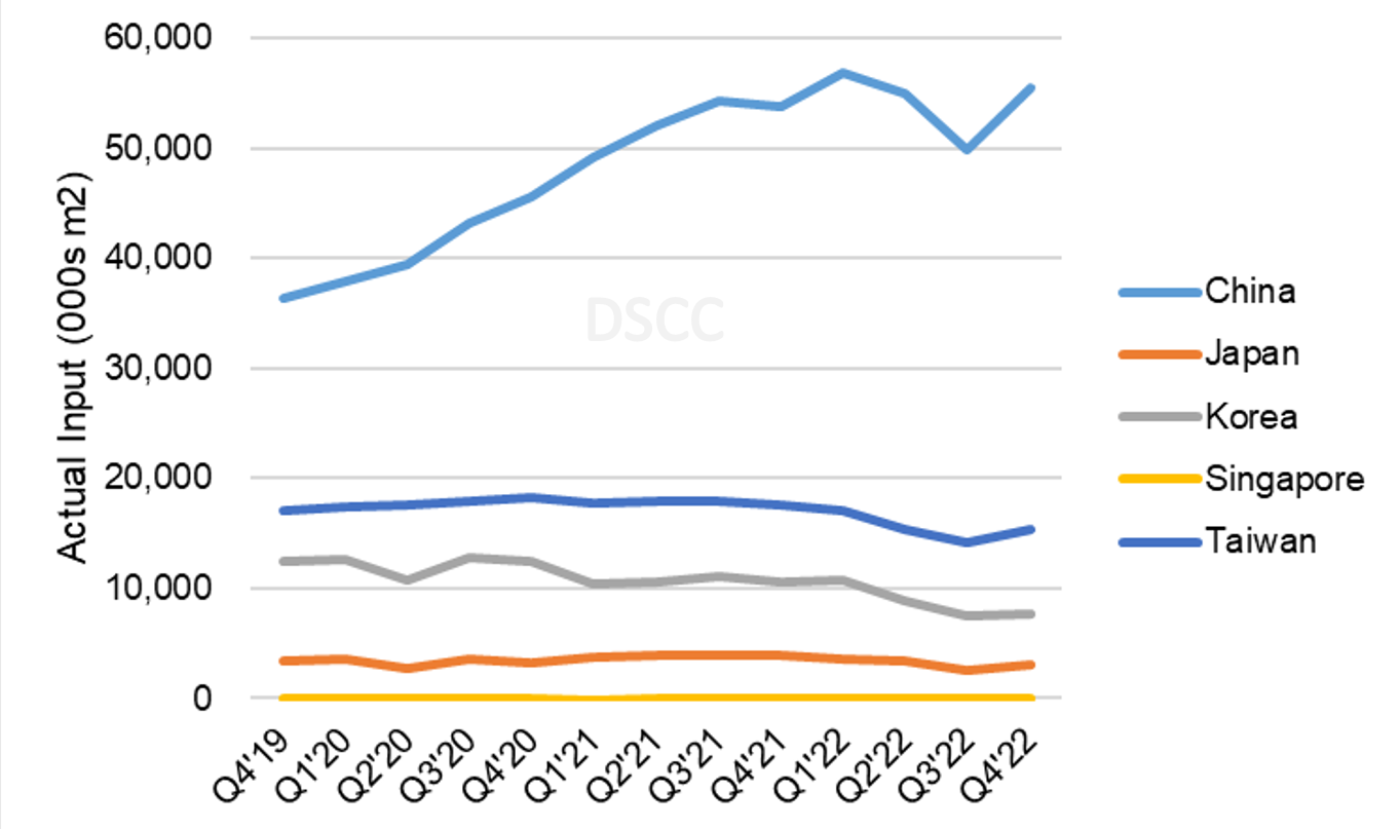
Returning to the total display industry including both LCD and OLED, a view of TFT input by region shows the extent that China has grown to dominate the industry during the pandemic. Even with the dramatic slowdown in Q3’22, China TFT input will be 25% higher than in Q2’20. As recently as Q1’18, China represented only 39% of total industry TFT input on an area basis, but by Q3’19, China was larger than all other regions combined, and China will represent 67% of the total industry in the current quarter.
Quarterly TFT Input by Region
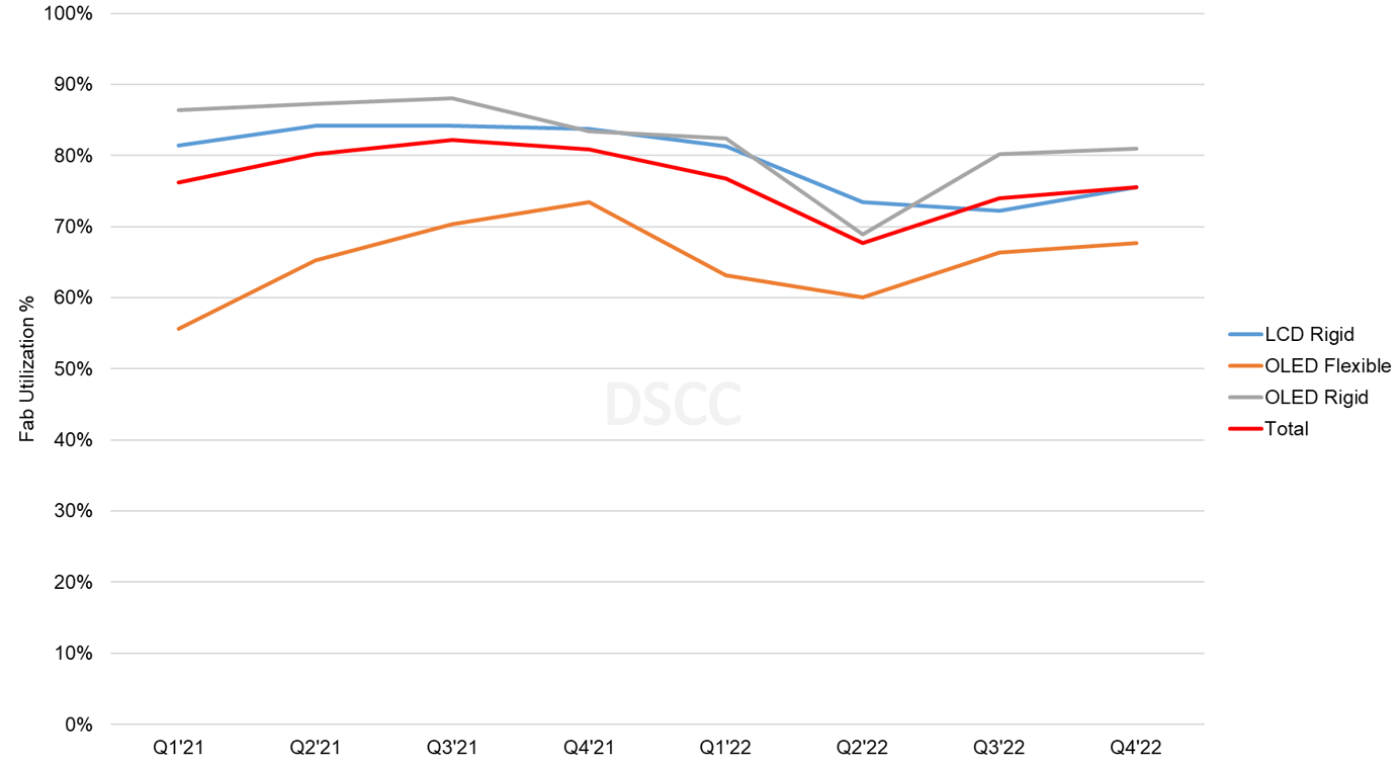
The Quarterly All Display Fab Utilization Report, as its name implies, covers every display technology and application, but a separate DSCC report, the Quarterly OLED and Mobile/IT Fab Utilization Report, also updated last week, provides a more narrow focus on OLED and LTPS LCD. The next chart here shows a view of utilization for LTPS LCD and OLED with Rigid and Flexible substrates. Although the slowdown in these categories is less severe than in the large-screen LCD sector, utilization has been lower in 2022 than in 2021, and the rigid OLED has faced a slowdown in Q2 in both smartphone and TV categories. Flexible OLED continues to struggle with overcapacity, especially in China, and the LTPS LCD sector has struggled with the general slowdown in the smartphone market.
Quarterly TFT Utilization by Display Technology and Substrate
The industry’s capacity increases, which were a response to the unprecedented surge in demand during the pandemic, have now led to an oversupply which has brought panel prices down precipitously to below cash costs. The excess inventory in the display supply chain, coupled with weak demand, will continue to put downward pricing pressure on display panels.
DSCC’s Quarterly All Display Fab Utilization Report (一部実データ付きサンプルをお送りします) covers capacity, TFT Input and utilization by month for every flat panel display fab in the industry, with pivot tables to allow segmentation by supplier, country, TFT fab generation, backplane, frontplane or substrate type. The report provides historical utilization back to Q1’19 and a forecast by month for 2022. DSCC Weekly Review readers interested in subscribing to the Quarterly All Display Fab Utilization Report should contact info@displaysupplychain.com.
本記事の出典調査レポート
Quarterly All Display Fab Utilization Report
一部実データ付きサンプルをご返送
ご案内手順
1) まずは「お問い合わせフォーム」経由のご連絡にて、ご紹介資料、国内販売価格、一部実データ付きサンプルをご返信します。2) その後、DSCCアジア代表・田村喜男アナリストによる「本レポートの強み~DSCC独自の分析手法とは」のご説明 (お電話またはWEB面談) の上、お客様のミッションやお悩みをお聞かせください。本レポートを主候補に、課題解決に向けた最適サービスをご提案させていただきます。 3) ご購入後も、掲載内容に関するご質問を国内お客様サポート窓口が承り、質疑応答ミーティングを通じた国内外アナリスト/コンサルタントとの積極的な交流をお手伝いします。
