SID/DSCC 2022ハイライト~基調講演
冒頭部和訳Bob O’Brien, DSCC
コロナ禍が著しい需要を引き込んだ一方で、供給が制限されたことで、価格が高騰し、異例なほどの高い成長につながった。2021年のFPD出荷金額は前年比31%増の1640億ドルを記録した。これは在宅勤務と在宅学習による強力な需要がもたらしたもので、ノートPCは2019年から2021年にかけて約1億台増加している。2020年と2021年上半期には、需要の伸びが供給の伸びを上回ったことから、稼働率は上昇傾向にあった。LCD機器支出は2020年に26%減少し、これが供給の伸びを鈍化させた。コンポーネント不足がなければ稼働率はもっと高かっただろう。需給が逼迫しドライバーIC不足が続く中、FPDメーカーとブランドが利益率の高い製品に重点を置いたことでFPDの利益率がさらに押し上げられた。FPD価格が横ばいになり始めた2021年4月まで、FPD株は他の多くの指数をアウトパフォームした。
2020年から2021年にかけて、モニター、ノートPC、スマートウォッチ、タブレット、TVの5セグメントで2桁の高い収益成長が見られた。ITの出荷金額シェアは、出荷台数の強力な成長、価格の上昇、MiniLEDの採用によって、2010年の20%から2021年には29%に急拡大した。TVは価格の上昇と出荷面積の成長によってシェアが25%から28%に上昇した。携帯電話のシェアは38%から30%に低下したが、セグメント別では依然としてトップである。FPD平均対角サイズは2019年から2021年にかけて7%増の11.0インチとなっており、モニターは5%増の25インチ、TVは8%増の47インチとなっている。面積ベースではTVが2021年にシェア69%を獲得、他を圧倒するセグメントである状況は変わらない。
LCDは価格が高騰したことで2021年には35%の成長率を記録、成長率が20%だったOLEDを上回った結果、FPD市場におけるLCDのシェアは75%に拡大した。MiniLEDのシェアは2021年に2%に上昇した。
Keynote Session Summary - Bad Year for Display Financials, But Display Performance Continues to Improve
In my talk, I focused on the following topics:
- How COVID-19 Affected the Display Market
- 2022 Outlook
- How Display Technologies Are Evolving
- Display Market Outlook
COVID-19 pulled in significant demand while at the same time supply was constrained leading to much higher prices and unusually high growth. Display revenues rose 31% Y/Y in 2021 to a record $164B. This was achieved due to strong demand from work from home (WFH) and learn from home (LFH) with notebooks rising around 100M units from 2019 to 2021. Utilization trended upward in 2020 and 1H’21, as demand growth outpaced supply growth. LCD equipment spending was down 26% in 2020, which led to the slower supply growth. Utilization would have been even higher without component shortages. With supply/demand tight and driver IC shortages persisting, panel manufacturers and brands focused on higher margin products, further boosting display margins. Display stocks outperformed many other indexes until April 2021 when panel prices began to level off.
In 2020 and 2021, there was high double-digit revenue growth in five different segments – monitors, notebook PCs, smart watches, tablets and TVs. The IT panel revenue share surged from 20% in 2010 to 29% in 2021 on strong unit growth, price increases and MiniLED adoption. TVs rose from a 25% to a 28% share on price increases and area growth. Mobile phones fell from 38% to 30% but remained the largest segment. The average display diagonal rose by 7% from 2019 to 2021 to 11.0” with monitors up 5% to 25” and TV diagonals rising 8% to 47”. TVs remained the dominant segment on an area basis with a 69% share in 2021.
The surge in LCD prices enabled LCDs to outgrow OLEDs in 2021 with a 35% to 20% advantage with LCDs boosting their share to 75% of the display market. MiniLEDs rose to a 2% share in 2021.
BOE became the top panel supplier in revenues with a 19.1% share on 73% growth. SDC fell to #2 but LGD significantly narrowed the gap. SDC remained dominant in OLEDs with a 59% share, down from 65%, with LGD at #2 at 23%. Chinese suppliers still account for less than 20% share despite massive capex. In LCDs, there was double-digit growth for the top eight suppliers. BOE’s advantage rose from two points to nine points on its capacity expansions and well-timed CEC Panda acquisition. LG Display remained #2 followed by AUO, Innolux and China Star. Operating margins, stock prices by supplier and our panel supplier stock index were also shown.
In the 2H of 2021, the higher prices and earlier pull-in of demand caused demand to fall in TVs, tablets and mobile phones. TV retail prices were even higher Y/Y for the first time. In addition, with significant investments in new supply, the shortage turned into a surplus with manufacturers also stretching their capacity and delaying shutdowns in Korea. There was double-digit Y/Y capacity growth every quarter of 2021 reversing the sharp price increases and resulting in sharp price reductions. While prices increased as much as 172% in 2020 and 1H’21, they fell as much as 54% in 2H’21 and haven’t stopped falling yet.
Unlike most industries which have seen price increases rise on inflation, supply disruptions and shortages, display prices are still falling in 2022 due to a lot of new LCD capacity coming online and slower than expected demand growth. Demand is not responding to lower panel prices for numerous reasons such as:
- Higher inflation from COVID-related fiscal and monetary stimulus;
- Russia-Ukraine war impacting demand and sanctions against Russia worsening inflation on higher energy and food prices;
- Extended COVID-19 shutdowns in China - impacting supply chains and demand and potentially inflation;
- Saturation in consumer IT and TV purchases;
- Less discretionary spending due to higher oil prices, transportation costs, food prices, housing prices, costs of capital, etc.;
- Governments raising rates and trying to slow down demand;
- Consumer spend shifting from hardware to services.
At the same time, display suppliers are experiencing cost increases due to:
- Rising energy prices impacting transportation/shipping costs;
- Certain material prices being impacted by rising oil prices - PI, CPI, PET, etc.;
- Neon gas used for ELA and LLO, ~30% of production in Ukraine, especially Mariupol (Ingas) which has been hit hard.
Demand is being impacted around the world this year with global GDP being cut from 4.9% to 3.6%, US GDP growth cut from 5.2% to 3.7%, EU cut from 4.3% to 2.8%, Japan cut from 3.2% to 2.4% and China cut from 4.8% to 4.4% per the IMF. As the IMF said, there is unusually higher uncertainty surrounding forecasts this year with downside risks dominating.
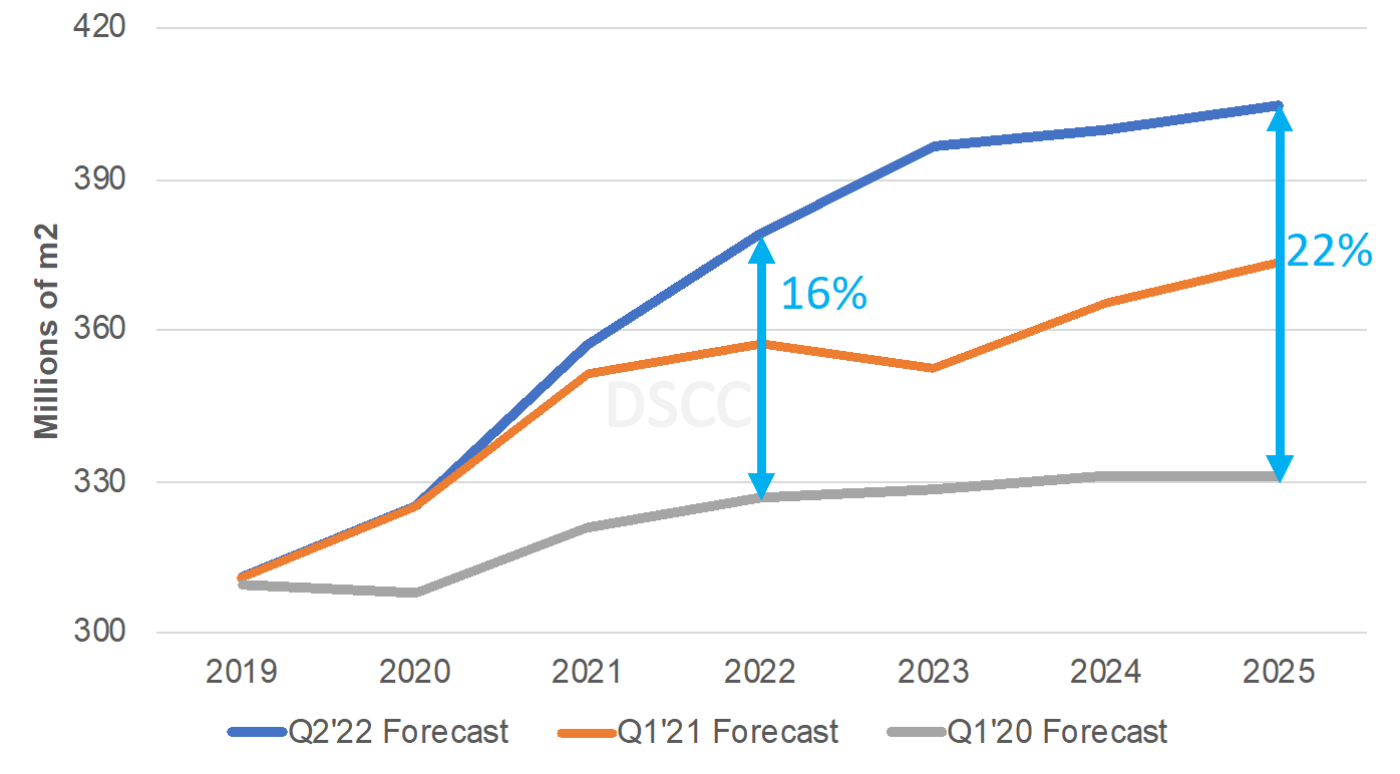
Last year, we were far more optimistic for the LCD industry in 2022 and beyond, because panel manufacturers had restrained themselves with their capex plans. However, over the past year, we have seen numerous new fab and capacity expansion announcements. As a result, LCD supply growth is now significantly higher than previously expected, 16% higher for 2022 vs. our Q1’20 forecast and 22% higher for 2025 vs. our Q1’20 forecast. Furthermore, much of this investment is happening in IT markets as panel suppliers believe the boom in IT markets will continue. OLED suppliers are also targeting the IT market with their new investments. However, the IT market peaked in 2021. Thus, we will see much of this new capacity reallocated to automotive, which is growing and we will likely see growing price competition in the IT space leading to higher penetration for more advanced IT panels – OLED, MiniLED, IGZO backplanes, etc.
DSCC’s LCD Capacity Forecast Over Time
I also shared all the latest new fab schedules, highlighting investments in OLED smartphones, OLED IT, LCD TV, LCD TV and TV and LCD TV. There is nothing firm in OLED TVs at the moment, but we do expect more OLED capacity to come online eventually. Certainly, if SEC and LGD reach an agreement on WOLED panel supply, LGD will expand capacity.
I then shared our latest supply/demand growth charts and fab utilization forecasts. After boosting production in Q1’22 on optimism for demand, 10”+ demand growth is expected to be flat or down for Q2-Q4’2022 on a Y/Y basis. Some TV brands built up inventory in Q1’22 expecting price increases in Q2’22 and panel makers were overly optimistic on IT markets. The SDC timing for shutting down T8-2 is favorable for panel suppliers; utilization will fall 83% - 85% in 2H’2022 but would have been 80%-83% otherwise. Panel prices are expected to be under significant pressure for the rest of 2022 and will fall below pre-pandemic levels in most cases. We already see 55” panel prices falling below average cash costs and expect 65” to approach cash costs by the end of the year.
Given the latest outlook presented by application, we reduced our 2022 revenue forecast in April from -9% to -13% to $142B. We see large double-digit declines in IT and TVs on sharp price reductions. MiniLEDs will be a bright spot, up 92% to $5.2B. Area growth for OLEDs+LCDs was downgraded in April from +5% to +3%, with downside risks dominating.
The next section covered, was display technology evolution. In LCDs, we saw a significant improvement in contrast and brightness with MiniLEDs which will now focus on reducing thickness and power. Elsewhere, we are seeing a continued evolution in gaming refresh rates, response times, variable refresh rates, color gamut, power consumption, thickness/weight, bottom borders, narrower borders, etc. We are also hearing about LCD manufacturers patterning antennas on their displays in the future to boost cellular connectivity performance and capture more value.
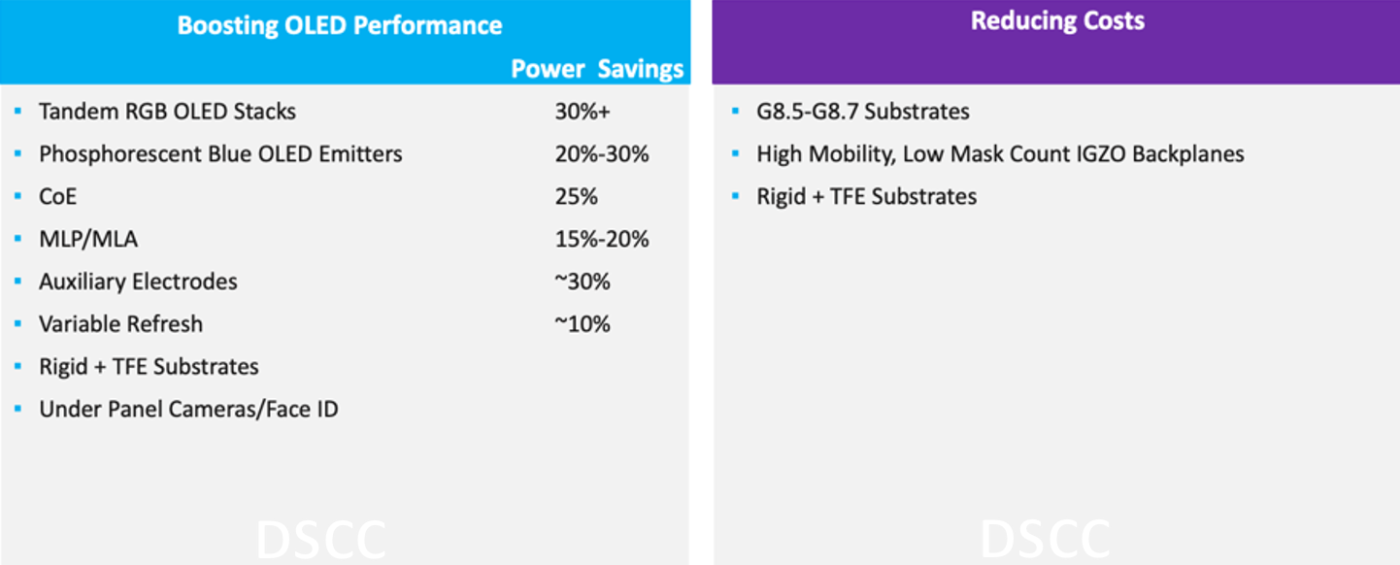
In OLEDs, we are seeing many new technology improvements coming at the same time as manufacturers are pursuing sharp cost reduction strategies boosting their penetration outlook into the IT market. As indicated below, tandem RGB OLED stacks, phosphorescent blue OELD emitters, color on encapsulation, multi lens arrays, auxiliary electrodes and variable refresh can each reduce power consumption by 10% - 30%. Those technologies are all likely to be employed by 2024. At the same time, panel suppliers are migrating to G8.5-G8.7 substrates, high mobility, low mask count IGZO backplanes and rigid + TFE substrates which should improve thickness and weight vs. rigid OLEDs and lower costs vs. flexible OLEDs.
Boosting OLED Performance While Lowering Costs in IT Markets
I then went into more detail on the benefits and challenges of tandem stacks, CoE, auxiliary electrodes, high mobility IGZOP backplanes and G8.5 backplanes and frontplanes. I also shared that our cost modeling showed G8.5 IGZO backplanes could reduce 16.2” panel costs by 25% vs. G6 rigid+TFE substrates and even more vs. LTPO flexible substrates. At 12.9”, due to different panelization, the advantage would be 15% for IGZO vs. LTPS rigid + TFE and even greater vs. LTPO flexible. Larger substrates and a less capital intensive backplane process will help OLEDs narrow the gap with conventional LCDs in IT markets and maintain an advantage vs. MiniLEDs.
I also shared our OLED IT technology roadmap revealing when tandem RGB stacks, G8.5+ FMM VTE, IGZO backplanes, G8.5+ LTPO, rigid + TFE, phosphorescent blue OLED and foldable are likely to enter into mass production by each panel manufacturer at each substrate size.
Lastly, I shared our longer-term display market outlook. We expect utilization to bottom in Q3’22, peak again in 2024 fueled by slower 2023 capex and then fall again 2025 as cyclicality continues. TV panel prices are forecasted to rebound in 2023, but not reach the highs of 2021. They are a correction after extensive pricing pressure in 2022 and reduced capex. We may also see some additional fab closures outside of China after the weak 2022 environment. For example, Taiwan panel suppliers may try and sell their cleanrooms to Taiwan chip foundries which could accelerate their time to market.
From 2022 to 2026, we see 3% unit CAGR in displays led by S/M Others (AR/VR), large-area others (signage), automotive and Smart Watches. 5% area CAGR predicted led by automotive, signage, TVs, Smart Watches and Mobile Phones. IT markets are expected to be lower in units in 2026 than 2021. All but notebook PCs are expected to be larger in area. The average diagonal is expected to continue to grow led by automotive, TVs and monitors.
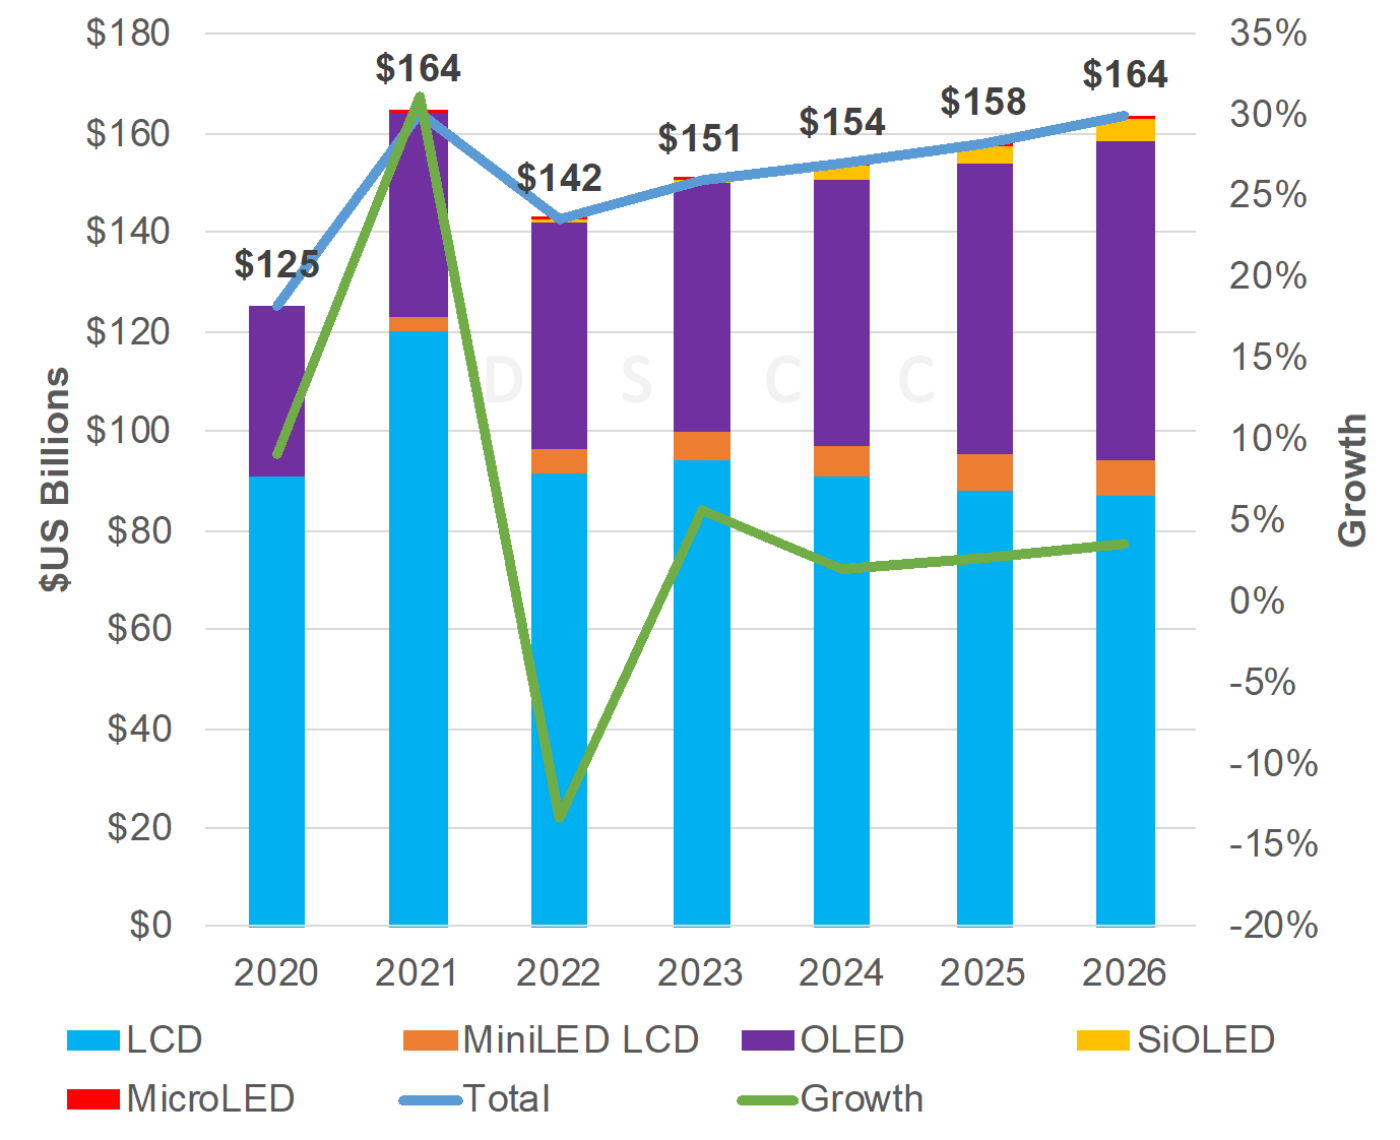
Display revenues are not forecasted to reach the 2021 high until 2026 helped by AR/VR growth. Annual growth is expected after the 2022 lows at 2% - 6% per year with a 4% 2022-2026 CAGR and remain well above pre-pandemic levels. We are now tracking SiOLED (Micro OLED) and MicroLED revenues and expect conventional LCDs to fall annually from 2021 to 2025 with gains by OLEDs, MiniLEDs, SiOLEDs and MicroLEDs. By application, mobile phones and TVs will remain the two largest applications with AR/VR, automotive and signage growing the fastest.
Display Revenue Forecast
In summary, 2020-2021 was the best of times. Everything went right for the display industry – higher units, higher prices, tight supply, lower costs, rich product mix, higher margins, etc. 2022 is the worst of times, everything is going wrong for the display industry – lower units, lower prices, loosening supply, higher costs, lower margins. Prices expected to fall to cash costs in some cases. The display industry will remain cyclical. Over investment over the last two years is contributing to the current sharp price reductions. There will be a large drop in capex next year and may see additional capacity come offline Furthermore, over-investment in IT markets is a concern with LCD and OLED suppliers all targeting the same markets with significant new capacity. We will see better LCD and OLED performance at lower costs:
- LCDs – MiniLED backlights will get more efficient, thinner and cheaper;
- OLEDs – tandem stacks, high efficiency blue, high mobility IGZO, CoE, MLP/MLA, auxiliary electrodes, G8.5-G8.7 glass, rigid + TFE substrates will boost OLED performance and reduce cost;
- Advanced displays getting cheaper, will be increasingly tough for conventional a-Si LCDs;
- Will make it more difficult for new technologies to enter existing applications – MicroLEDs, ELQDs, etc. The bar keeps going up.
The display industry will recover from 2023, with a 4% revenue CAGR from 2022 to 2026 to reach 2021 revenues of $164B and will get a major boost from automotive and AR/VR markets and will remain indispensable to our lives as learned from the pandemic.