Q1'22のOLED出荷実績~枚数は前年比4%減も金額は変わらず
冒頭部和訳
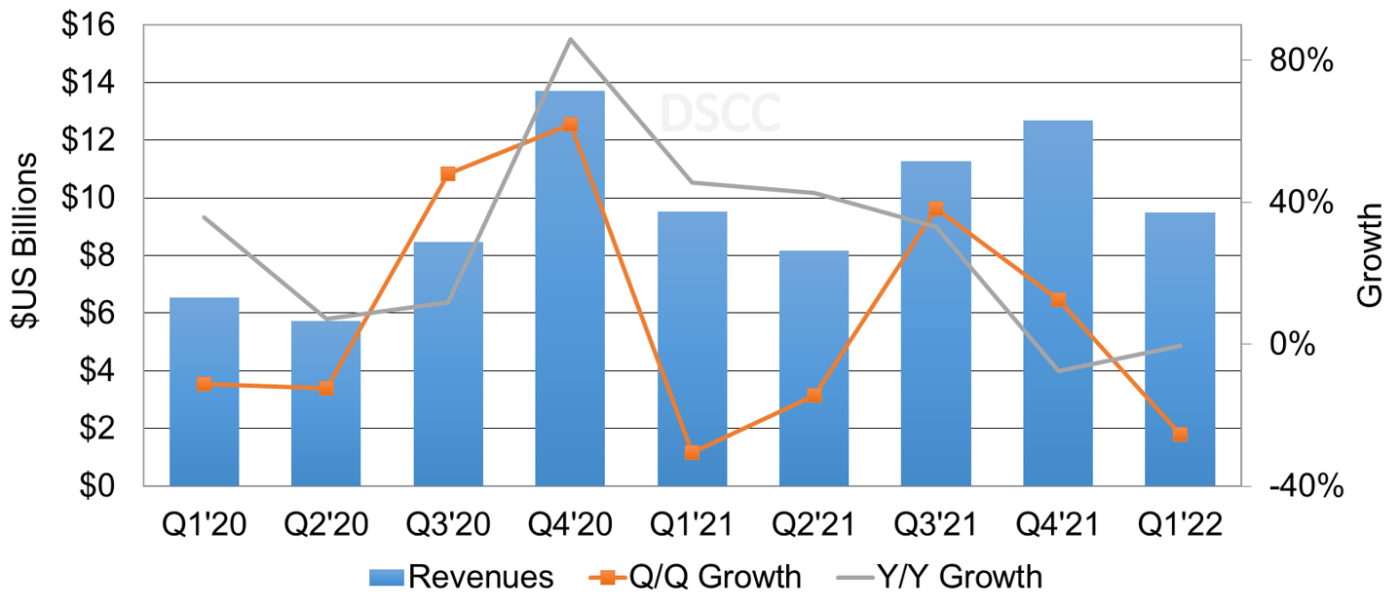
Q1’22のOLED出荷枚数は前年比4%減となったが、出荷金額は横ばいだった。DSCCの Quarterly OLED Shipment Report (一部実データ付きサンプルをお送りします) 最新号 (速報版) で明らかになった。
出荷枚数と出荷金額が前年比で増加したOLEDアプリケーションは以下の通り。
- 車載:枚数16%増、金額59%増
- モニター:枚数644%増、金額317%増
- ノートPC:枚数110%増、金額51%増
- スマートウォッチ:枚数4%増、金額8%増
- タブレット:枚数106%増、金額152%増
出荷枚数と出荷金額が前年比で減少したOLEDアプリケーションは以下の通り。
- スマートフォン:枚数8%減、金額3%減
- TV:枚数7%減、金額6%減
- タッチバー:枚数81%減、金額82%減
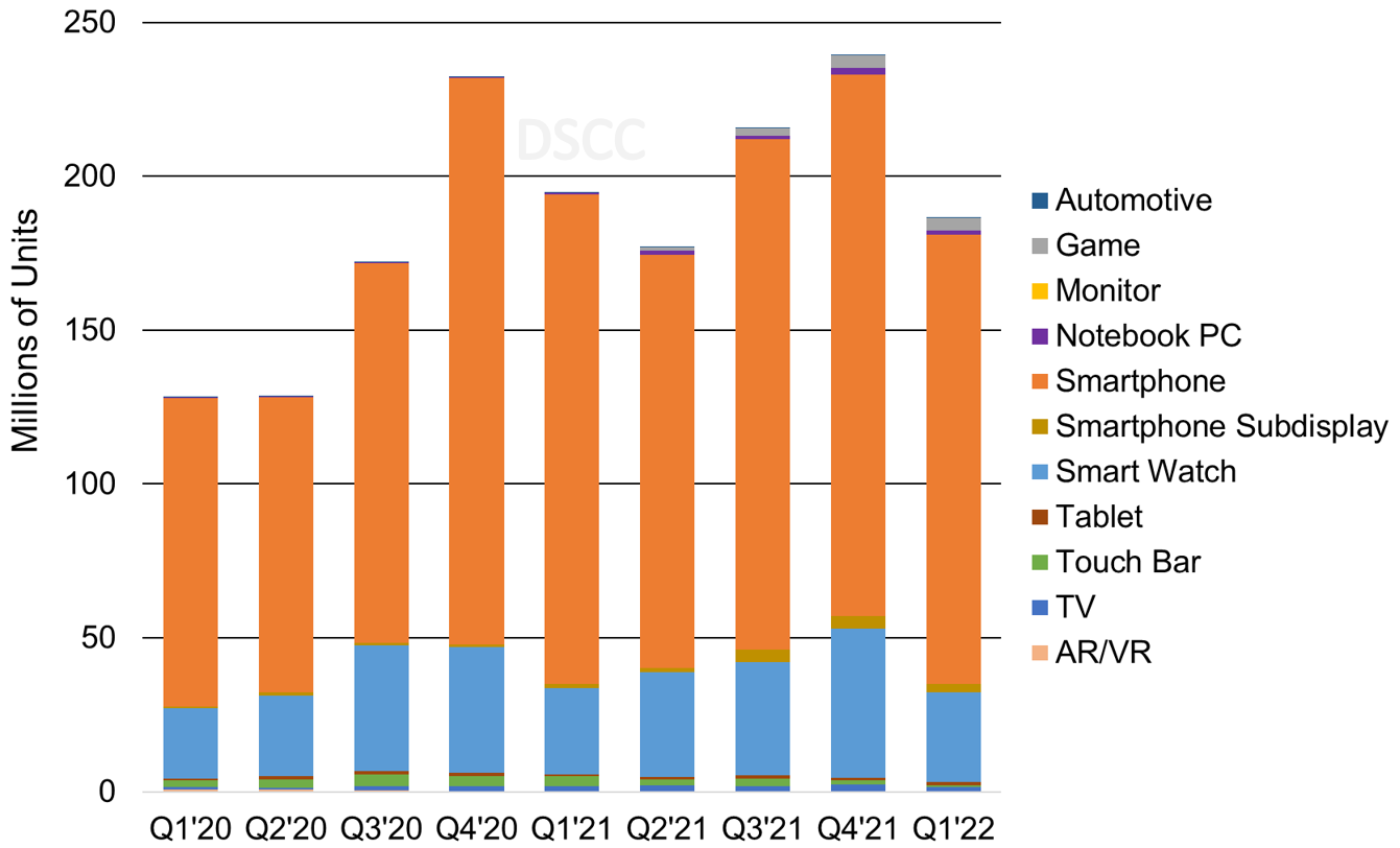
Q1’22のOLED出荷をアプリケーション別に見ると、スマートフォンが依然としてトップで、枚数シェア78%、金額シェア79%だった。Q4’21は前者が73%、後者が76%で、いずれも拡大している。Q1’22のスマートウォッチは枚数シェア16%、金額シェア6%で、Q4’21のそれぞれ20%と9%から縮小した。他のアプリケーションのシェアはすべて1桁台のままだった。
前年比で出荷が増加したOLEDアプリケーションを見ると、Q1’22に複数のブランドから新製品が発売された結果、出荷が押し上げられている。OLEDモニターでは、Dellが34インチQD-OLEDを、LGが42インチおよび48インチC2シリーズを発売した。OLEDノートPCでは、AsusとLenovoが新製品を発売した。Asusの新製品はZenbook 14 OLEDとVivobook 13 Slate、LenovoはThinkPad X1 YogaとThink Pad X1 Carbon Gen10である。OLEDタブレットでは、SamsungがGalaxy Tab S8+とGalaxy Tab S8 Ultraを発売した。新製品の発売に加え、Q1’22にはOLEDのASP (平均単価) が、車載、ノートPC、タブレットの各アプリケーションで上昇した。
前年比で出荷が減少したOLEDアプリケーションでは、スマートフォンの出荷減少が予測よりも大きかった。その要因として、中国での新型コロナウイルス関連の長期にわたるロックダウンによるサプライチェーンへの影響、重要コンポーネントの物流と輸送の問題、DDICチップ不足、ロシアとウクライナの戦争の影響を受けている需要、対ロシア制裁によるインフレ悪化、さらに石油価格、輸送コスト、食料価格、住宅価格、資本コストの上昇による裁量支出の減少が挙げられる。TV用OLEDの出荷金額シェアはQ4'21の10%からQ1’22には9%に縮小した。前述のマクロ経済、サプライチェーン、グローバルの課題に加え、過剰生産能力と全体的なTV需要の減速によるTV用LCD価格の非常に急速な下落も要因として挙げられる。Q1'22の場合、LCD TVのASPはOLED TVのASPのほぼ6分の1だった。2021年からQ1'22の期間、TV画面サイズ範囲では55インチから59インチが過半数を占めている。この画面サイズ範囲では、TV用LCDのASPの優位性が現在は4 : 1となっているが、Q1'21時点では2 : 1だった。OLEDタッチバーでは、Appleがこの機能のサポートを終了した。そのため、このカテゴリーでは前期比、前年比とも減少が続くと予測される。
Q1’22 OLED Revenues Flat Y/Y Despite 4% Unit Decline
As revealed in DSCC’s latest release of the Quarterly OLED Shipment Report (一部実データ付きサンプルをお送りします) – Flash Edition, OLED panel revenues remained flat Y/Y despite a 4% Y/Y unit decline in Q1’22.
OLED applications that had Y/Y panel shipment and revenue increases were:
- Automotive increased 16% Y/Y in units and 59% Y/Y in revenue;
- Monitors increased 644% Y/Y in units and 317% Y/Y in revenue;
- Notebook PCs increased 110% Y/Y in units and 51% Y/Y in revenue;
- Smartwatches increased 4% Y/Y in units and 8% Y/Y in revenue;
- Tablets increased 106% Y/Y in units and 152% Y/Y in revenue.
OLED applications that had Y/Y panel shipments and revenue declines were:
- Smartphones decreased 8% Y/Y in units and 3% Y/Y in revenue;
- TVs decreased 7% Y/Y in units and 6% Y/Y in revenue;
- Touch bars decreased 81% Y/Y in units and 82% Y/Y in revenue.
AMOLED Panel Revenue and Y/Y Growth, Q1’20-Q1’22
In Q1’22, smartphones remained the largest OLED application with a 78% unit share and 79% revenue share, up from 73% and 76% respectively in Q4’21. OLED smartwatches had a 16% unit share and 6% revenue share, down from 20% and 9% respectively in Q4’21. All other applications remained with single digit share.
For OLED applications that had Y/Y growth, several brands launched new products in Q1’22 that helped lift those categories. For OLED monitors, Dell launched the 34” QD-OLED and LG launched the 42” and 48” C2 series. For OLED notebook PCs, Asus and Lenovo launched several new OLED notebook PCs. Asus launched the Zenbook 14 OLED and Vivobook 13 Slate and Lenovo launched the ThinkPad X1 Yoga and ThinkPad X1 Carbon Gen 10. For OLED tablets, Samsung launched the Galaxy Tab S8+ and Galaxy Tab S8 Ultra. In addition to the new products, blended panel ASPs were higher in Q1’22 for automotive, notebook PCs and tablets.
For OLED applications with Y/Y declines, the smartphone declines were larger than expected as a result of extended COVID-19 lockdowns in China that are impacting supply chains, logistics and transportation of critical components, DDIC chip shortages, the Russia-Ukraine war impacting demand, sanctions against Russia worsening inflation, less discretionary spending due to higher oil prices, transportation costs, food prices, housing prices and costs of capital. In Q1’22, for OLED TVs, panel revenue declined to a 9% revenue share, from 10% in Q4’21. In addition to the macroeconomic, supply chain and global issues mentioned before, LCD TV panel prices are declining at a much faster rate due to overcapacity and overall TV demand slowing. For Q1’22, blended panel ASPs for LCD TVs were almost 6x lower than blended panel ASPs for OLED TVs. In Q1’22 and for 2021, the 55” – 59” TV display size range has the majority share. For this display size range, LCD TV panels now have a 4:1 panel ASP advantage versus a 2:1 ASP advantage in Q1’21. For OLED touch bars, Apple is no longer supporting this feature. As such, we expect to see continued Q/Q and Y/Y declines for this category.
AMOLED Panel Shipments by Application, Q1’20-Q1’22
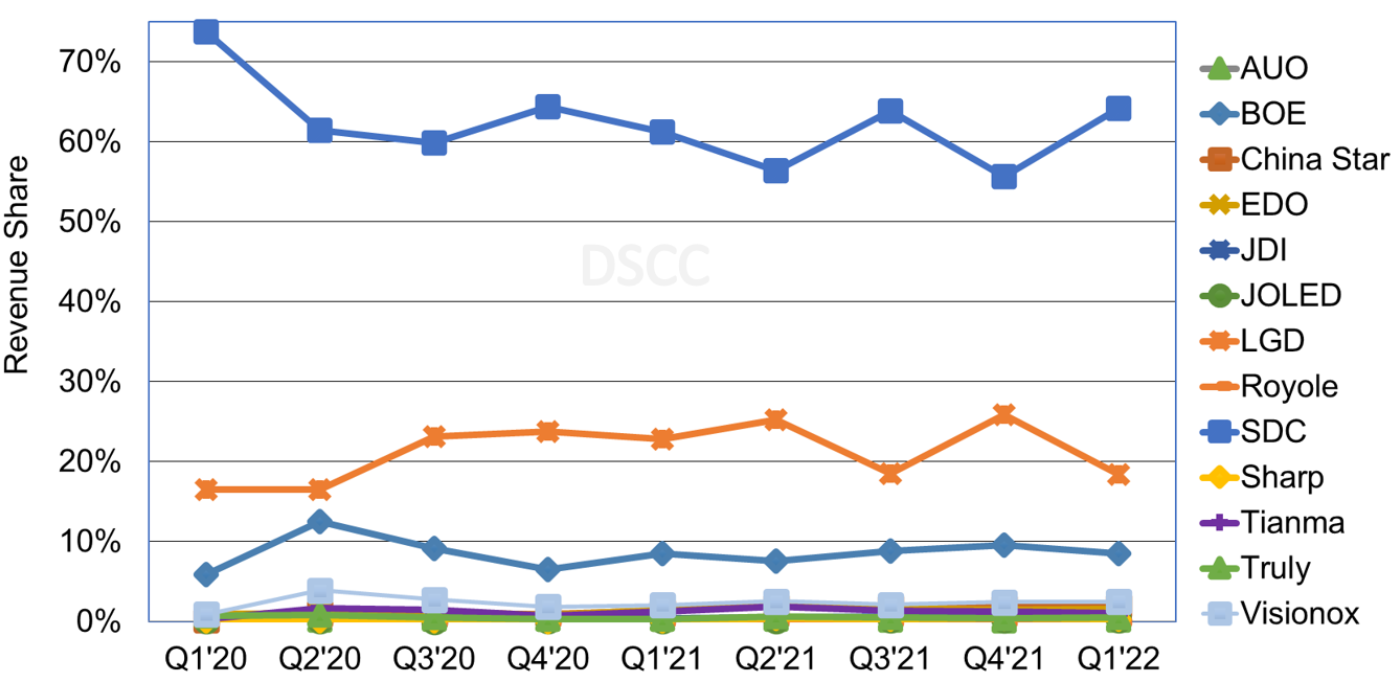
In Q1’22, for panel revenue by panel supplier for all OLED applications, SDC accounted for a 64% revenue share, up from 56% in Q4’21, followed by LGD with 18%, down from 26% in Q4’21 and BOE with 9%, down from 10% in Q4’21. SDC’s share gains were a result of 202% Q/Q unit growth for OLED tablets and specifically for the Galaxy Tab S8 and S8 Ultra. The revenue share declines for LGD and BOE were the result of double-digit unit declines for the Apple iPhone 12, and iPhone 13.
AMOLED Panel Revenue by Panel Supplier, Q1’20-Q1’22
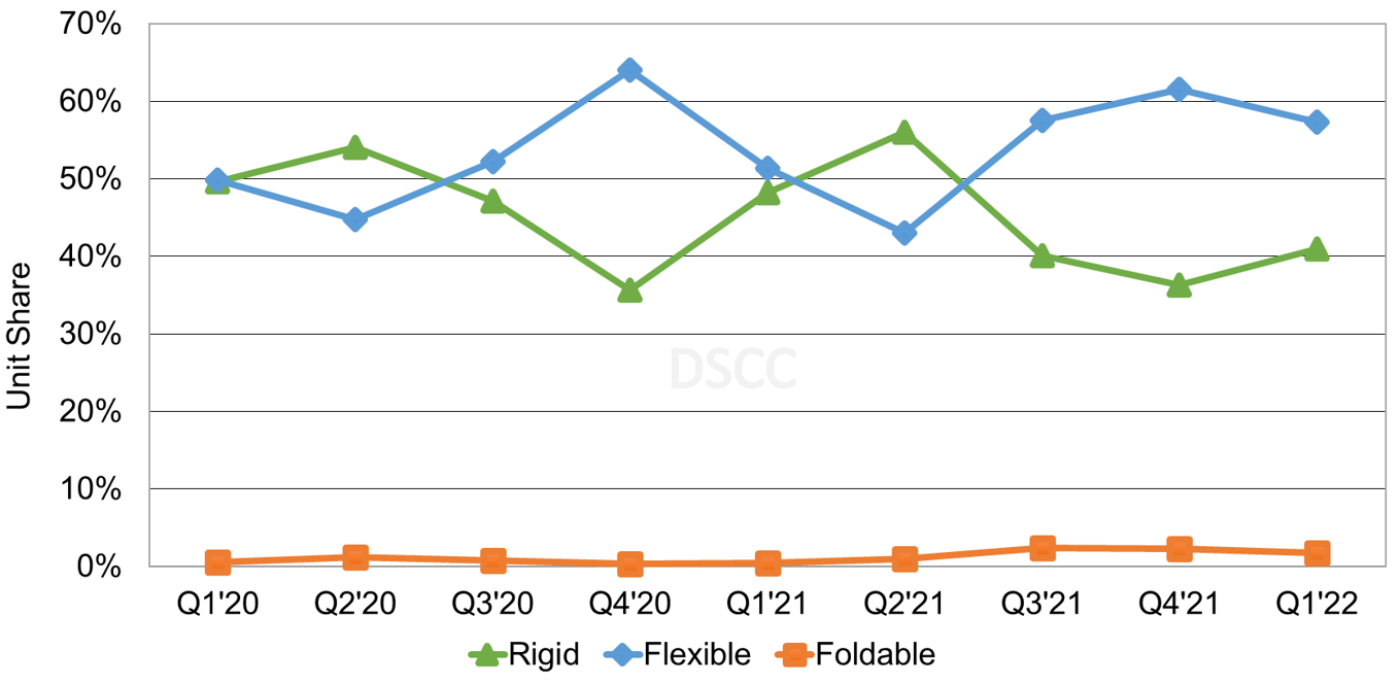
In Q1’22, by OLED smartphone form factor, rigid OLED had a 41% unit share up from 36% in Q4’21, followed by flexible OLED with 57% down from 62% in Q4’21 and foldable OLED with 2%.
AMOLED Smartphone Panel Shipments by Form Factor, Q1’20-Q1’22
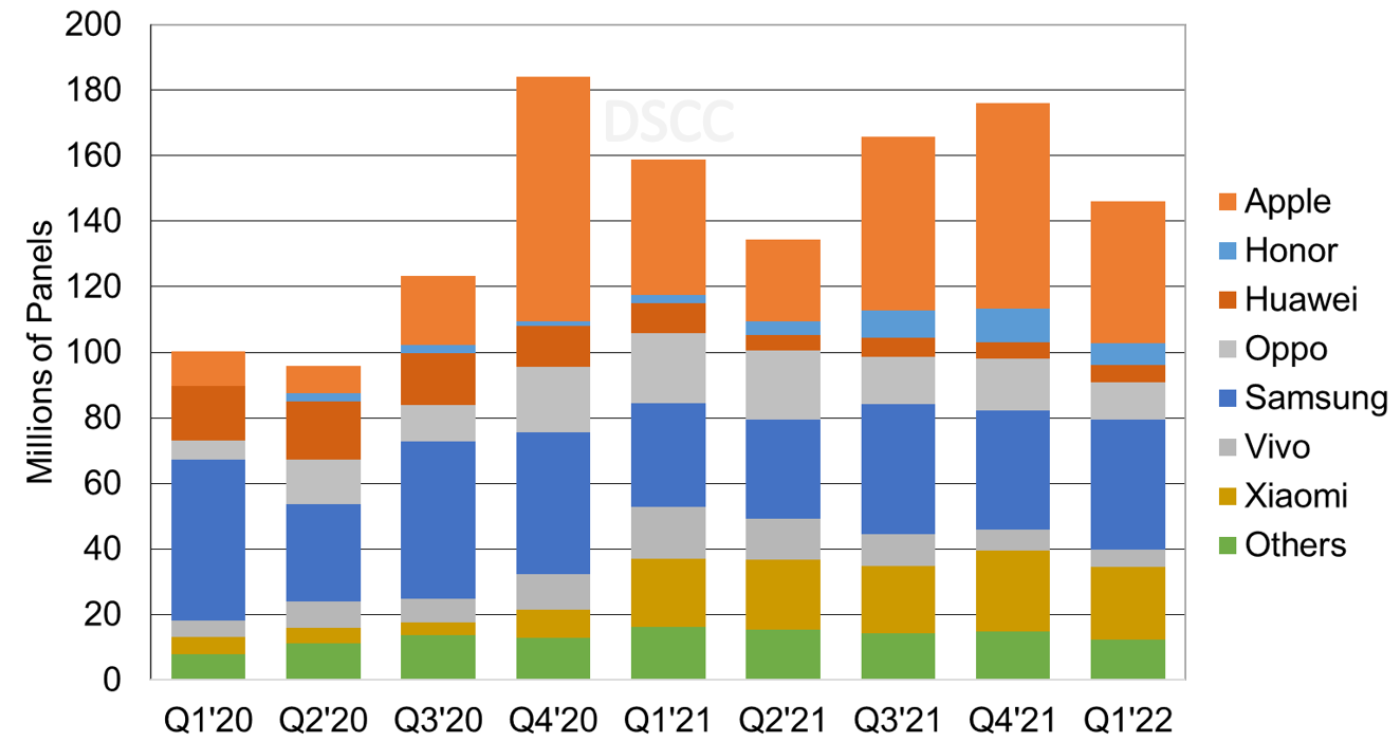
For OLED smartphone panel procurement by brand, Apple’s share fell from 36% in Q4’21 to 30% in Q1’22 on seasonal weakness followed by Samsung with a 27% unit share, up from 21% in Q4’21. Xiaomi also gained share to 15%, up from 14%. In Q1’22, Samsung and Xiaomi had a combined 66% unit share of rigid OLED smartphones. Rigid OLED smartphones were down 8% Q/Q, while flexible OLED smartphones were down 23% Q/Q. Since Apple is 100% flexible OLED for smartphones, they contributed significantly to the decline in flexible OLEDs.
AMOLED Smartphone Panel Shipments by Brand, Q1’20-Q1’22
DSCC’s long-term forecast for OLED units, revenues, area, panel supplier share, brand share, etc. will be available next month. For more information, please contact info@displaysupplychain.co.jp.