FPD生産ライン稼働率が低下~FPD価格の下落緩和が目的
冒頭部要約
DSCCが四半期毎に発行する Quarterly All Display Fab Utilization Report の最新刊が先週リリースされた。LCDパネル価格はキャッシュコストに向かって下がり続けており、多くのサイズがキャッシュコストを割り込んでいきそうだ。2022年上半期にはパネル生産ラインの稼働率低下が弱いため、パネル在庫解消には不十分である。Q1'22における稼働率の低下が不十分であり、かつQ1'22からQ2'22で基板投入量増加を見込み、パネル価格への圧力は継続すると予測した。
冒頭部和訳
DSCCが四半期毎に発行する Quarterly All Display Fab Utilization Report (一部実データ付きサンプルをお送りします) の最新号が先週リリースされた。LCD価格はキャッシュコストに向かって下がり続けており、多くのサイズがキャッシュコストを割り込んでいきそうだ。2022年上半期にはFPD生産ラインの稼働率低下が弱いため、FPD在庫解消には不十分である。Q1'22における稼働率の低下が不十分であり、かつQ1'22からQ2'22で基板投入量増加を見込み、FPD価格への圧力は継続すると予測した。Q4'21はFPDメーカー全社の合計TFT基板投入面積が前期比2%減・前年比9%増の8630万㎡だったが、現四半期であるQ1'22は前期比1%増・前年比8%増の8710万㎡になる見通しだ。
本レポートはFPD業界の100以上の生産ラインすべてを対象に生産能力、TFT基板投入量、稼働率の詳細データを掲載している。メーカー、国、TFT生産ライン世代、バックプレーン、フロントプレーン、基板タイプなどのセグメント別のデータ表示を可能にするExcelピボットテーブルも提供する。本レポートには2018年第1四半期以降の稼働率実績と2022年第2四半期までの月間稼働率予測を収録している。
2020年前半にコロナ禍がもたらした減速後の生産ライン稼働率は、以下のグラフに示すように、台湾と中国で特に高くなっている。台湾の稼働率はQ4’21にやや低下したものの、7期連続で90%を上回っている。世界全体の稼働率はQ4’21に2ポイント低下して86%となったが、Q1’22にはさらに1ポイント下がって85%になると予測される。これはパンデミックの初期であったQ2’20以来の最低水準である。
Display Fab Utilization Slowing to Alleviate Panel Price Declines
With LCD panel prices continuing to fall toward cash costs or even below cash costs, we forecast that display fab utilization will slow in the first half of 2022, according to the latest release of DSCC’s Quarterly All Display Fab Utilization Report (一部実データ付きサンプルをお送りします) issued last week. However, because of capacity increases, even with lower utilization, the industry will have increased input for the first half, suggesting continued pressure on panel prices. In Q4’21, total TFT input for all display makers was down 2% Q/Q and up 9% Y/Y at 86.3M square meters, and in the current Q1’22, we expect total TFT input to be up 1% Q/Q and up 8% Y/Y to 87.1M square meters.
The report details capacity, TFT input and utilization for every flat panel display fab in the industry, more than 100 fabs in all and includes pivot tables to allow segmentation by the supplier, country, TFT fab generation, backplane, frontplane or substrate type. The report provides historical utilization back to Q1’18 and a forecast by month for the full year 2021.
After a COVID-19 induced slowdown in the first half of 2020, fab utilization has been particularly strong in Taiwan and China, as shown in the first chart here. Although utilizations in Taiwan decreased slightly in Q4’21, they remained above 90% for the seventh straight quarter. Worldwide utilization in Q4’21 dropped two points to 86% and is expected to fall another point in Q1’22 to 85%, the lowest level since the early days of the pandemic in Q2’20.
TFT Quarterly Fab Utilization by Region, 2018-2022
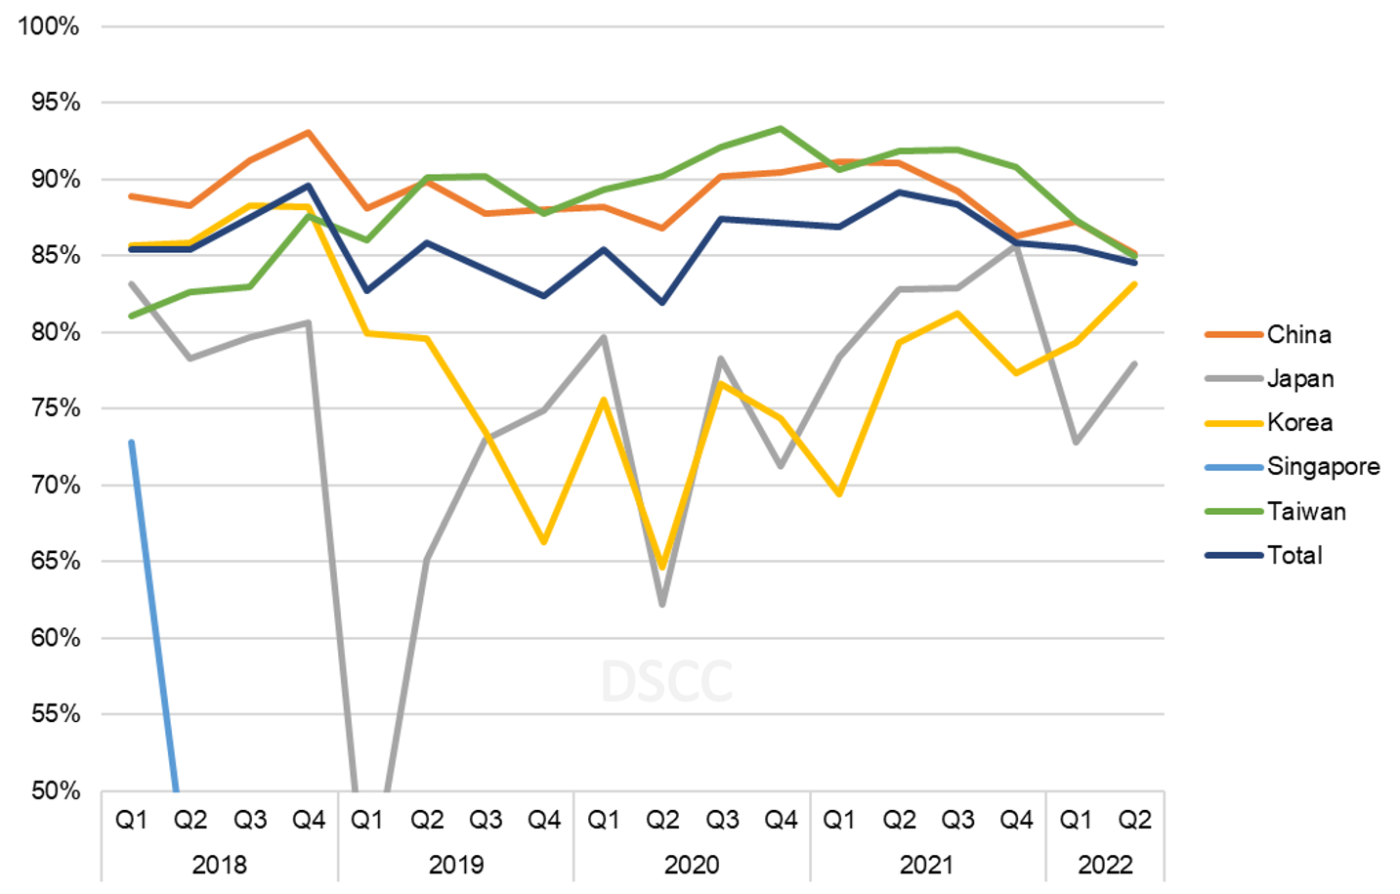
While utilization in China decreased in Q4, primarily at BOE, we have seen an increase in utilization in January and expect that Q1 utilization in China will increase 1% Q/Q to 87%. BOE’s utilization on its two Gen 10.5 lines in Wuhan and Hefei is expected to exceed 90% in the current quarter as the company seeks to hold or regain share in the largest screen sizes for TV.
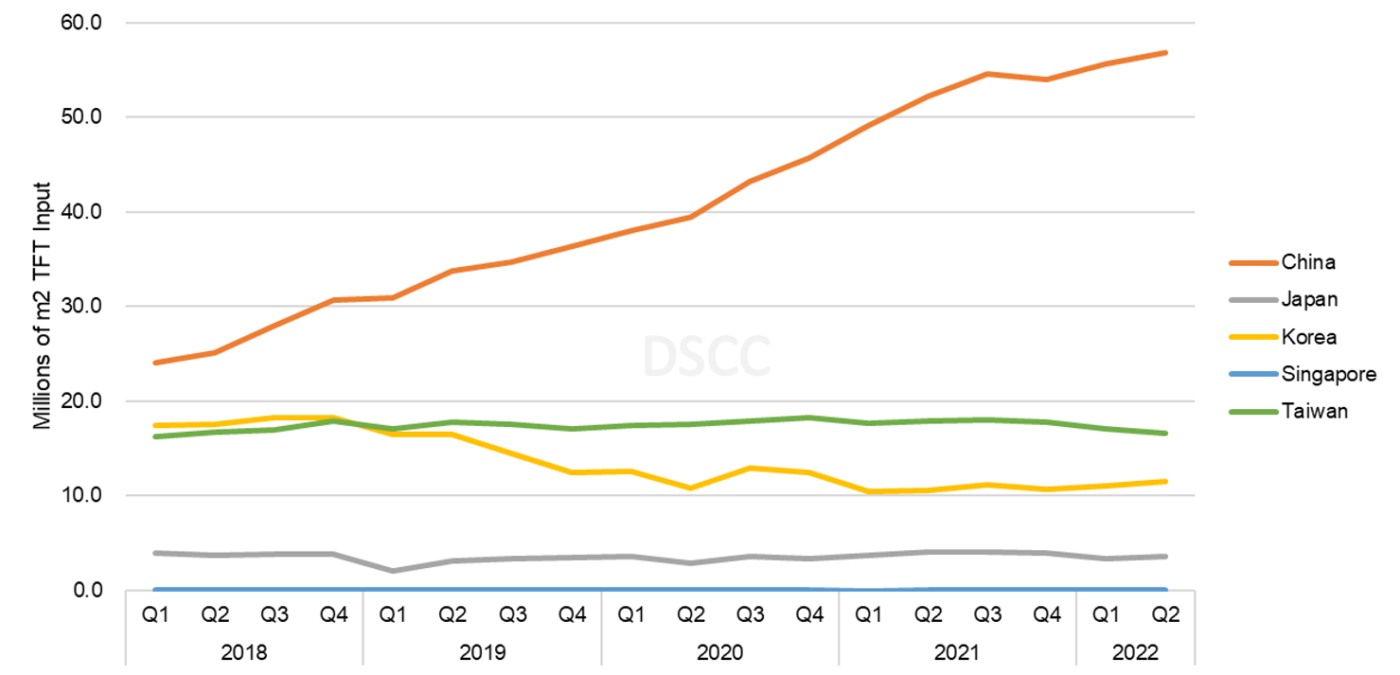
A view of TFT input shows that even with a slowdown in utilization, TFT input decreased only slightly in Q4 and will increase again in Q1. The biggest increases come from two Gen 8.6 fabs for HKC which are ramping, H4 in Mianyang and H5 in Hunan. These two fabs are expected to increase input by more than 1.4M square meters from Q4’21 to Q2’22, more than offsetting utilization declines elsewhere, and because they are ramping and HKC is expected to target an initial public offering, the company has a strong incentive to maintain production.
The regional view shows the extent that China has taken over the industry in the last three years and how this process is continuing in 2022. In Q1’18, China represented 39% of total industry TFT input on an area basis, but by Q3 of 2019, China was larger than all other regions combined. By the second quarter of 2022, China will represent 64% of all industry TFT input.
Quarterly TFT Input by Region, 2018-2022
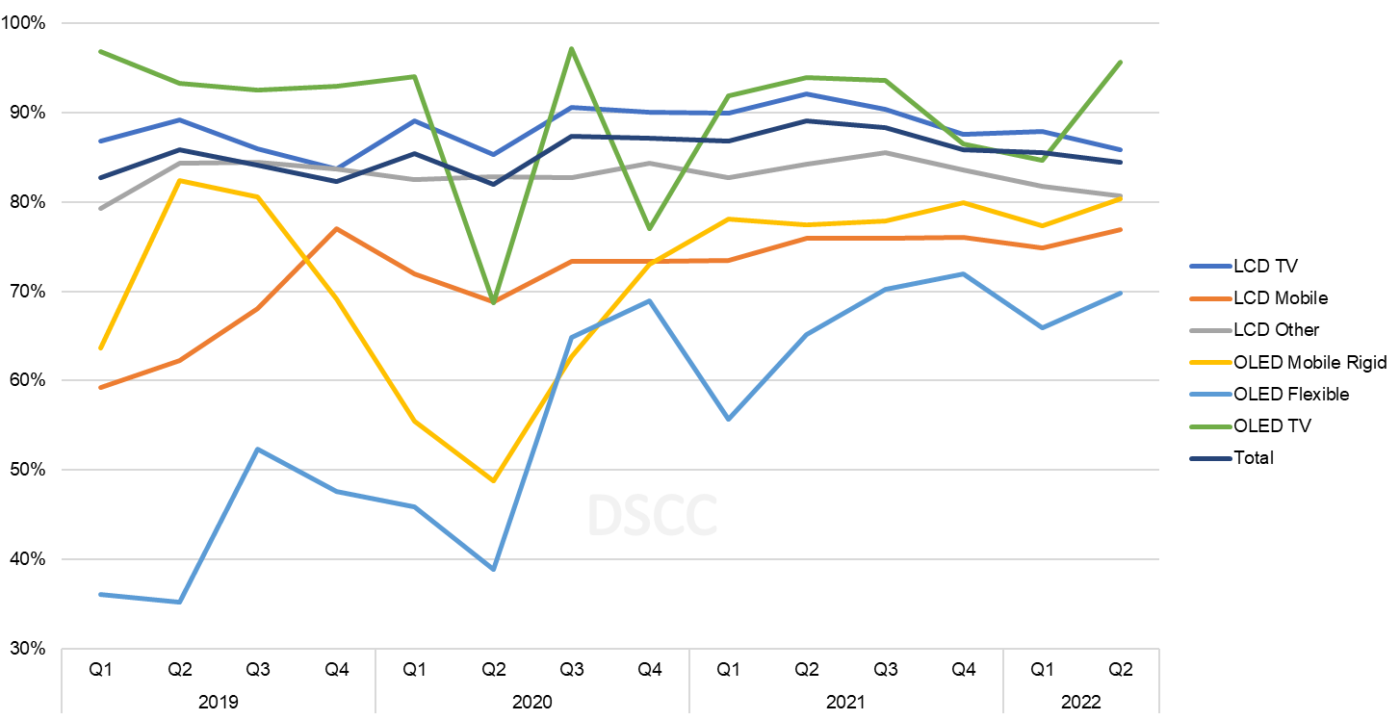
Looking at the picture by main application and display technology, we see that while mobile OLED fabs have run at much lower utilization than LCD fabs, the picture has improved substantially since 2020. While flexible OLED lines show a consistent seasonal pattern with a slowdown in the first half of each year because of the seasonality of smartphone sales, utilization in the first quarter of 2022 is expected to be 10% higher than last year.
In OLED TV, LGD’s lines have often been among the highest UT% in the industry for any application. Starting in Q3’21, the OLED TV category includes Samsung’s Q1 lines for QD-OLED, although SDC’s area input remains a small fraction of OLED TV overall. LGD has maintained a high UT% for its Guangzhou fab but slowed UT% in Q4’21 for Korea TV lines to prepare for the switch to deuterium for OLED EX panels. Utilization has remained lower in Q1’22, with high panel inventories and uncertainty over the WOLED deal with Samsung.
Quarterly TFT Utilization by Display Technology, 2019-2022
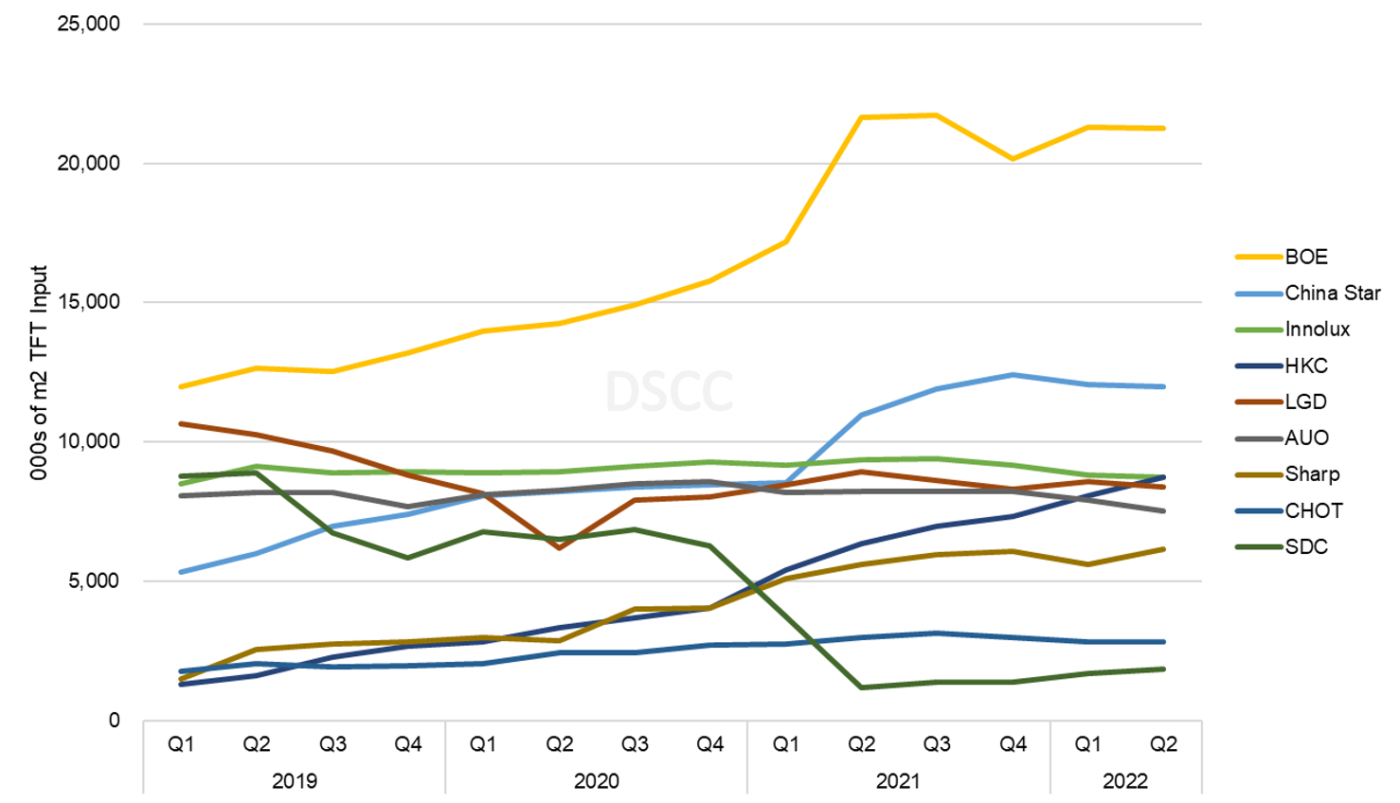
A view of TFT-LCD input by panel maker shows the increasing dominance of BOE along with China Star and HKC. Starting in Q1’21, we count BOE’s Gen 8.5/8.6 fabs newly acquired from CEC Panda in their total. Similarly, starting from Q2’21, we count the Gen 8.5 fab in Suzhou, China as capacity and input for China Star after they acquired this fab from SDC. In Q2 2022, we expect that BOE will represent 26% of industry TFT input, with China Star another 15% and HKC in a virtual tie with Innolux for #3 at 11% each.
Although LGD has delayed its plans to shut down LCD capacity in Korea and continues to maintain a high utilization on its Korea lines, for LCD input LGD was surpassed by Innolux in 2019 and will be passed by HKC in Q2 2022. Samsung has maintained a low level of utilization on its last LCD line in Korea before it shuts down in mid-2022.
Quarterly TFT-LCD Input by Panel Maker, 2019-2022
The industry’s capacity increases, which were a response to the unprecedented surge in demand during the pandemic, have now led to an oversupply which has brought panel prices down precipitously. Even with a slowdown in utilization, TFT input will increase in Q1’22 and maintain downward pricing pressure.
DSCC’s Quarterly All Display Fab Utilization Report (一部実データ付きサンプルをお送りします) covers capacity, TFT Input and utilization by month for every flat panel display fab in the industry, with pivot tables to allow segmentation by supplier, country, TFT fab generation, backplane, frontplane or substrate type. The report provides historical utilization back to Q1’18 and a forecast by month for the first six months of 2022. DSCC Weekly Review readers interested in subscribing to the Quarterly All Display Fab Utilization Report should contact info@displaysupplychain.co.jp.
