LCD TV Panel Price Declines Moderating as Prices Approach Cash Cost
LCD TV Panel Price Declines Moderating as Prices Approach Cash Cost
LCD TV panel prices, which peaked in summer 2021, fell through the second half of the year and are continuing to fall in the new year. The pace of price decreases is slowing, and we expect that pattern to continue through the first half of the year as prices approach cash cost for some panel makers.
In our updates in the summer of 2021, we referred to a series of events that suggested slowing demand and increasing supply, and no developments since have altered this outlook. The increasing panel prices led to an unprecedented increase in TV prices in the US and around the world, which hindered demand. Inventory is now more than sufficient across the LCD value chain from panel makers to retailers, which acts as a headwind for panel prices (or a tailwind for price declines!).
The first chart here highlights our latest TV panel price update, showing the both the biggest price increases in the history of the flat panel display industry, from May 2020 to June/July 2021 and then the fastest price decreases in the industry in the autumn of 2021. All sizes of panels have been at lower prices Y/Y since November.
LCD TV Panel Prices January 2020 - June 2022
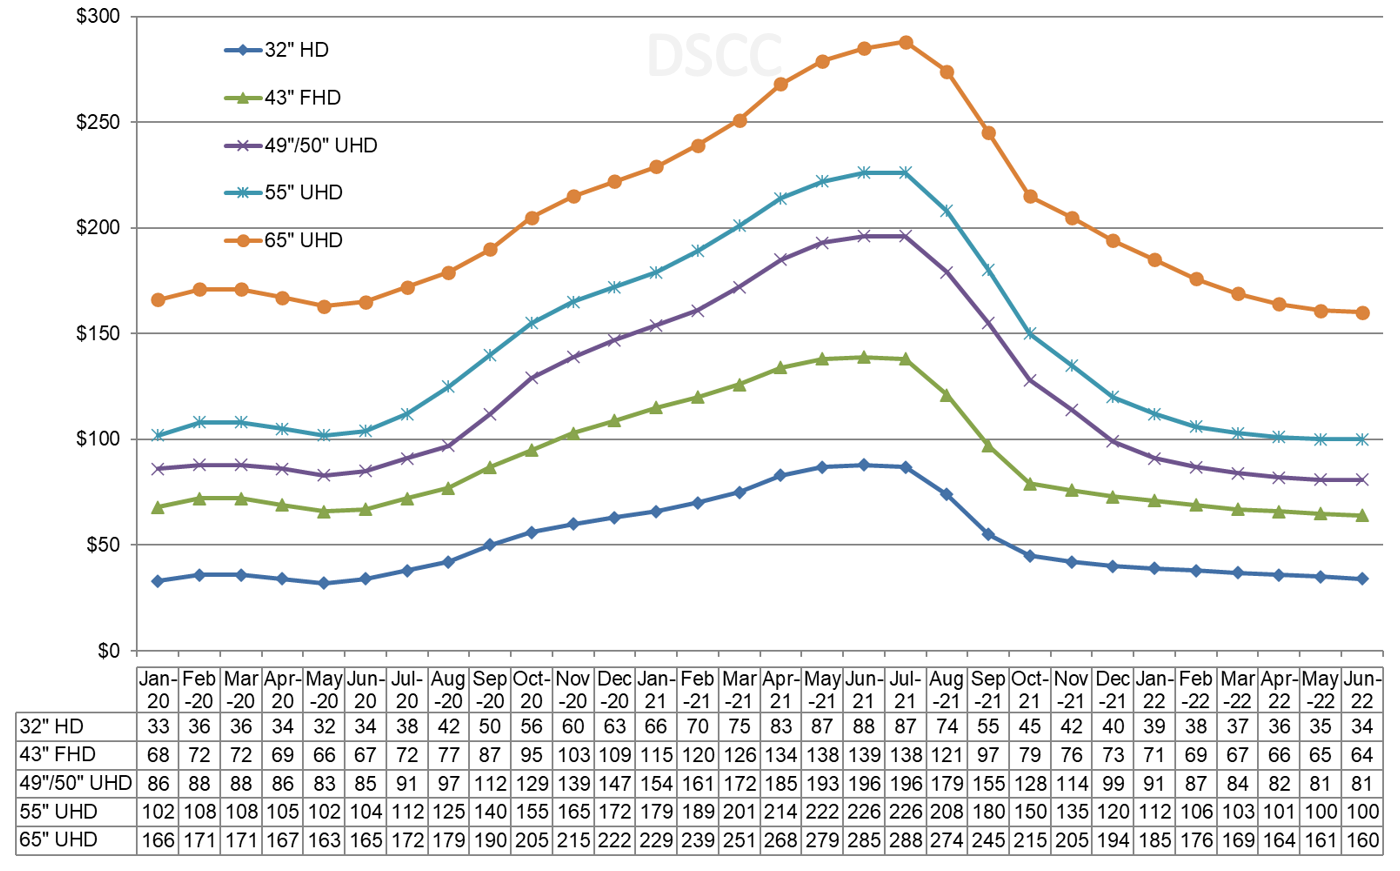
In January 2022, prices for all TV panel sizes fell, and for the third month in a row, the largest percentage declines occurred in the two sizes that are optimized on Gen 8.5/Gen 8.6 fabs. Prices for both 49”/50” panels and 55” panels declined by 8% and 7%, respectively, while both smaller and larger sizes had smaller price declines M/M.
The fourth quarter of 2021 saw the biggest Q/Q price declines in the history of the flat panel display industry. Price declines ranged from 17% on 75” panels to 41% on 32” panels, with the general pattern of larger price declines for small sizes and vice versa. Across the six sizes we track, the Q4 price declines averaged 32%.
Although the declines are slowing down in Q1, they are still severe for panel makers. We expect Q/Q price declines in Q1 2022 to range between 9% and 23% and to average 14%. With the most severe price declines occurring on 49”/50” and 55” panels, those two sizes will see price declines exceeding 20%.
As we look at pricing on an area basis, we are now seeing that all sizes 55” and below seem to be equally commoditized and area prices for all these sizes are converging. In February 2022, 55” are the lowest priced panels on an area basis at $127 per square meter, but all the sizes below 65” are in a narrow range between $127 and $135.
Monthly Area Prices per Square Meter for TV Panels, October 2016 - June 2022
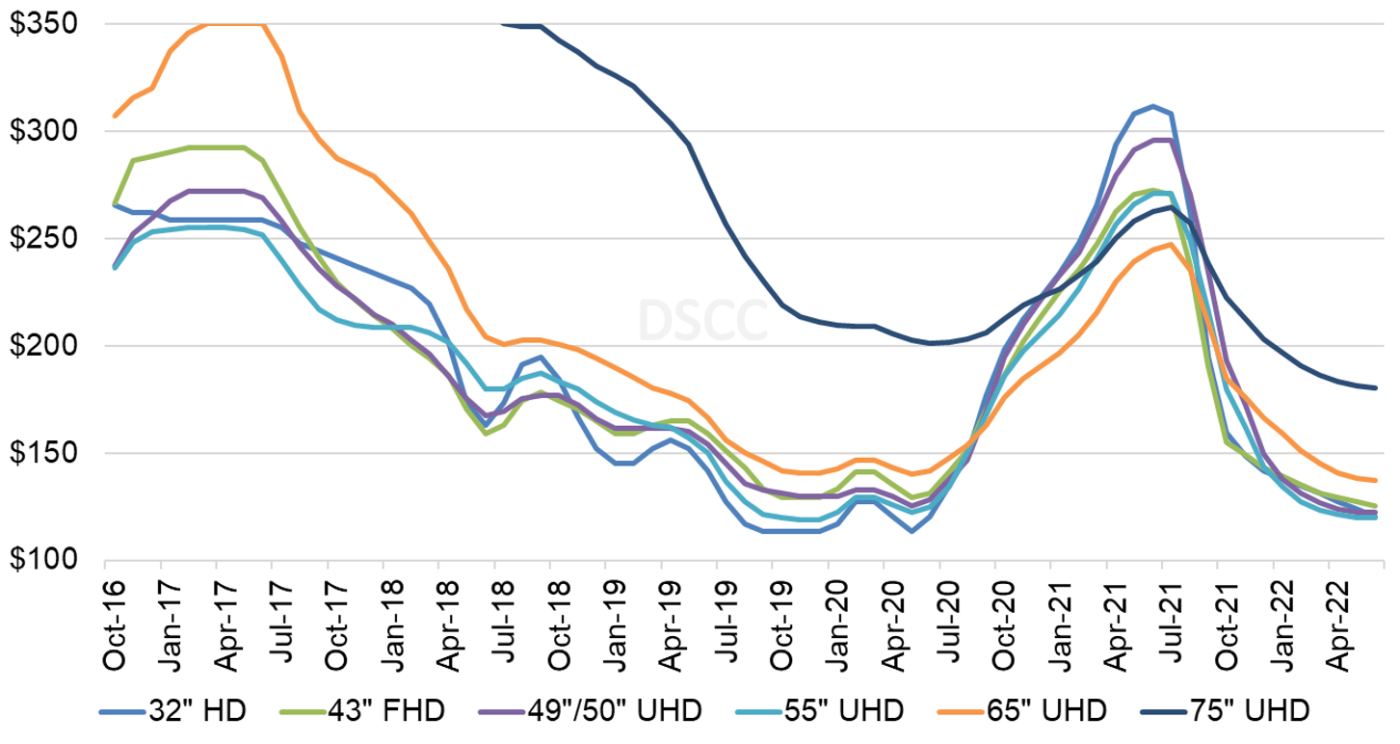
While prices have converged for all the smaller size panels, 65” and 75” panels continue to have a premium on an area basis. For February 2022, 65” panels sell at a premium of $24 or 19% over 55”, and 75” panels have a premium of $54 or 50%. Panel makers with Gen 10.5 capacity (BOE, CSOT and Sharp SIO) are at a relative advantage in the current oversupply environment.
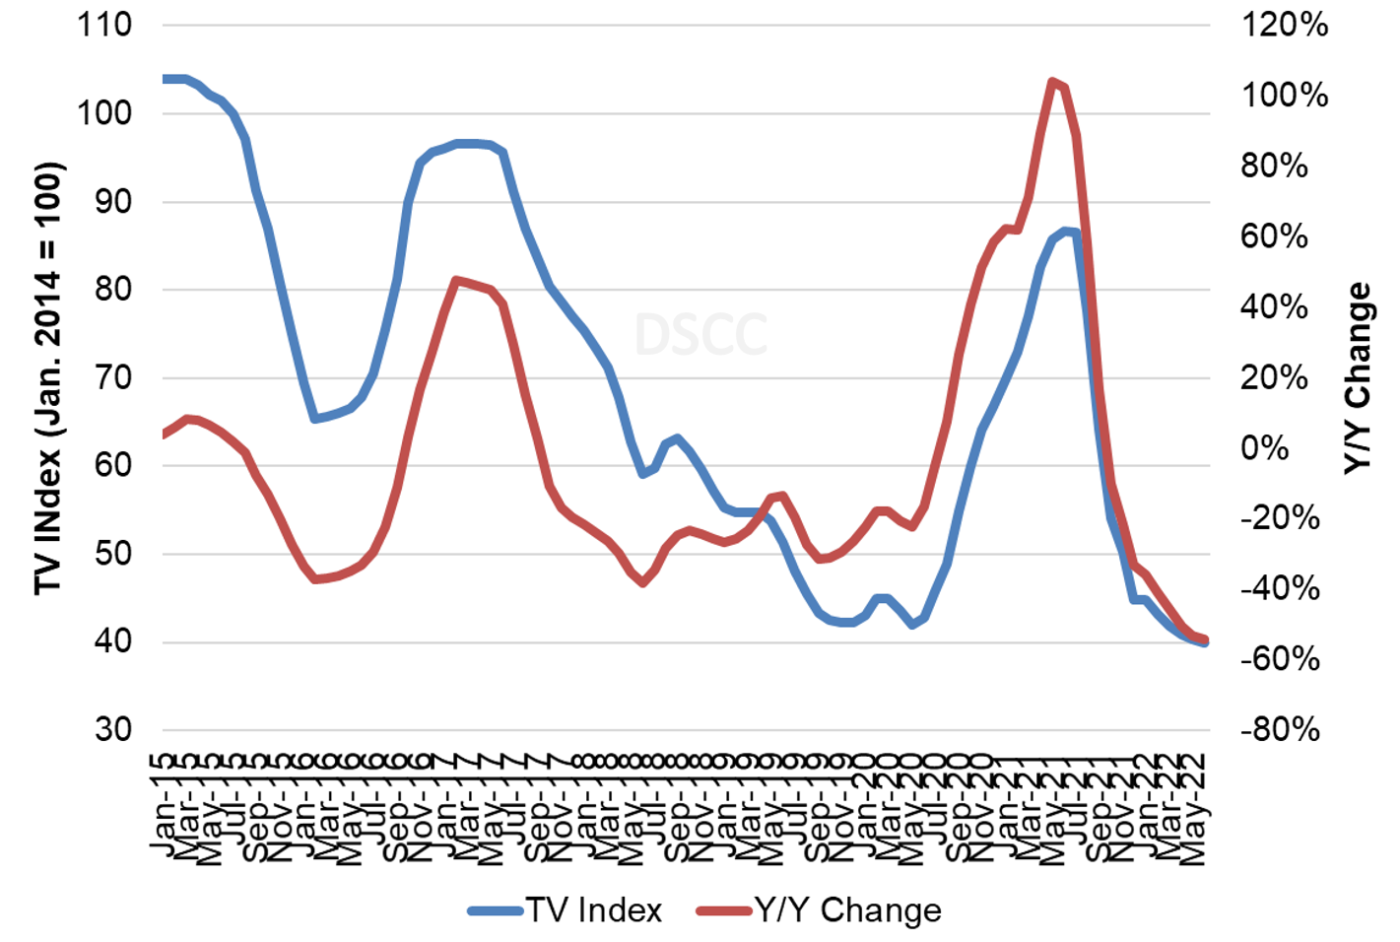
The last chart here shows our TV price index, set to 100 for prices in January 2014, and the Y/Y change of LCD TV panel prices. Our index increased from its all-time low of 42 in May 2020 to 87 in June 2021, but prices already declined to 45 in January. We now expect the index to decline to 41 by April, 50% lower than March 2021 and representing an all-time low for LCD TV panel prices. Although we don’t expect every screen size to hit all-time lows in Q1, 75” panels already hit an all-time low in January and we expect 65” to hit an all-time low by May.
TV Panel Price Index and Y/Y Change, January 2015 - June 2022
With the COVID-19 demand surge assisted by shortages in glass and DDICs, we saw a historic year of increases in panel prices, and panel makers post their most profitable quarter ever in the second quarter of 2021. Profits declined in Q3 but not by much, and the third quarter of 2021 was the second-best quarter ever for panel maker profitability, surpassed only by its predecessor. For Q4, from the preliminary numbers available it appears there was a divergence in performance, with some panel makers feeling the full effects of lower prices while others managed to avoid the worst. As reported thus far:
- The only panel maker to report full financial results, LGD reported revenues up 19% Q/Q but net income down 62% and net margin decreased from 6% to 2%. LGD’s revenue gain was attributed to increased shipments of mobile panels. The combination of lower TV prices and LGD’s loss-making mobile OLED business led to lower net income;
- In a preliminary release labeled a “forecast”, BOE reported Q4’21 revenue in the range of $8.1B-$8.9B, compared to $8.7B in Q3. BOE reported a net profit of $0.9B and a net margin of 11%, down only 2% from Q3’21;
- AUO has reported revenue for Q4 at TWD 93B, down 6% Q/Q and shipment area increased 1% Q/Q. AUO’s net margin was 20% in Q3’21, so a 6% decrease in net margin would leave it at a still-healthy 14%;
- Innolux reported revenue for Q4 at TWD 80B, down 14% Q/Q. Innolux also reported 20% net margin in Q3’21, but the larger decrease in revenue implies a bigger decline in margins;
- CSOT also gave a “forecast” with revenues of $2.7B, down 23% compared to Q3. Revenue from large-area panels declined by 31% Q/Q while shipment area increased 3% Q/Q. CSOT reported a net margin of 15% in Q3 but this likely fell dramatically in Q4 and perhaps went negative;
- Caihong group, the parent of CHOT, released a “forecast” that implied a net loss of $120-$144M in Q4’21, compared to a profit of $96M in Q3. While the net loss may include one-time restructuring charges for Caihong’s glass business, the company clearly suffered from lower panel prices.
