Q2’23のFPDメーカー業績レビュー~利益率は改善も苦境は変わらず、依然残るSamsung Displayと他社との差
出典調査レポート Quarterly Display Supply Chain Financial Health Report の詳細仕様・販売価格・一部実データ付き商品サンプル・WEB無料ご試読は こちらから お問い合わせください。
これらDSCC Japan発の分析記事をいち早く無料配信するメールマガジンにぜひご登録ください。ご登録者様ならではの優先特典もご用意しています。【簡単ご登録は こちらから 】
冒頭部和訳
FPDメーカー全社のQ2’23財務実績報告が完了したことを受け、DSCCでは業界プロファイルを更新した。DSCCの Quarterly Display Supply Chain Financial Health Report は上場FPDメーカー13社を追跡しており、企業の財務情報開示に基づいている。
Q2’23は大半のFPDメーカーで利益率が改善したが、業界ではSamsung Displayとその他の全メーカーとの間に大きな溝が残っている。LCDメーカー各社はパネル価格上昇と稼働率向上によって業績が改善したが、大半のメーカーは依然として損益分岐点をはるかに下回っている。OLEDに重点を置く他のFPDメーカーにとって、利益確保は依然として遠い夢だ。一方、Samsung Displayは季節的な売上低迷はあったがそれを乗り越え、引き続き強力な利益を計上した。
1つ目のグラフは上場FPDメーカー13社の四半期別出荷額を示している。総出荷額は前期比9%増、前年比10%減の238 億ドルとなり、過去最高だったQ4’21の382億ドルから38%減少した。TV用LCD価格の上昇により、LCDに重点を置くほとんどのメーカーで出荷額が増加したが、スマートフォン市場の低迷により、各社とも前年比ベースでは出荷額が減少している。Samsung Displayの出荷額は前期比6%減、前年比19%減で、BOEの出荷額は前期比8%増、前年比%減となっている。LGDの出荷額は前期比4%増、前年比18%減で、赤字のLCDからシフトしたものの、OLEDの出荷額ではその穴埋めができなかった。
Q2’23 Flat Panel Display Financials Review: Margins Improving But Still Awful, Gap Between Samsung Display and Others Persists
※ご参考※ 無料翻訳ツール (DeepL)
Now that all of the industry’s flat panel display makers have reported their Q2’23 financial results, we update our industry profile. DSCC’s Quarterly Display Supply Chain Financial Health Report covers the 13 publicly traded panel makers and is based on company financial disclosures.
In the second quarter of 2023, profitability improved for most panel makers but the gaping chasm between Samsung Display and all of the other companies in the industry persists. For LCD makers, the increase in panel prices and higher utilization led to improved outcomes, but most companies remained far below breakeven. For other FPD makers focusing on OLED, profits remain a faraway dream. Meanwhile, although it weathered a seasonal slowdown in sales, Samsung Display continued to book strong profits.
The first chart in this section shows quarterly revenues for FPD makers. Total revenues increased by 9% Q/Q but decreased by 10% Y/Y to $23.8B, down 38% from their all-time high of $38.2B in Q4’21. With rising prices for LCD TV panels, most LCD-focused companies saw revenues increase, but with the soft smartphone market every company saw revenues decline on a Y/Y basis. Samsung Display revenues decreased 6% Q/Q and 19% Y/Y while BOE revenues increased 8% Q/Q but decreased 9% Y/Y and LGD revenues increased 4% Q/Q but declined 18% Y/Y as the company shifted away from loss-making LCD and OLED revenues failed to plug the gap.
Flat Panel Display Maker Revenues
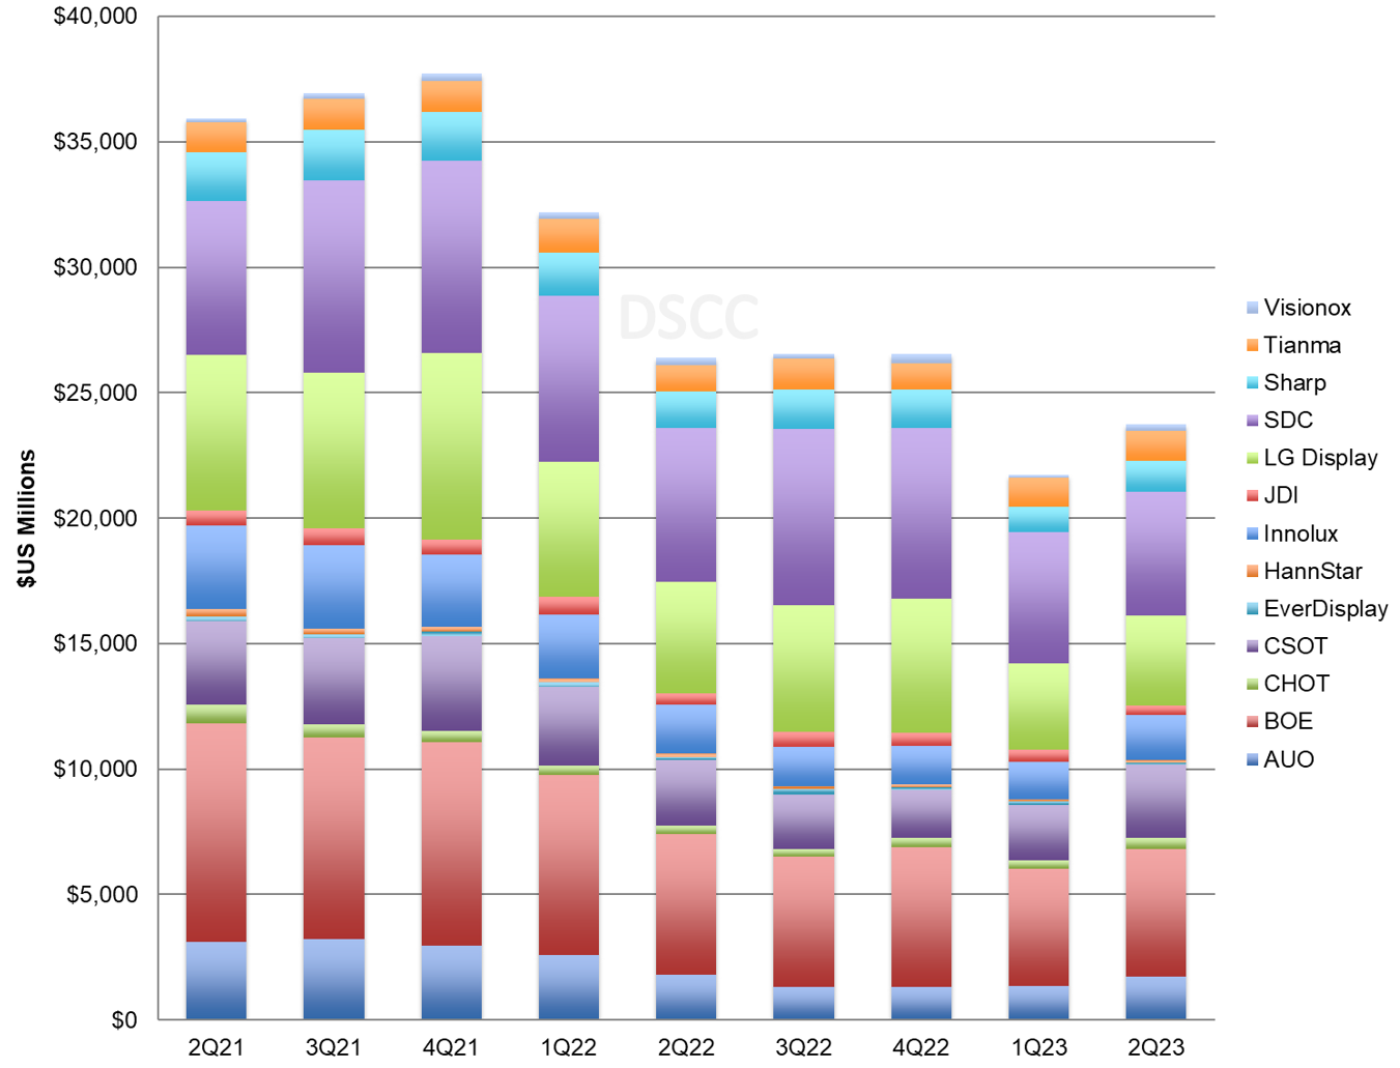
With SDC and BOE going in opposite directions for sequential revenues, BOE narrowly overtook SDC for #1 in revenues. SDC’s share of FPD revenue decreased to 20.7% while BOE’s share increased to 21.4% and LGD’s share fell to 15.2% in the quarter. The shares for LCD-centric AUO, Innolux and CSOT all increased modestly in Q2’23 as sequential revenues at those companies increased faster than the industry as a whole.
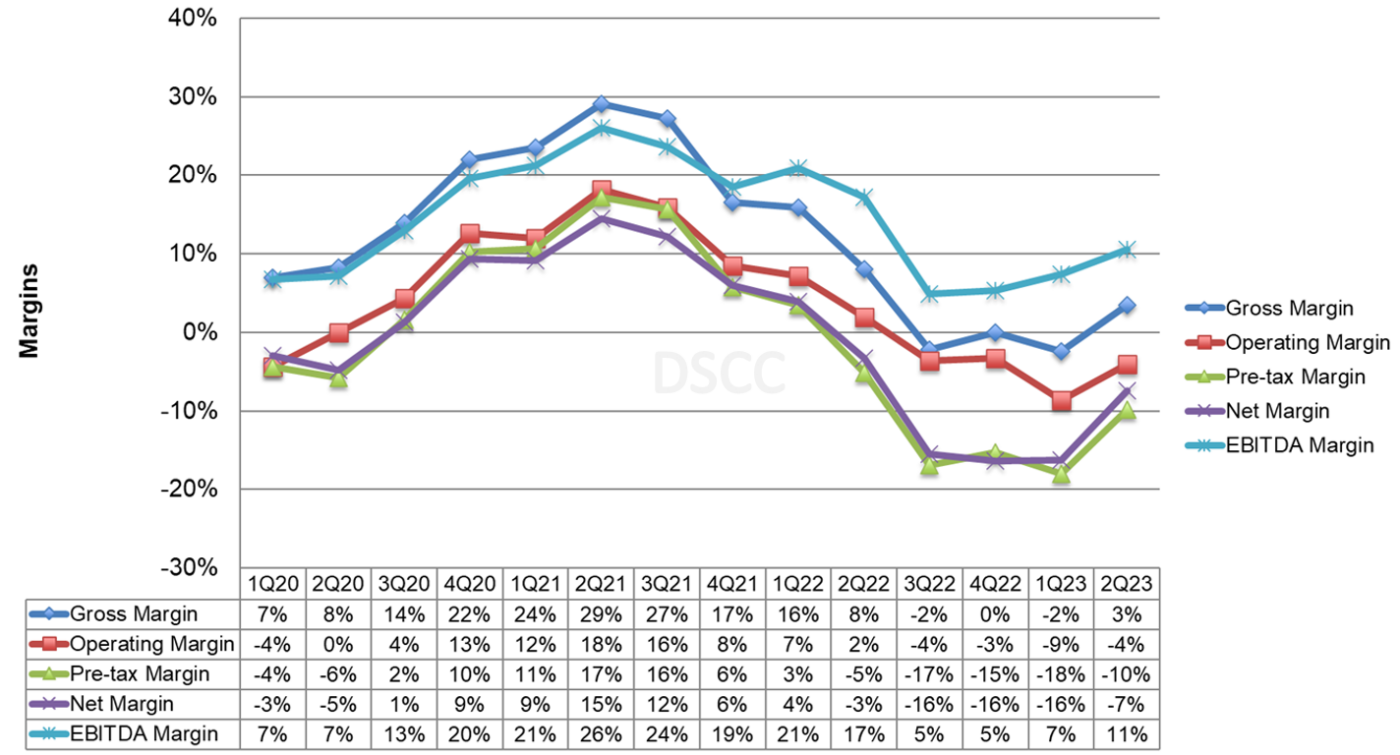
The effect of the Crystal Cycle is clearly shown on the next chart of industry margins. The pandemic-fueled increase in LCD panel prices for TVs and IT products increased gross margins and EBITDA margins for five straight quarters to a peak in Q2’21. The down part of the cycle started in Q3’21 and reached a low point in Q3’22. After three quarters of an “L-shaped recovery” margins improved noticeably in the second quarter, with all margins improving by 4-9%. However, margins remain 15-27% below their all-time high in Q2’21.
Note that while operating margin figures include SDC, all other metrics exclude SDC because Samsung does not provide a full income statement at the business segment level. SDC’s positive OPM% brings up the industry average substantially; excluding SDC the industry’s operating margin was -9% in Q2.
Display Industry Margins
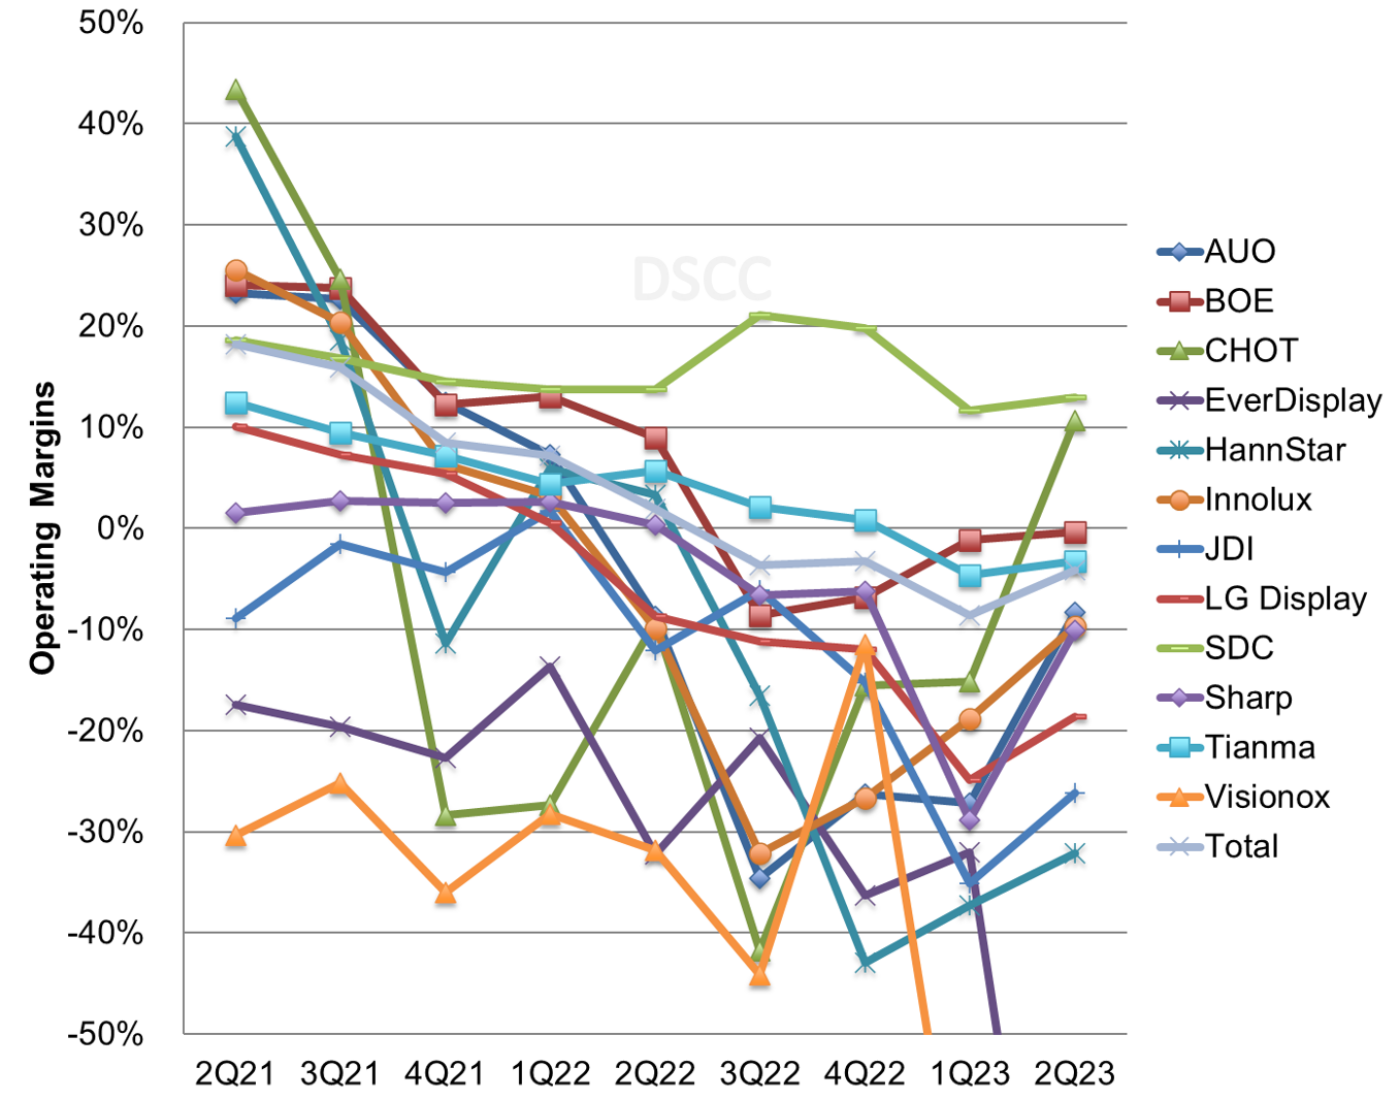
The next chart showing operating margins demonstrates the huge gap between Samsung Display and all other companies in the industry. While LCD-focused companies’ profits surged in 2021, the fortunes of these companies have fallen precipitously while SDC’s profitability has been maintained. With severely reduced sales and negative gross margins, both Visionox and EverDisplay have fallen off the scale of this chart with OPMs of -57% and -100%, respectively. While most LCD-centric companies saw margins improved, CHOT was notable for a huge improvement of 26% in operating margin, far exceeding the rate of LCD TV panel price increases.
Panel Maker Operating Margin %
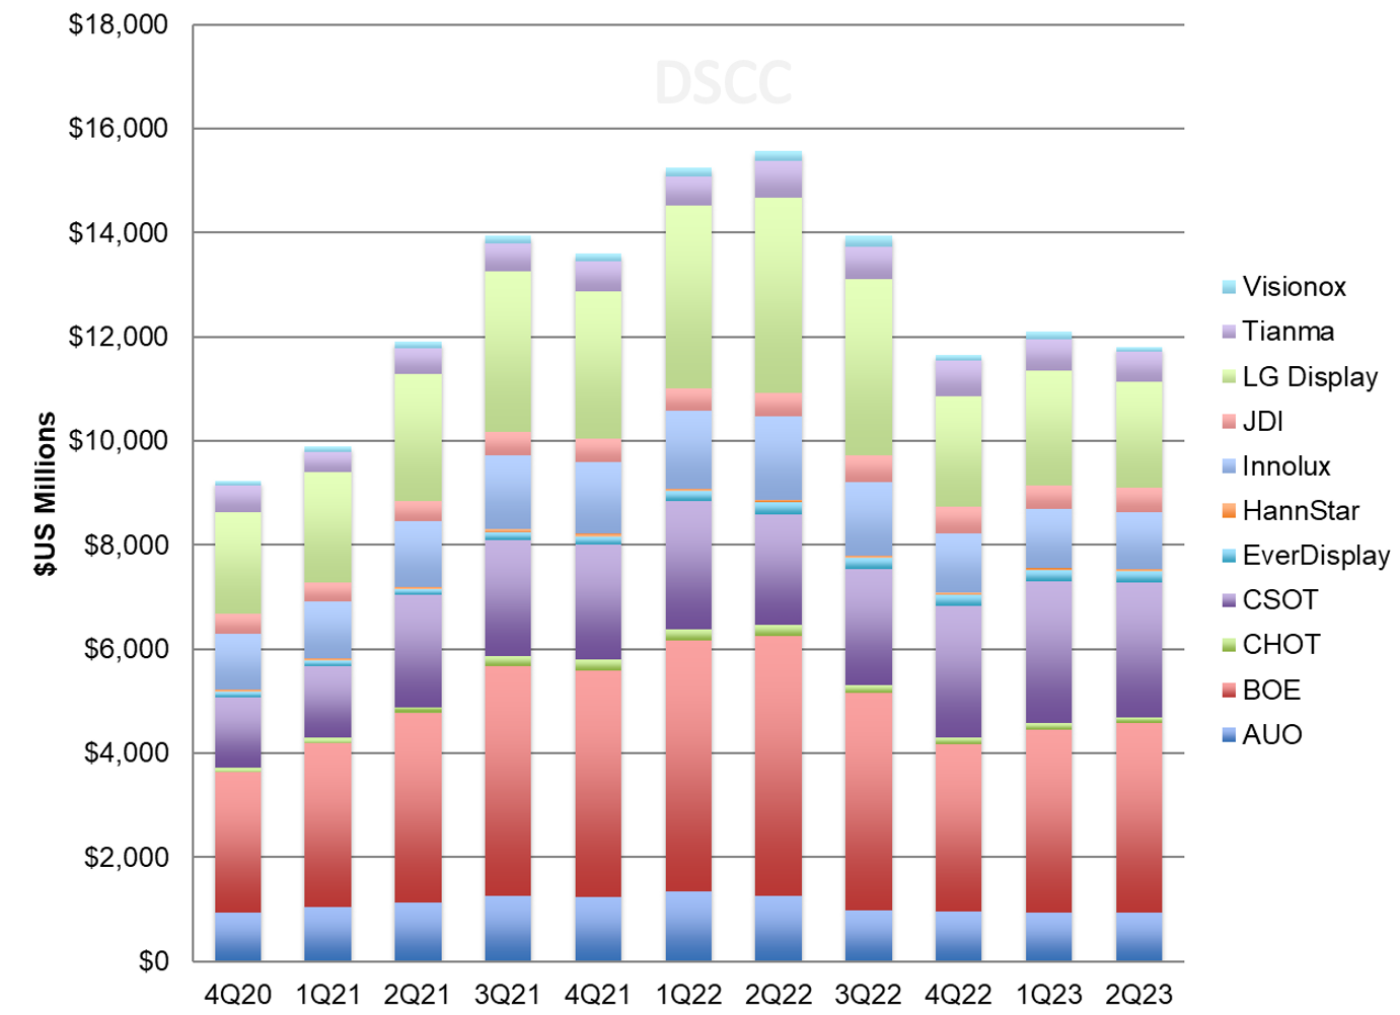
Turning to company balance sheets, we see that inventories have normalized at panel makers since the downturn in 2H’22. Inventory decreased by 2% Q/Q and 24% Y/Y in Q2’23 and with higher revenues inventory days decreased by 8 days to 67. Industry remains higher than during the pandemic demand surge when panels were in shortage, but it can be characterized as healthy.
Panel Maker Inventory Value
The industry saw its best upswing of the Crystal Cycle in 2020-2021 and its worst downswing in 2022-2023. It appears that the worst of the downturn is over, but conditions have not improved enough to realize profits. The recovery in Q2’23 centered on companies which concentrate on LCD panels for large-area applications, including the Taiwan panel makers but also CHOT, BOE and CSOT in China. Companies that focus on small LCD or OLED, such as HannStar, Tianma, EverDisplay and Visionox continued to struggle. Meanwhile, Samsung Display remains uniquely profitable in making OLED display panels.
With LCD panel prices showing continued increases in Q3’23, we are likely to see that operating results for LCD makers improve further in the second quarter, but it remains a long climb upward toward profitability for most companies in the industry.
出典調査レポート Quarterly Display Supply Chain Financial Health Report の詳細仕様・販売価格・一部実データ付き商品サンプル・WEB無料ご試読は こちらから お問い合わせください。
