Q1'23のFPDメーカー各社の業績分析
出典調査レポート Quarterly Display Supply Chain Financial Health Report の詳細仕様・販売価格・一部実データ付き商品サンプル・WEBご試読は こちらから お問い合わせください。
これらDSCC Japan発の分析記事をいち早く無料配信するメールマガジンにぜひご登録ください。ご登録者様ならではの優先特典もご用意しています。【簡単ご登録は こちらから 】
冒頭部和訳
FPDメーカー全社のQ1’23業績発表が完了したことを受け、DSCCでは業界プロフィールを更新した。第1四半期にはSamsung Displayと、その大半がLCD技術に注力している他社との間に大きな差があることが明らかになった。LCDメーカーにとっては3四半期連続の厳しい赤字決算となっている。OLEDに注力している他のFPDメーカーにとっても、利益はまだ遠い夢だ。一方、Samsung Displayは季節変動による売上低迷はあったものの、強力な利益計上を続けている。
Q1’23 FPD Financials Highlight Wide Gap Between Samsung Display and the Rest
※ご参考※ 無料翻訳ツール (DeepL)
Now that all of the industry’s flat panel display makers have reported their Q1’23 financial results, we update our industry profile. The first quarter showed a gaping chasm between Samsung Display and all of the other companies in the industry, most of which focus on LCD technology. For LCD makers, it was the third consecutive quarter of severe losses. Even for other FPD makers focusing on OLED, profits remain a faraway dream. Meanwhile, although it weathered a seasonal slowdown in sales, Samsung Display continued to book strong profits.
DSCC’s Quarterly Display Supply Chain Financial Health Report covers the 13 publicly traded panel makers and is based on company financial disclosures. Although US and International accounting standards call for quarterly reports to include an income statement, a balance sheet and a cash flow statement, in China the accounting standards do not require a cash flow statement and do not require results by business segment. For our analysis we have estimated Depreciation/Amortization based on Q4’22 levels to calculate EBITDA for Q1’23.
Total revenues for FPD makers decreased by 19% Q/Q and by 33% Y/Y to $21.6B, down 43% from their all-time high of $38.2B in Q4’21. With a seasonal slowdown for both TV and smartphone markets, most companies saw revenues decline sequentially, and with the softer market every company saw revenues decline on a Y/Y basis. Samsung Display revenues decreased 23% Q/Q and 21% Y/Y while BOE revenues declined 14% Q/Q and 33% Y/Y and LGD revenues declined 36% Q/Q and 36% Y/Y as the company shifted away from loss-making LCD and OLED revenues failed to plug the gap.
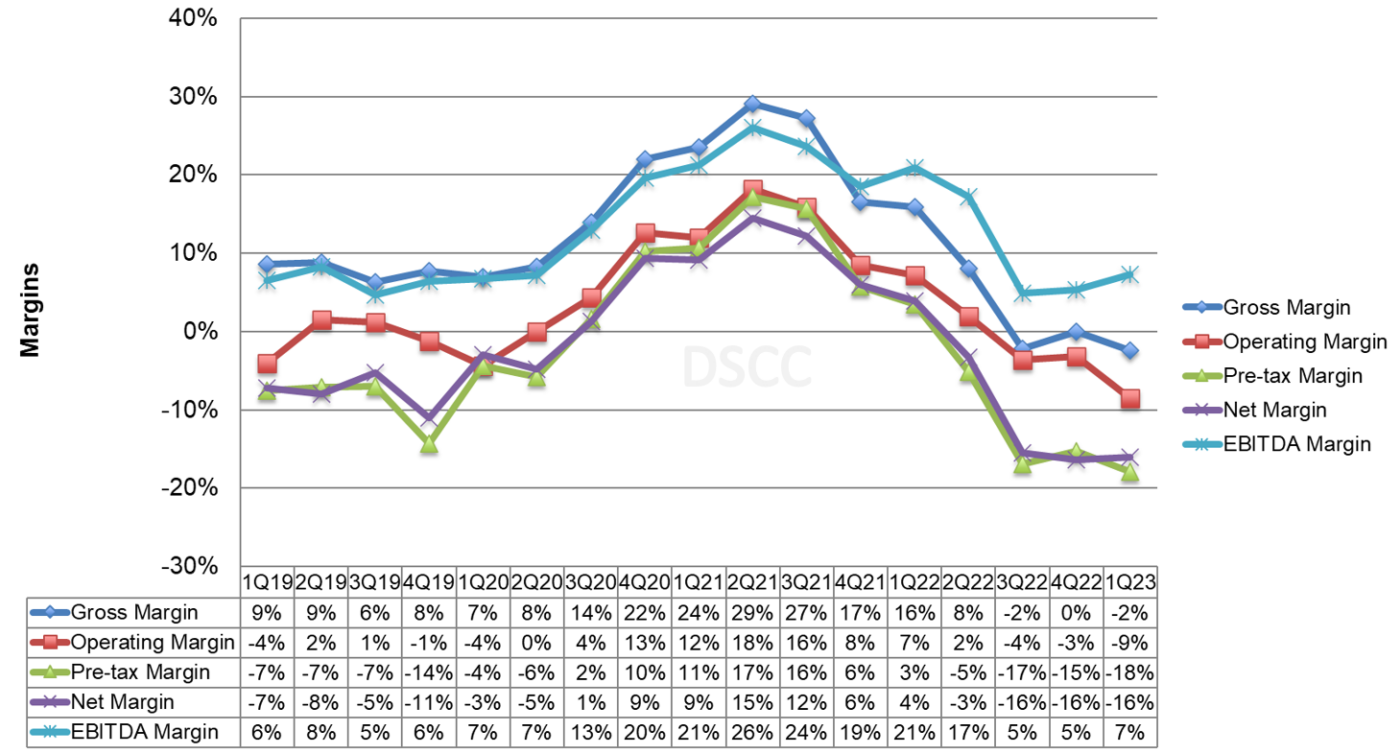
The effect of the Crystal Cycle is clearly shown on this first chart of industry margins. The pandemic-fueled increase in LCD panel prices for TVs and IT products increased gross margins and EBITDA margins for five straight quarters to a peak in Q2’21. The down part of the cycle started in Q3’21 and reached a low point in Q3’22. The last two quarters appear to be something of an “L-shaped recovery” with margins languishing at very low levels.
Note that while operating margin figures include SDC, all other metrics exclude SDC because Samsung does not provide a full income statement at the business segment level. SDC’s positive OPM% brings up the industry average substantially in Q1’23; excluding SDC the industry’s operating margin fell to -16% in Q1.
Display Industry Margins
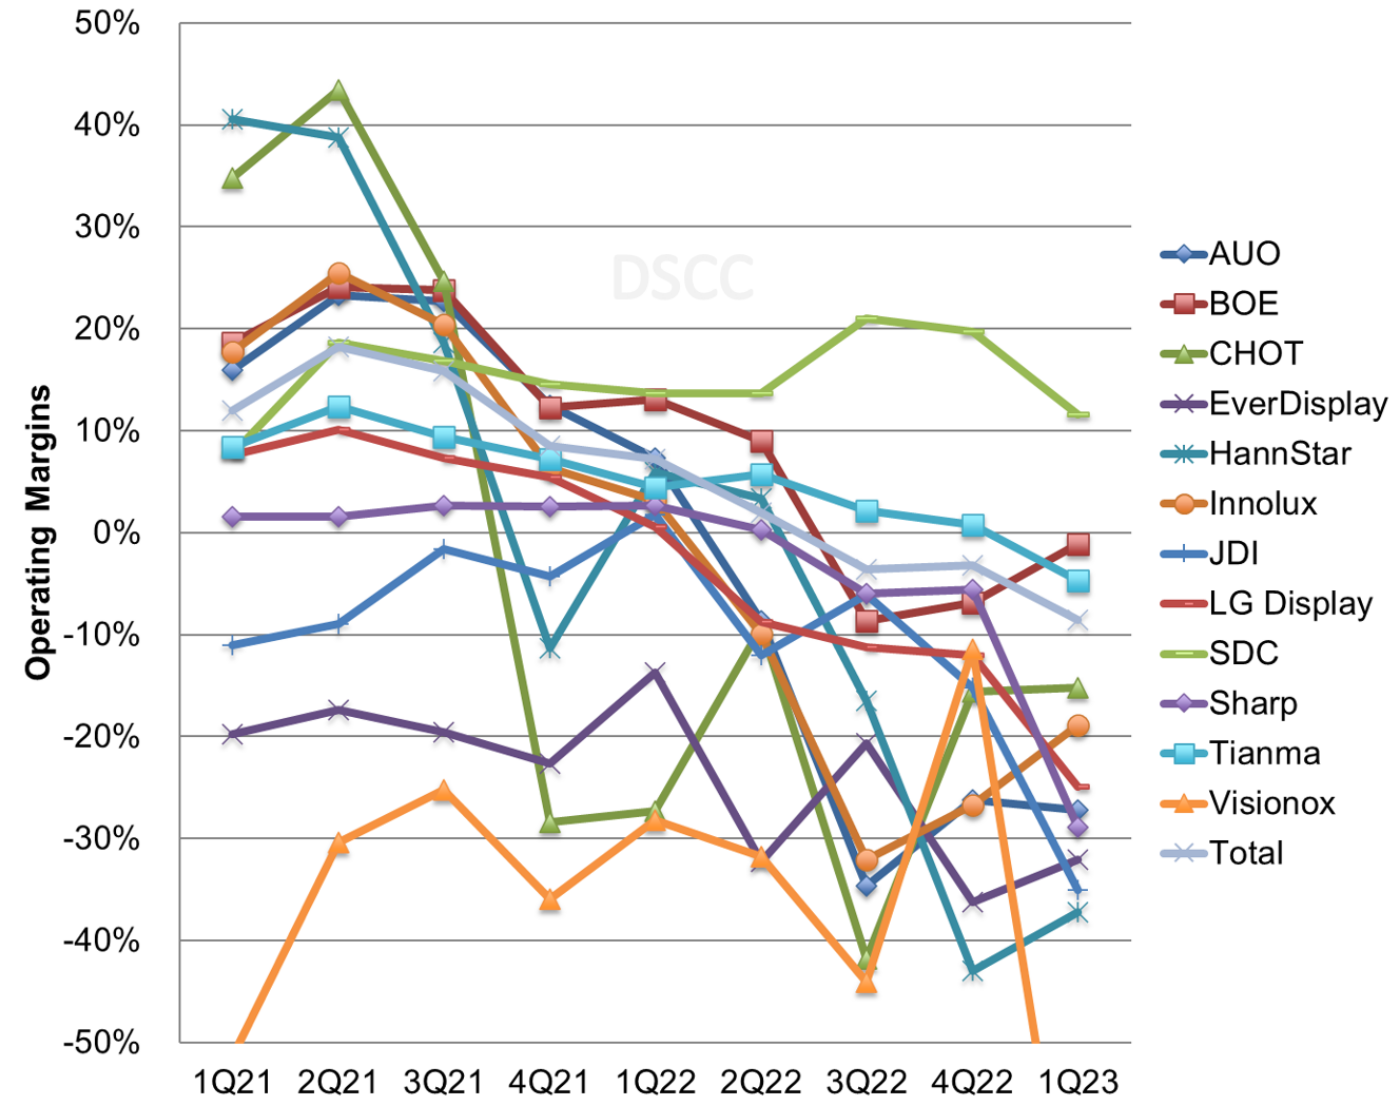
The next chart showing operating margins demonstrates the huge gap between Samsung Display and all other companies in the industry. While LCD-focused companies’ profits surged in 2021, the fortunes of these companies have fallen precipitously while SDC’s profitability has been maintained. With severely reduced sales and negative gross margins, Visionox fell off the scale of this chart with an OPM% of -76%. Besides SDC no other FPD maker reported a positive operating profit in Q1’23.
Panel Maker Operating Margin %
Net profit figures exclude CSOT, Samsung and Sharp, which do not report net profits of their display businesses. All ten companies that report net results reported a net loss in Q1’23, and the industry in total lost $2.2B in the first quarter, the fourth consecutive quarter of losses. While it was an improvement from a loss of $2.7B in Q4’22, it was a major reversal from net profits of $733M in Q1’22. Over the last three quarters, the industry has lost more than $7B.
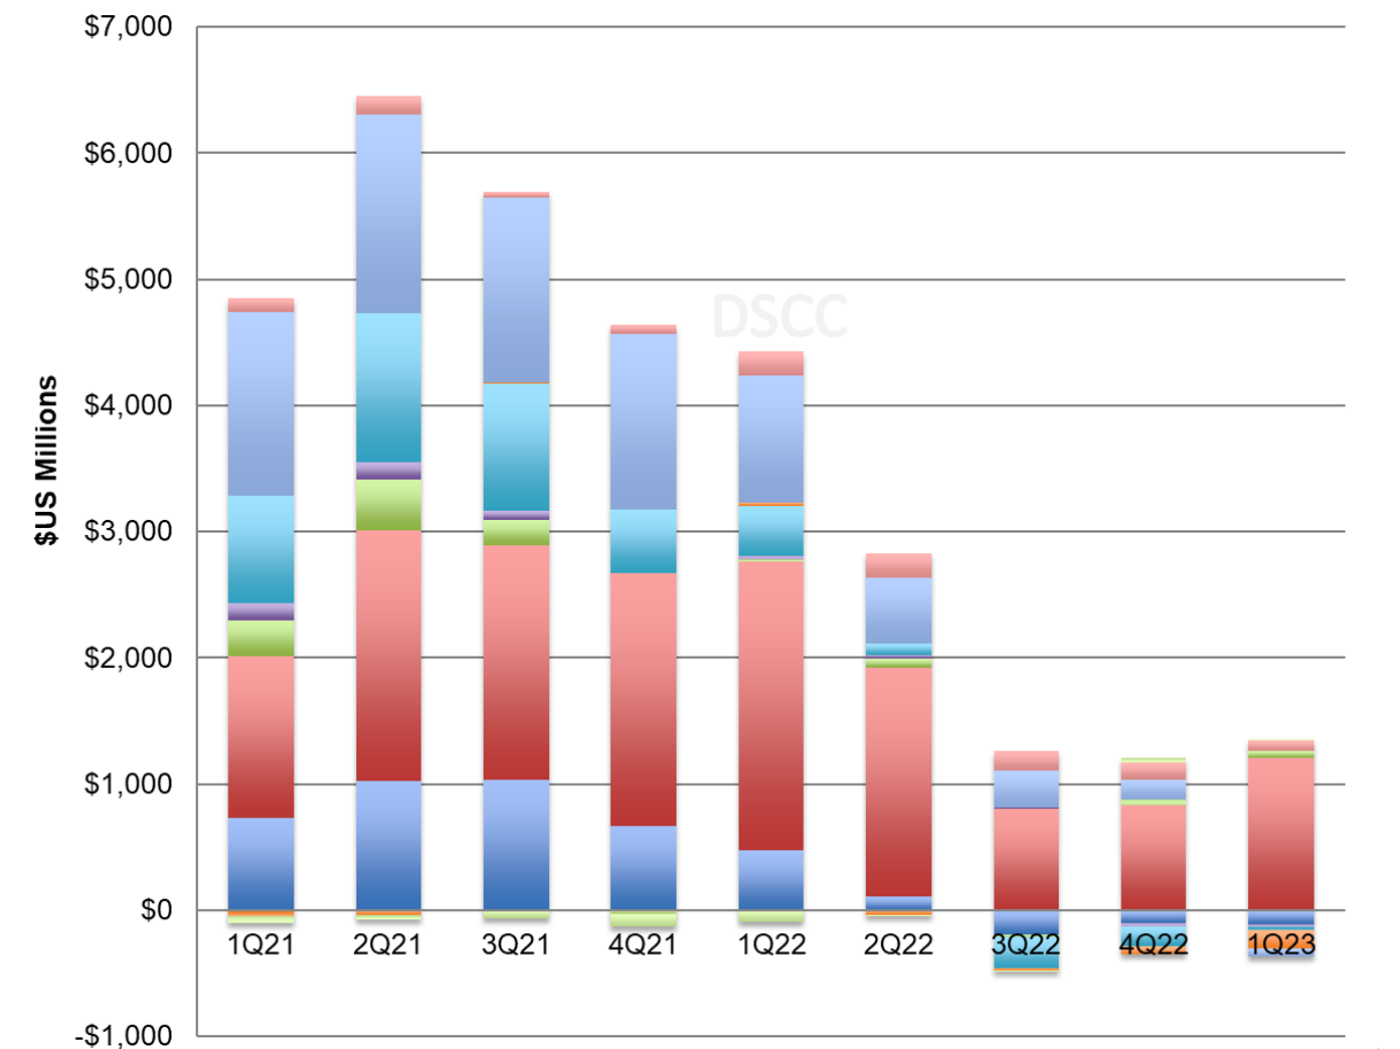
EBITDA by company is shown in the next chart, and estimated EBITDA for the industry increased by 13% Q/Q but decreased by 78% Y/Y to $975M. Since Chinese panel makers do not publish a quarterly cash flow statement, Q1’23 Depreciation & Amortization is estimated by Q4’22 DA, and EBITDA is calculated. The DA figures will be revised when the first half results are available. AUO, HannStar, Innolux, JDI and LGD reported negative EBITDA. With massive depreciation charges on its huge industrial base, BOE continued to report positive EBITDA, and BOE EBITDA increased by 45% Q/Q but declined by 47% Y/Y.
Panel Maker EBITDA
Turning to company balance sheets, we see that total inventory across the industry increased slightly, but the increase was entirely due to the two Chinese giants, BOE and CSOT. Inventory increased by about 4% or $454M from the end of December to the end of March, but they remain more than $3B lower than their peak in June 2022. With lower revenues inventory days increased by nine days Q/Q. The worst part of the inventory bubble of a year ago has dissipated, but inventory is far higher than the shortage conditions experienced in 2020.
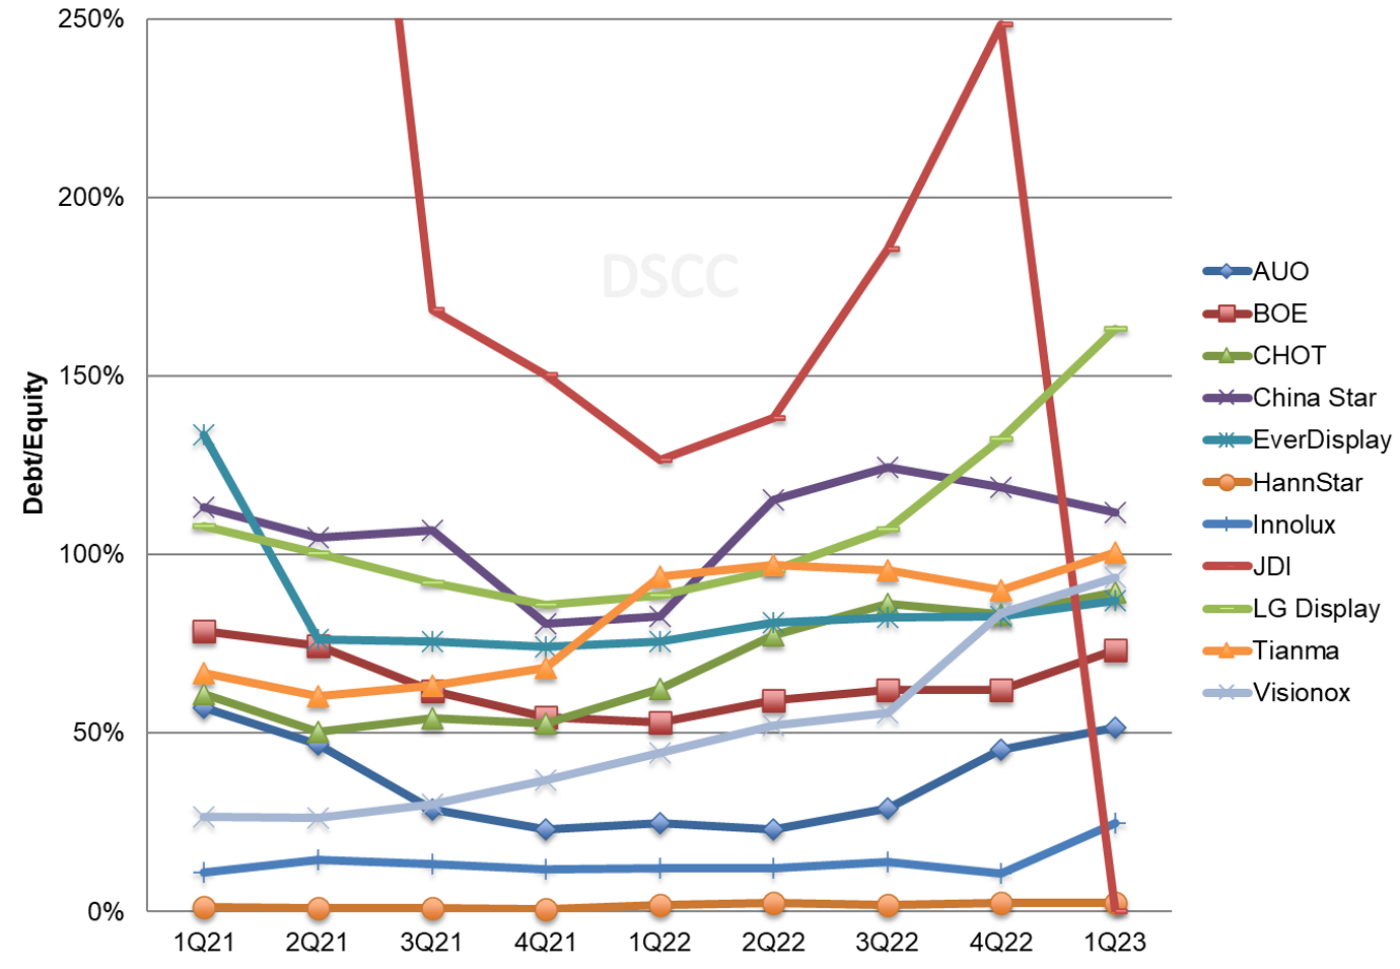
The profits during the pandemic allowed most of the panel makers to pay down debt and establish clean balance sheets, but with net losses and difficult cash positions debt to equity ratios started increasing again in Q2’22 and have continued to increase in the past three quarters. Taiwan makers AUO, Innolux and HannStar have conservative balance sheets with low or negative net debt/equity, but BOE’s D/E increased from a low of 53% in Q1’22 to 73% in Q1’23 while China Star parent TCL Technology’s increased from 83% to 112%, and LG Display’s D/E increased from 88% to 163% over the same time span. After rising to unsustainable heights, the debt load of Japan Display was wiped out in Q1’23 with a debt/equity swap taken by its largest investor Ichigo Trust. Ichigo now controls more than 93% of the company.
Panel Maker Debt/Equity
The industry saw its best upswing of the Crystal Cycle in 2020-2021 and is now seeing its worst downswing since at least 2008-2009. The companies which benefitted most during the upcycle concentrated on LCD panels for large-area applications; this includes the Taiwan panel makers but also CHOT, BOE and CSOT in China. The downcycle which started in Q3’21 first hit the companies focused on large-area LCD, but the demand slowdown has extended to OLED-focused companies including LGD, EverDisplay and Visionox. Meanwhile, Samsung Display remains uniquely profitable in making OLED display panels.
With LCD panel prices showing solid increases in Q2’23, we may see that operating results for LCD makers improve in the second quarter, but it will be a long climb upward toward profitability for most companies in the industry.
