TV用LCD価格月報~ホリデーシーズンを前に安定化
これらCounterpoint Research FPD部門 (旧DSCC) 発の分析記事をいち早く無料配信するメールマガジンにぜひご登録ください。ご登録者様ならではの優先特典もご用意しています。【簡単ご登録は こちらから 】
TV用LCD価格月報~ホリデーシーズンを前に安定化
夏の低調期を経て、TV用LCD価格がホリデー商戦を前に安定しつつある。長期的に見られた激しい価格変動のパターンと比べ、最近はかなり穏やかなパターンが続いているようだ。
一部の需要好転シグナルを受け、FPDメーカー各社はQ1'25からQ2'25にかけて稼働率を引き上げた。中国で実施された補助金制度により、TV販売は小幅ながら増加した。また、OEM各社がトランプ大統領の関税引き上げを見越して在庫確保を急いだため、ITセクターで需要が前倒しされた。Q1'25のTFT LCD投入量は前期比6%増、Q2'25の投入量は前期比横ばいと推定される。在庫積み増しが一巡するにしたがい、Q3'25は需要が鈍化し稼働率も低下した。Q3'25のTFT LCD投入量は前期比3%減と見込まれている。
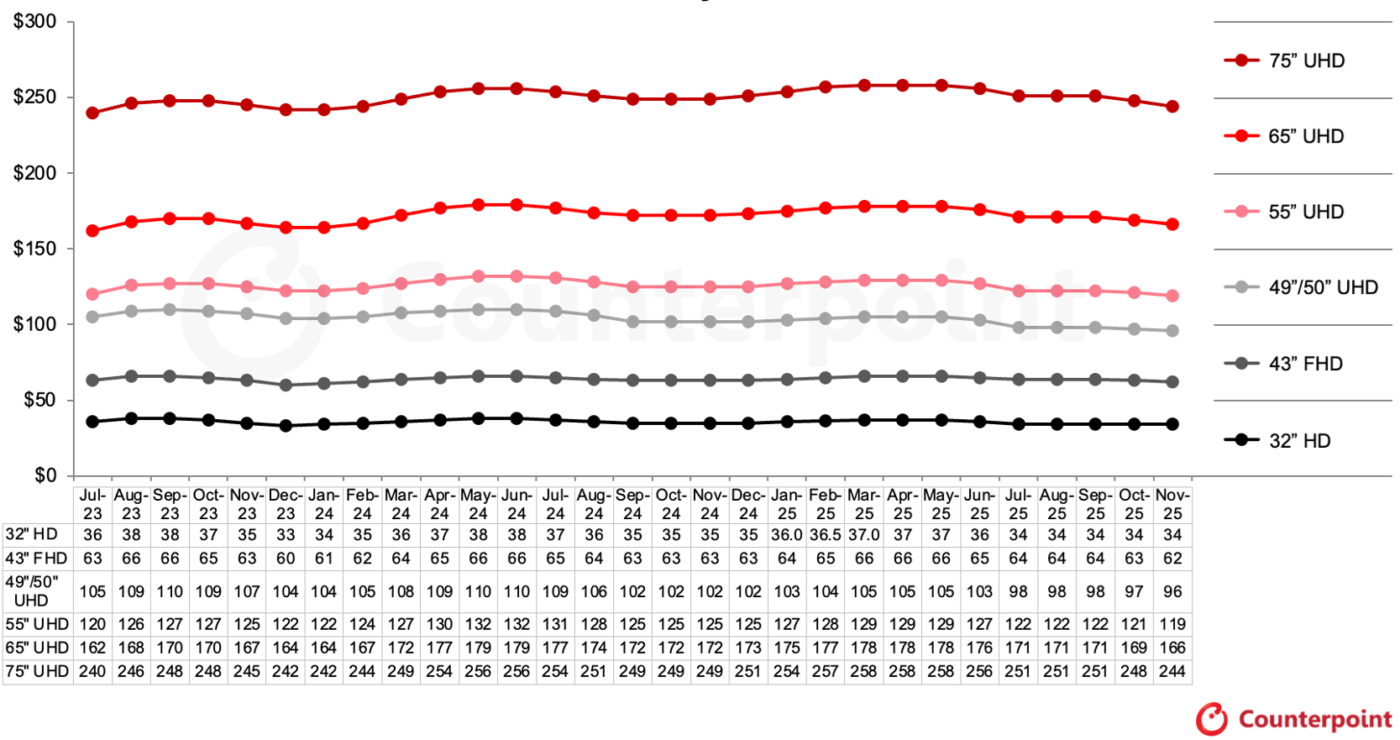
一つ目のグラフは2025年11月までのTV用LCD価格動向の最新予測である。このグラフは、安定期が開始した2023年夏から始まっている。これまでに3回の緩やかな上昇と3回の緩やかな下落が見られ、現在は3回目の下落の真っただ中にある。現時点では下落の終わりが見えず、Q4'25に入っても続くと考えられる。
8月の価格は総じて当社予測を上回った。当初は前月比で下落を見込んでいたが、大半の画面サイズで価格は安定して推移した。当社調査によると、8月の価格は前月比0.2%の下落にとどまっている。
TV用LCD価格
Q1’25の価格はQ4’24の価格を平均2.8%上回った。価格は第2四半期に下落し始めたが、平均価格は第1四半期を0.5%上回った。現在、第3四半期の価格は平均4.5%の下落が予測されており、これは2022年以来最大の前期比下落率となる。
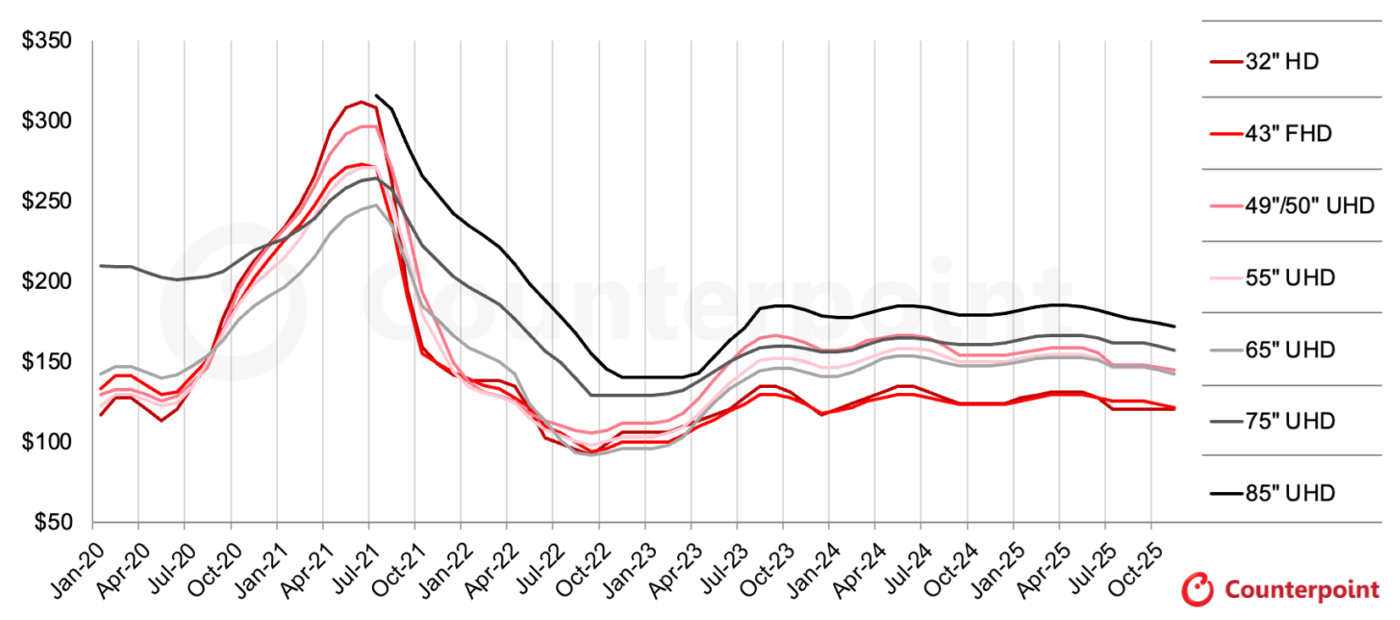
面積ベースの価格のグラフを見ると、パンデミック後の急騰と急落を経て、価格はすでに2年以上、狭い範囲にとどまっていることがわかる。この安定期では、製品は以下の3つの水準に分類される。
- 最安価格帯の製品は32インチと43インチで、最もコモディティ化したサイズである。32インチは価格が上昇すると勢いづく傾向にあるが、価格が下落すると勢いを失って後退するようだ。これら2サイズの製品は、第8.5世代 (32インチ) と第10.5世代 (43インチ) で基板1枚あたり18面取りが可能で生産効率が良い。2023年7月から2025年8月までの全予測期間中、43インチの価格は1平方メートルあたり118ドルから129ドルの間で推移している。32インチの価格は、直近の最安値である2025年8月の1平方メートルあたり117ドルを上回り、120ドルで安定すると予測される。
- 中価格帯の製品は49インチ/50インチ、55インチ、65インチで、最大サイズは通常最も高い価格帯に位置する。これらのサイズも第8.5世代 (49インチ/50インチ、55インチ) と第10.5世代 (65インチ) で生産効率が良い。これらのサイズの価格は1平方メートルあたり139ドルから167ドルの間で変動しているが、最近はこの範囲の下限付近にある。
- プレミアム価格帯の製品は75インチと85インチである。75インチは2023年に一時的に中価格帯の水準まで下落したが、現在では小型サイズに比べて10-15ドル高いプレミアムを取り戻しているようだ。85インチはこの期間中に176ドルから185ドルの間で変動し、75インチに比べて1平方メートルあたり15-12ドル高いプレミアムを維持している。しかし、11月にはその範囲の下限を割り込み、1平方メートルあたり172ドルになると予測されるが、それでも75インチの価格より15ドル高い水準にある。
TV用LCD面積価格 (1平方メートルあたり)
最後のグラフは2015年から2025年8月までの長期的視点によるTV用LCD価格指数を示している。2024年初頭の価格上昇によって指数は2024年中盤に45.6というピークを記録、2023年のピークをわずかに上回り、2022年9月の過去最低値を49%上回った。これに続く谷は2024年9月の43.1で、2025年上半期のピークは3月、4月、5月の44.8だった。価格指数は9月に2023年6月以来の最低値である41.6まで下がると予測される。
TV用LCD価格指数
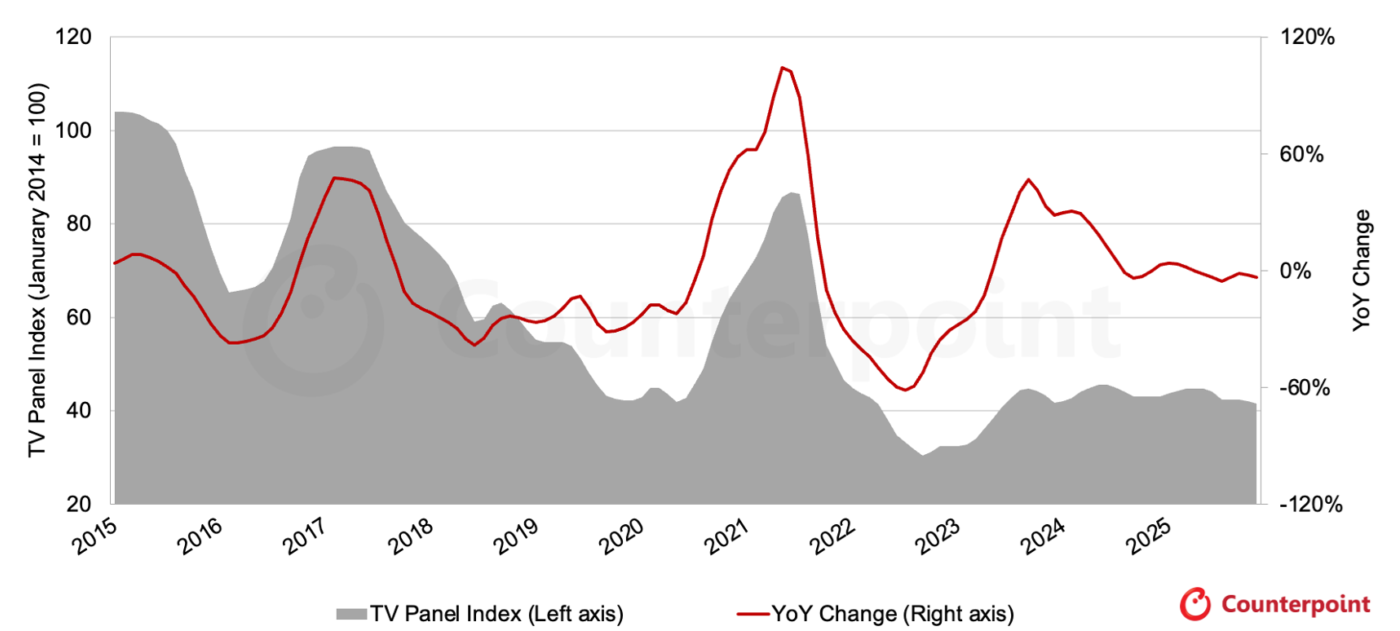
グラフの灰色の部分を見ると、2023年中盤から現在までの期間は、2015年から2023年までの期間とは根本的に異なっていることがわかる。価格の乱高下はもはや見られない。2025年8月現在、価格指数は25ヵ月間にわたって40.7から45.6という比較的狭い範囲に収まっており、少なくとも2025年11月まではこの範囲にとどまると予測される。
全体として、価格は、中国FPDメーカーが政府補助によるコスト面の優位性を背景に小幅な利益を確保でき、台湾FPDメーカーが損益分岐点付近にあるような水準で推移しているようだ。Q3'25の価格が前期比4.5%下落となれば、FPDメーカーの利益は圧迫されることになる。
[原文] LCD TV Panel Prices Stabilizing Ahead of Holiday Season
After a soft patch in the summer months, LCD TV panel prices are stabilizing as we approach the holiday sales season. The recent pattern of more gentle price fluctuations seems to be holding, and is vastly more moderate compared to the long-term pattern of wild price swings.
Some positive demand signals led panel makers to increase utilization in Q1 and Q2 2025. A subsidy program implemented in China led to a modest uptick in TV sales, while there was some demand pulled forward, especially in the IT sector, as OEMs rushed to stock inventory in anticipation of Trump’s tariffs. We estimate that TFT LCD input increased 6% QoQ in Q1 2025 and was flat QoQ in Q2 2025. As the inventory build-up subsides, softer demand in Q3 2025 has been accompanied by a slowdown in utilization. We estimate that TFT LCD input will be down 3% QoQ in Q3 2025.
The first chart here highlights our latest TV panel price update with a forecast through November 2025. The chart starts with the summer of 2023, the beginning of this period of stability. We have seen three mild rallies and three mild slumps, and we are in the middle of the third slump. At this point, we cannot see the end of the slump and expect it to extend into Q4 2025.
Most prices in August came in higher than our expectations. While we expected prices to fall MoM, prices were stable across most screen sizes. The prices in our survey decreased 0.2% MoM in August.
Q1 2025 prices were an average of 2.8% higher than Q4 2024 prices, and although prices started to decline in Q2, the average price was still 0.5% higher than Q1. We now forecast that prices in Q3 will decline by an average of 4.5%, the largest QoQ decline since 2022.
As we look at pricing in terms of area, it has now been more than two years after the pandemic boom and bust that prices have stayed within a narrow range. In this period of stability, the products fall into three levels:
- The lowest-priced products are 32” and 43”, the most commoditized sizes. 32” panels seem to get a kick when prices increase but then fall back when prices decline. These two products are efficient 18 cuts per substrate on Gen 8.5 (32”) and Gen 10.5 (43”). During the whole period from July 2023 to our forecast for August 2025, the price of 43” panels has stayed between $118 and $129 per square meter. We forecast that the 32” panel will stabilize at $120 per square meter, above its recent low point of $117 per square meter in August 2025.
- The mid-tier products are 49”/50”, 55” and 65”, with the largest size usually coming at the highest price. These sizes are also made efficiently on Gen 8.5 (49”/50” and 55”) and Gen 10.5 (65”). These panels have fluctuated between $139 and $167 per square meter and have recently been at the lower end of that range.
- The premium products are 75” and 85”. The 75” panel briefly fell to the mid-tier level in 2023 but appears to have regained a premium of $10-$15 over the smaller sizes. The 85” panel has fluctuated between $176 and $185 during this period, a premium of $15-$20 per square meter over the 75” panel, but we forecast that it will break through the lower end of that range to $172 per square meter in November, still $15 above the 75” price.
Our final chart in this sequence shows our LCD TV panel price index, taking a longer view from 2015 through June 2025. The price increases in early 2024 brought our index up to a peak of 45.6 at mid-year 2024, slightly higher than the peak in 2023 and 49% higher than the all-time low of September 2022. The next trough was in September 2024 at 43.1, and the peak in H1 2025 was at 44.8 in March, April and May. We now expect the panel price index to decline to 41.6 in November, its lowest point since June 2023.
Looking at the gray area in the chart, we can see that the period from mid-2023 to today is radically different than the period from 2015 to 2023. We no longer have wild swings in prices. As of August 2025, our price index remained within a relatively tight range of 40.7 to 45.6 for 25 months, and we expect that prices will stay within this range at least through November 2025.
Overall, prices seem to be fluctuating around a level that allows the Chinese panel makers, with a cost advantage from government subsidies, to make a small profit, while Taiwanese panel makers come close to breakeven. With Q3 2025 prices down by 4.5% QoQ, we expect that profits for these panel makers will be squeezed.
