TV用LCD価格は5月も上昇
出典調査レポート Quarterly All Display Fab Utilization Report の詳細仕様・販売価格・一部実データ付き商品サンプル・WEB無料ご試読は こちらから お問い合わせください。
これらDSCC Japan発の分析記事をいち早く無料配信するメールマガジンにぜひご登録ください。ご登録者様ならではの優先特典もご用意しています。【簡単ご登録は こちらから 】
冒頭部和訳
2月に始まったTV用LCD価格の上昇は第2四半期も続いており、FPDメーカーにとっては明るい兆しとなっている。価格上昇は劇的と言うには程遠いものの、採算が厳しいFPDメーカーにとっては一息つける状況だ。
Q4'23からQ1'24にかけてFPDメーカー各社が稼働率を抑制、各種スポーツイベントによる年央の需要に対する期待感も重なり、価格上昇圧力につながっている。DSCCの Quarterly All Display Fab Utilization Report によると、LCDメーカーの稼働率はQ3’23の85%からQ4’23とQ1’24はともに76%に減速した。LCD TFT総投入量はQ4’23に前期比11%減となり、Q1’24にはさらに前期比2%減となった。
TV需要は低調に推移しているが、FPDメーカー各社は自社在庫を低く抑えるよう自制しており、第4四半期と第1四半期の出荷数も少なかったことから、川下の在庫は減少している。在庫が減少するなか、中東での戦争による紅海航路の閉鎖によって欧州への出荷に時間がかかっている。TVメーカー各社は欧州で開催予定の2大スポーツイベント、すなわち6月のユーロ2024と8月のパリ五輪のプロモーション準備のため、出荷の早期化に取り組んでいる。
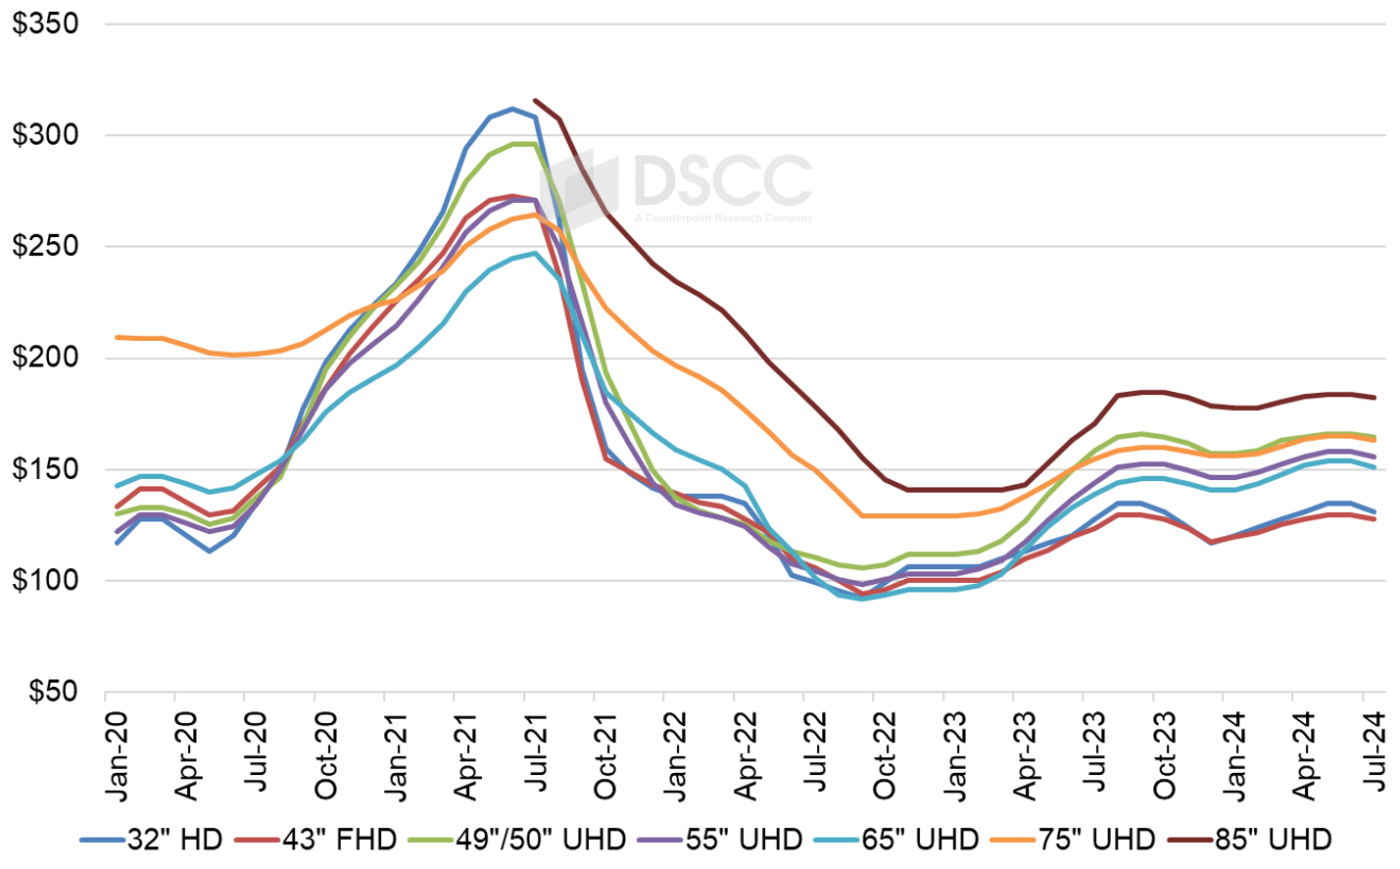
一つ目のグラフは2024年7月までのTV用LCD価格動向の最新予測である。2021年中盤から2022年夏にかけてのパンデミック後の価格急落がグラフに示されている。価格は2022年9月に過去最低値を記録し、Q4’22からQ1’23にかけて緩やかに上昇した後、Q2’23とQ3’23に大幅な上昇を示した。4月には価格が予測を上回ったものもあり、5月も価格は上昇を続けている。上昇トレンドは一段落するQ3'24に向けて続くと見られる。
LCD TV Panel Prices Increasing in May
※ご参考※ 無料翻訳ツール (Google)The rally in LCD TV panel prices which started in February is continuing in the second quarter, a favorable sign for panel makers. While the price increases are far from dramatic, they represent a respite for panel makers challenged for profitability.
The restraint in utilizations by panel makers in Q4’23 and Q1’24 has combined with some anticipation of mid-year demand from sports events, leading to upward pressure on prices. Based on DSCC’s Quarterly All Display Fab Utilization Report, LCD makers slowed their utilization from 85% in Q3’23 to 76% in both Q4’23 and Q1’24. Total LCD TFT input declined 11% Q/Q in Q4 and another 2% Q/Q in Q1’24.
Although TV demand has remained tepid, panel makers have been disciplined to keep their own inventory low and with low shipment numbers in Q4 and Q1 the downstream inventory has been reduced. In the lean inventory environment, the closure of the Red Sea shipping lanes from war in the Middle East has resulted in longer shipping times to Europe. TV makers have pushed to get shipments earlier to prepare for promotions for two big sporting events there: Euro Cup in June and the Paris Olympics in August.
The first chart here highlights our latest TV panel price update with a forecast to July 2024, starting with the tail end of the post-pandemic price plunge which ran from mid-2021 to summer 2022. Prices hit their all-time lows in September 2022 and increased modestly in Q4’22 and Q1’23 before larger price increases covered Q2’23 and Q3’23. Some prices for April came in higher than our expectations, and prices for May are continuing to increase. We expect the upward trend to plateau heading into Q3’24.
LCD TV Panel Prices July 2022 – July 2024
After double-digit percentage increases on average for LCD TV panel prices in both Q2’23 and Q3’23, we saw panel prices decline in Q4’23 by 1.9% on average, with smaller panels showing larger declines while larger panels were close to zero change Q/Q.
Prices in Q1 were nearly flat on average Q/Q, with some sizes showing small Q/Q declines and a few showing small Q/Q increases, but the pattern of prices in Q4 and Q1 sets up a robust average price increase in Q2. Prices in Q4 and Q1 conform to a “V” shape, with prices declining from October to December, reaching a bottom in December/January, and increasing from January to March. Prices in Q2 start at the top of the “V” and increase from there, so we now estimate that average Q2 prices will be 5.5% higher than Q1.
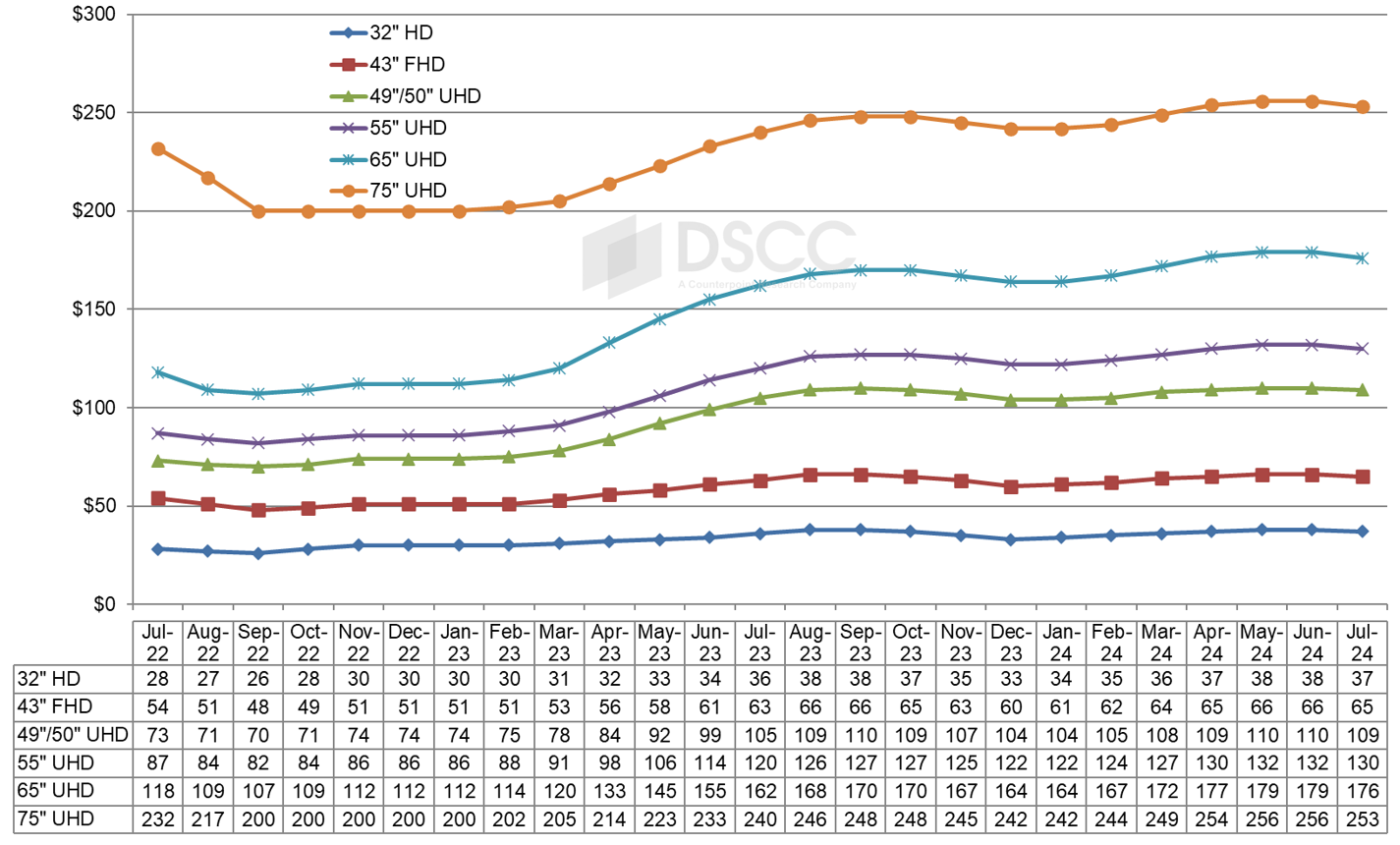
As we look at pricing on an area basis, we are seeing a pattern characteristic of a supply constraint. The smallest TV panel size in our index, 32”, is the ‘canary in the coal mine’ of pricing in the industry. The prices for 32” panels are the first to go up with a supply constraint and are the first to go down in an oversupply. We are seeing that pattern bear out in the current rally and the premium for large screens compared to 32” is narrowing.
At the most recent low point in December 2023, 32” and 43” panels had the lowest area price at $117 and $118 per square meter, respectively, but area prices were higher for 65” ($141), 55” ($146), 75” ($156) and 49/50” ($157). The area price premium for 65” panels over 32” panels was 21% in December, but with our current forecast it is reduced to 14% in May.
The prices for 49”/50” have been especially strong in this up-cycle, while prices for 43” panels are now the lowest in the industry. The premium for 49”/50” over 43” is increasing to 28% in May, which favors panel makers with Gen 8.5 capacity at the expense of those with Gen 10.5 capacity. Gen 10.5 fabs can make 43” very efficiently with an 18-up configuration, but do not have an efficient cut for 49”/50”, while Gen 8.5 fabs can make 49”/50” panels efficiently with an 8-up configuration.
Monthly Area Prices per Square Meter for LCD TV Panels, January 2020 – July 2024
Our final chart in this sequence shows our LCD TV panel price index, taking a longer view from 2015 through April 2024. The price increases in Q3 2023 brought our index up to a peak of 43.4 in September 2023, an increase of 42% compared to the low of 30.5 in September 2022. The index declined to 40.7 in December, which was down 6% from the recent peak but still up 29% Y/Y and up 34% compared to the all-time low. We now expect that prices will peak in May/June 2024 at 44.1, surpassing the recent high of September 2023 and 45% higher than the all-time low of September 2022.
LCD TV Panel Price Index January 2015 – July 2024
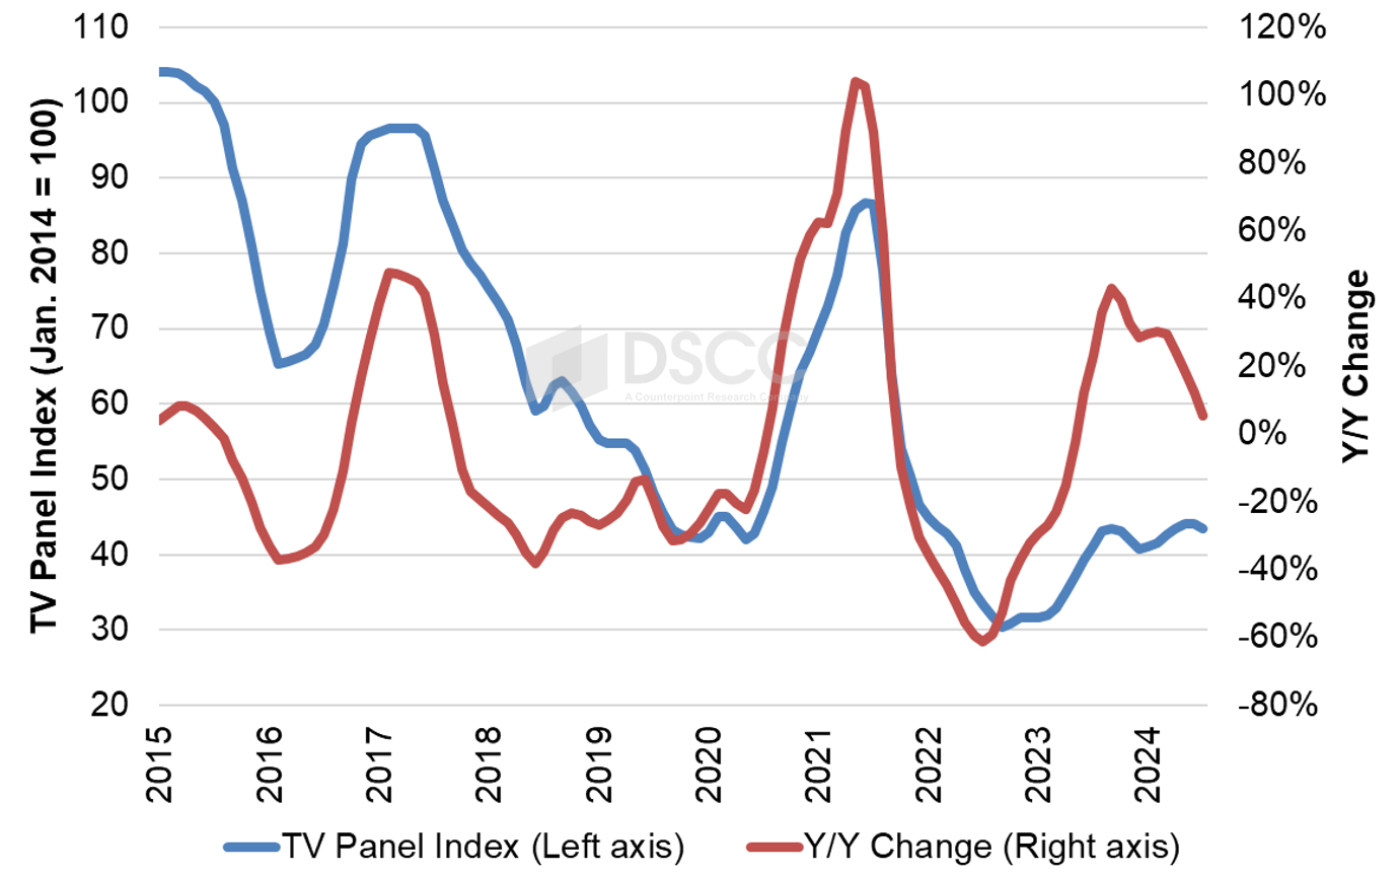
The higher LCD TV panel prices helped panel makers to improved profitability in the first quarter of 2024, as Chinese panel makers focused on large-screen panels eked out a small profit. The two big Taiwan panel makers, Innolux and AUO, continued to report losses in Q1 but both companies gave optimistic guidance for Q2.
The price increases in 2024 need to be kept in perspective. A glance at the chart above shows that in the long down-cycle from 2017 to 2020 there were several periods with modest price increases followed by another downward trend. Restraint in utilization has allowed panel makers to generate a short-term uptick, but the industry’s capacity still far outstrips the likely demand for the foreseeable future. Panel makers will need to continue their disciplined ways to avoid another down cycle in the second half of the year.
出典調査レポート Quarterly All Display Fab Utilization Report の詳細仕様・販売価格・一部実データ付き商品サンプル・WEB無料ご試読は こちらから お問い合わせください。
