TV用LCD価格の上昇は第2四半期も継続へ
出典調査レポート Quarterly All Display Fab Utilization Report の詳細仕様・販売価格・一部実データ付き商品サンプル・WEB無料ご試読は こちらから お問い合わせください。
これらDSCC Japan発の分析記事をいち早く無料配信するメールマガジンにぜひご登録ください。ご登録者様ならではの優先特典もご用意しています。【簡単ご登録は こちらから 】
冒頭部和訳
2月に始まり3月も続いているTV用LCD価格の上昇は第2四半期も継続の見通しで、FPDメーカーにとっては明るい兆しとなっている。価格上昇は劇的と言うには程遠いものの、採算が厳しいFPDメーカーにとっては一息つける状況だ。
Q4'23とQ1'24にはFPDメーカー各社が稼働率を抑制、各種スポーツイベントによる年央の需要に対する期待感も重なり、価格上昇圧力につながっている。DSCCの Quarterly All Display Fab Utilization Report によると、LCDメーカーの稼働率はQ3’23の85%からQ4’23は76%に、Q1’24には72%に抑えているものと推定される。LCD TFT総投入量はQ4’23に前期比11%減となり、Q1’24にはさらに前期比5%減が予測されている。今年の旧正月休暇は複数のFPDメーカーが通常1週間の操業停止を2週間に延長している。
LCD TV Panel Price Increases Continuing into Q2
The rally in LCD TV panel prices which started in February is continuing in March and into Q2, a favorable sign for panel makers. While the price increases are far from dramatic, they represent a respite for panel makers challenged for profitability.
The restraint in utilizations by panel makers in Q4’23 and Q1’24 has combined with some anticipation of mid-year demand from sports events, leading to upward pressure on prices. Based on DSCC’s Quarterly All Display Fab Utilization Report, LCD makers slowed their utilization from 85% in Q3’23 to 76% in Q4’23 and an estimated 72% in Q1’24. Total LCD TFT input declined 11% Q/Q in Q4 and is expected to decline another 5% Q/Q in Q1’24. This year several panel makers have extended the normal one-week shutdown for the Lunar New Year holiday and have taken a two-week shutdown.
Although TV demand has remained weak, panel makers have been disciplined to keep their own inventory low and with low shipment numbers in Q4, the downstream inventory has been reduced. In the lean inventory environment, the closure of the Red Sea shipping lanes from war in the Middle East has resulted in longer shipping times to Europe. TV makers have pushed to get shipments earlier to prepare for promotions for two big sporting events there: Euro Cup in June and the Paris Olympics in August.
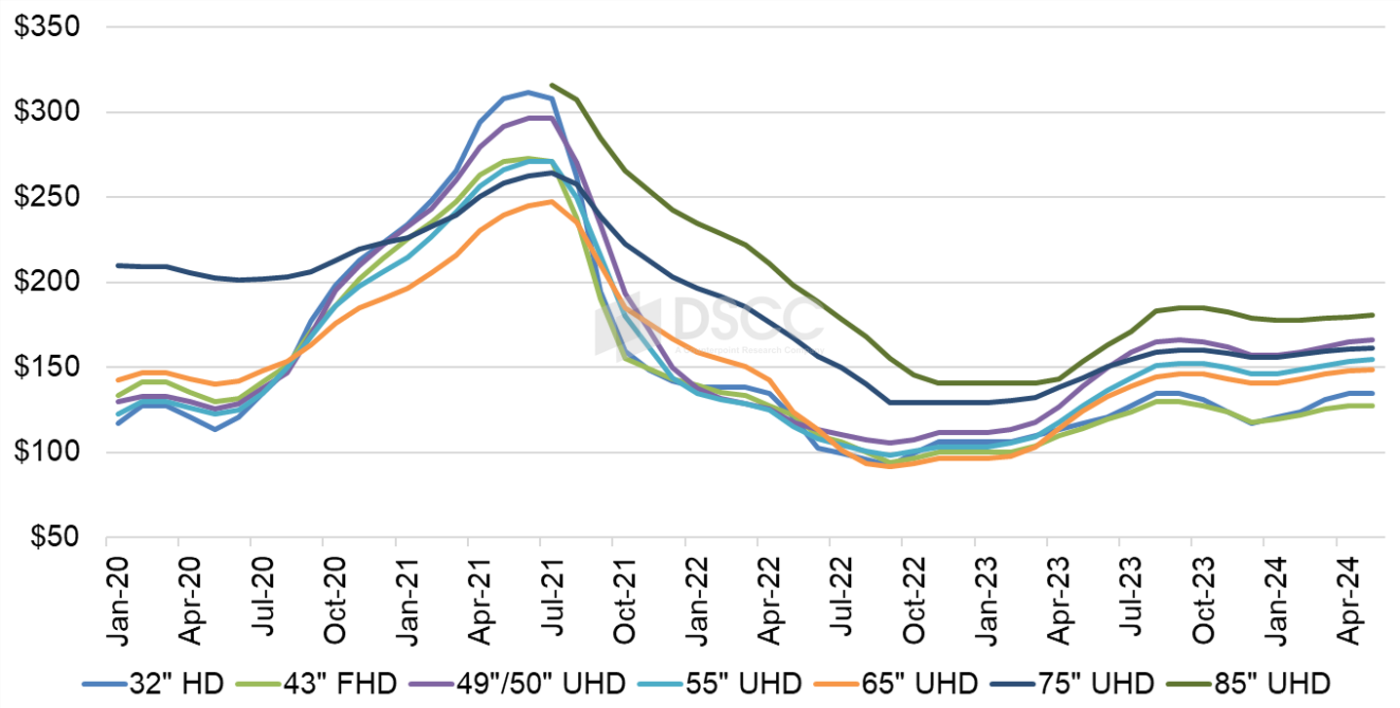
The first chart here highlights our latest TV panel price update with a forecast to May 2024, starting with the tail end of the post-pandemic price plunge which ran from mid-2021 to summer 2022. Prices hit their all-time lows in September 2022 and increased modestly in Q4’22 and Q1’23 before larger price increases covered Q2’23 and Q3’23. Some prices for February came in higher than our expectations, with increases in larger sizes. Prices for March are continuing to increase, and we expect the upward trend to continue at least until May.
LCD TV Panel Prices
After double-digit percentage increases on average for LCD TV panel prices in both Q2’23 and Q3’23, we saw panel prices decline in Q4’23 by 1.9% on average, with smaller panels showing larger declines while larger panels were close to zero change Q/Q. We now expect that prices in Q1 will be nearly flat on average, with some sizes showing small Q/Q declines and a few showing small Q/Q increases.
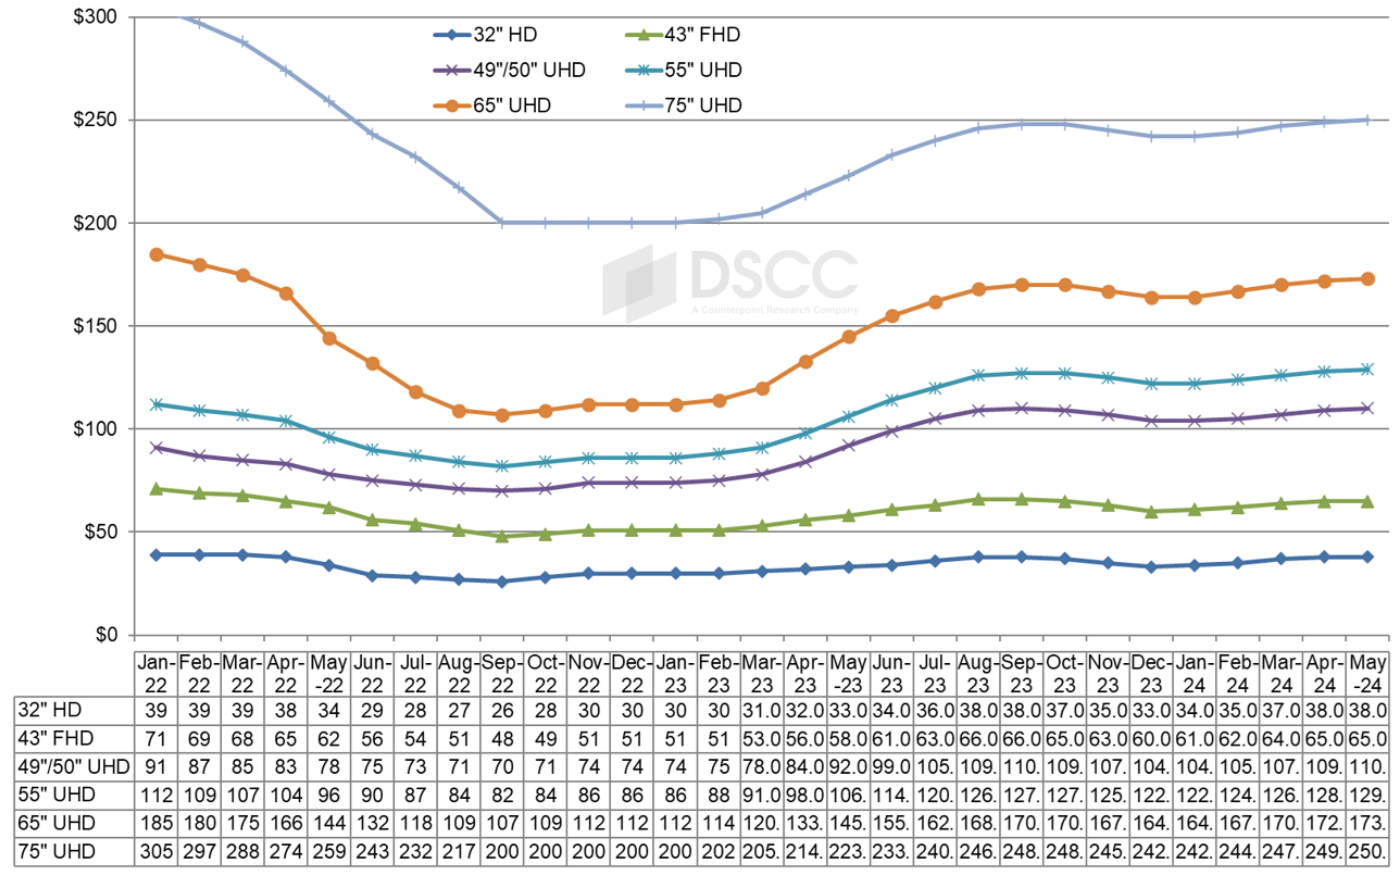
As we look at pricing on an area basis, we are seeing a pattern characteristic of a supply constraint. The smallest TV panel size in our index, 32”, is the ‘canary in the coal mine’ of pricing in the industry. The prices for 32” panels are the first to go up with a supply constraint and are the first to go down in an oversupply. Although we have only three months of price increases in our forecast, we are seeing that pattern bear out and the premium for large screens compared to 32” is narrowing.
At the most recent low point in December 2023, 32” and 43” panels had the lowest area price at $117 and $118 per square meter, respectively, but area prices were higher for 65” ($141), 55” ($146), 75” ($156) and 49/50” ($157). The area price premium for 65” panels over 32” panels was 21% in December, but with our current forecast it is reduced to 10% in April.
Monthly Area Prices per Square Meter for LCD TV Panels
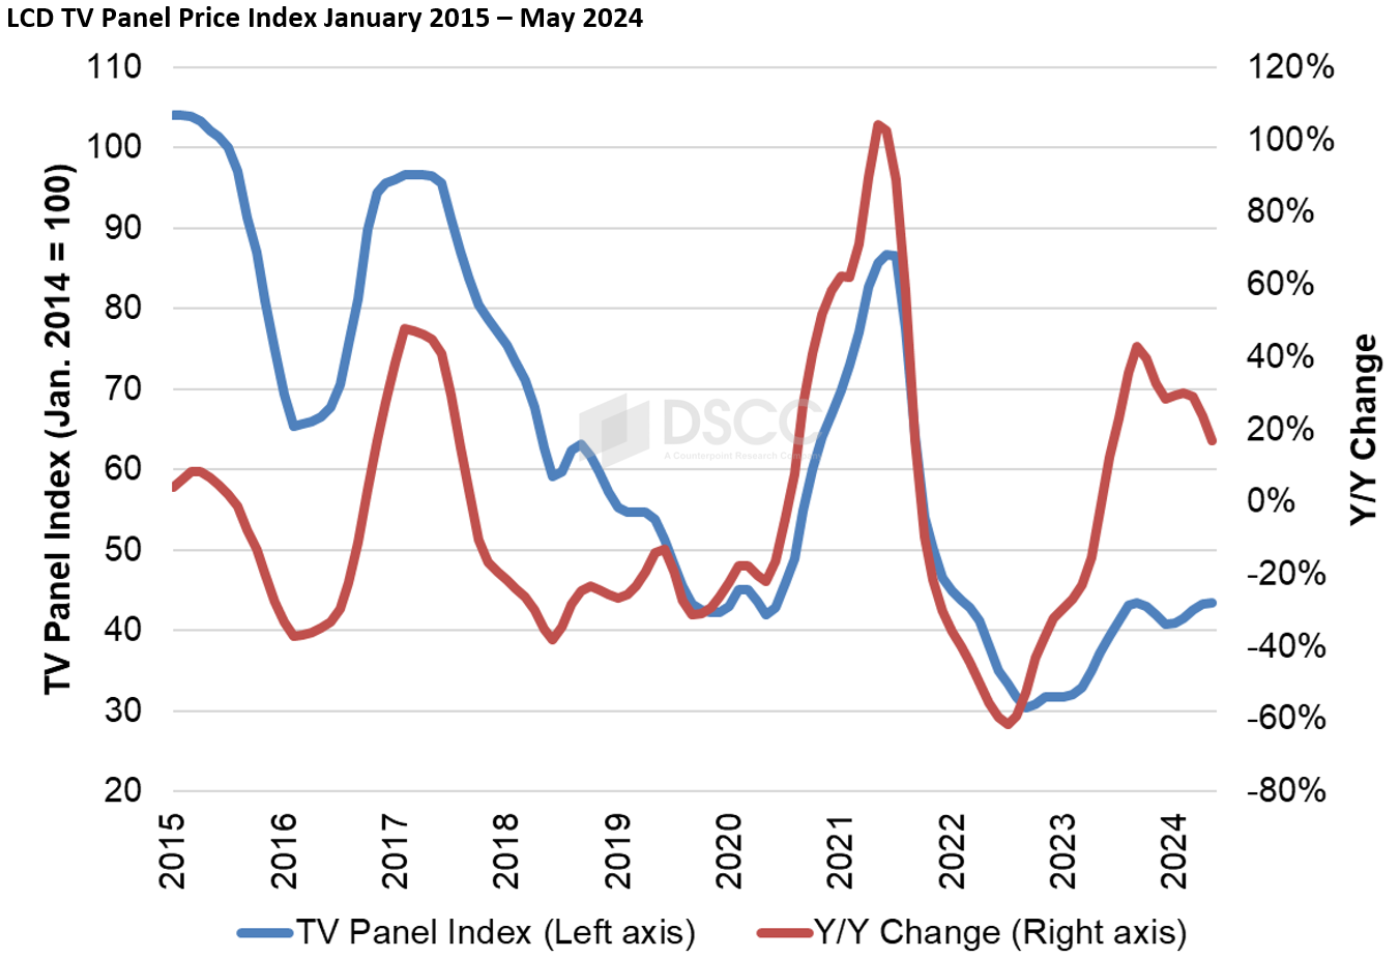
Our final chart in this sequence shows our LCD TV panel price index, taking a longer view from 2015 through April 2024. The price increases in Q3’23 brought our index up to a peak of 43.4 in September 2023, an increase of 42% compared to the low of 30.5 in September 2022. The index declined to 40.7 in December, which was down 6% from the recent peak but still up 29% Y/Y and up 34% compared to the all-time low. We now expect that by April 2024 the price index will increase to 43.3, equal to its recent high in September 2023.
LCD TV Panel Price Index
Of the companies that have reported Q4’23 results, the two Korean panel makers are largely unaffected by LCD TV pricing. Both AUO and Innolux reported larger net losses compared to Q3’23 on reduced revenues with TV accounting for 21% and 35% of revenues, respectively. We may need to wait until Chinese panel makers issue their full annual reports in March to get a clear picture of the impact of the price declines in Q4, but the trend in Q1’24 suggests that there is hope for an improvement in profitability.
The price increases in 2024 need to be kept in perspective. A glance at the charts here shows that in the long down-cycle from 2017 to 2020 there were several periods with modest price increases followed by another downward trend. Restraint in utilization has allowed panel makers to generate a short-term uptick, but the industry’s capacity still far outstrips the likely demand for the foreseeable future. Panel makers will need to continue their disciplined ways to avoid another down cycle in the second half of the year.
出典調査レポート Quarterly All Display Fab Utilization Report の詳細仕様・販売価格・一部実データ付き商品サンプル・WEB無料ご試読は こちらから お問い合わせください。
