日系ガラスメーカーもCorningに続いて値上げ。生産ライン稼働率上昇でガラスメーカーの第2四半期収益が増加
冒頭部和訳
5月に開催されたDisplay Week 2023の期間中、Corningがディスプレイ用ガラスの全製品20%値上げを発表しディスプレイ業界のほぼ全員を驚かせた。以降の数ヵ月間でCorningはディスプレイ用ガラス事業で高価格体系を確立し、日本の大手ガラスメーカー2社、AGCと日本電気硝子もディスプレイ用ガラス事業の収益性改善のため価格を引き上げた。その結果、ディスプレイ用ガラスの価格設定はその構造から見直されることになったようで、今後はFPDコストが上昇しFPDメーカーの利益が減少するかも (しないかも) しれない。
3社はいずれもこの2週間で第2四半期の決算発表を実施しており、3社ともディスプレイ用ガラス部門は2桁の前期比成長率を記録した。本稿ではガラスメーカー3社の業績のレビューと比較を行う。
Japanese Glassmakers Follow Corning with Price Increases; Glassmaker Q2 Revenues Increased with Higher Fab Utilization
※ご参考※ 無料翻訳ツール (DeepL)
During Display Week 2023 in May, Corning surprised nearly everyone in the display industry by announcing a 20% price increase on all of its display glass products. In the months since then, Corning has established higher prices in its display glass business and the two large Japanese glassmakers, AGC and NEG, have raised prices as well to improve the profitability of their display glass business. The result appears to be a structural reset of display glass pricing, which will increase costs for flat panel displays and may (or may not) reduce panel maker margins.
All three companies have reported their Q2 earnings results in the last two weeks, and all three companies saw double-digit % increases sequentially in their display glass segments. In this article, we review the results of all three glassmakers and provide a comparison.
Corning
A strong recovery in Corning’s Display Technologies business overshadowed weakness in other segments as the company reported a sequential earnings increase. In its earnings call on July 25th Corning claimed success in its efforts to raise glass prices and expects a double-digit % increase starting in Q3’23 without a negative impact on market share.
Corning reported a GAAP net profit of $281M on GAAP revenues of $3.24B for Q2’23. Revenues increased by 2% Q/Q but decreased by 10% Y/Y. The net profit was an increase from a Q1’23 net profit of $176M but represents a 52% decrease from the Q2’22 net profit of $584M. GAAP revenues were in line with consensus estimates but net income fell short of consensus estimates of $343M. Corning’s core revenues of $3.48B were 7% higher than consensus expectations and core net income of $388M was 13% of consensus expectations.
For years now, Corning has reported separate figures for “core” and GAAP earnings, and in most quarters, the main difference is related to changes in the exchange rate between the Japanese yen and the US dollar. According to GAAP, each quarter Corning reports non-cash, mark-to-market gains or losses associated with the company’s currency-hedging contracts. Corning reported $124M in hedging gains in the quarter as the Japanese yen weakened, and also reported $105M for restructuring charges.
Corning’s hedging contracts are an increasingly important component to manage its display business, since displays are priced in yen and Corning reports results in US dollars. Corning’s hedges allow the company to manage its display glass business at a constant exchange rate of JPY 107/$. That was roughly the actual exchange rate in 2021, but by Q4’22 the yen rate increased to as high as 150 before strengthening and ending the year at about 130/$. In January 2023, Corning CFO Ed Schlesinger, stated that the company took advantage of the short-term strengthening of the yen to purchase additional hedging contracts, and Corning is now hedged for the yen at 107/$ through 2024. After hovering in the low 130s in the first quarter, the yen weakened further in the second quarter, and as of August 3rd the yen was at 142/$.
The contrast for the Display Technologies business is illuminated by the $139M difference between Corning’s core and GAAP revenue. Corning’s display revenue for Q2’23 of $928M is a core revenue number, based on JPY 107/$. If Corning needed to exchange yen for dollars at the average exchange rate in Q2 of JPY 137/$, that revenue shrinks to $724M.
As reported in core results at a constant exchange rate of JPY 107/$, Corning’s Display Technologies business (CDT) saw revenues increasing as flat panel display makers increased utilization through Q2. Corning revenues increased 22% Q/Q and 6% Y/Y to $928M (at JPY 107/$, this translates to JPY 99.2B), and Corning indicated that pricing was consistent with Q1, so the revenue increase was entirely due to volume. DSCC estimates that Corning’s volume increased 22% Q/Q and prices decreased 0.3% sequentially. CDT operating profits increased 30% Q/Q but decreased 9% Y/Y to $208M.
The weakening of the yen in Q2 makes Corning’s price environment more complex. On a sequential basis the yen weakened by 4%, so while Corning’s prices in yen were stable, the price impact to panel makers, who effectively sell in US dollars, looked like a 4% price decrease Q/Q. On a Y/Y basis, the comparison also looks favorable to panel makers as the yen weakened by 6% Y/Y, so that the 2% Y/Y decline in yen prices translates to an 8% Y/Y decline in US dollars.
With respect to display glass volume, Corning noted that panel maker utilization increased in the second quarter and that a display industry recovery was underway. On glass pricing, Corning CFO Ed Schlesinger said that since the price increase announcement in May, customers have indicated that they understand the need. Corning expects to finalize double-digit % price increases in the third quarter and said that those price increases will begin to go into effect in Q3. Corning’s goal is to restore its display business to pre-pandemic profitability exiting Q3.
In response to a question in the earnings call, Schlesinger said that operating margins should improve to the mid-to-high twenties % as they were before the pandemic. Corning’s display business has averaged a 21% operating margin over the last four quarters.
Corning’s Specialty Materials segment (CSM), which makes Gorilla Glass and the Ceramic Shield that covers the iPhone 14, saw revenues increase by 4% Q/Q but decrease by 13% Y/Y to $423M. Operating profit decreased by 15% Q/Q and by 64% Y/Y to $33M; Corning cited the impact of continued development costs for new product launches for the reduced operating profit. In April, Corning had revealed that it would introduce a new formulation in its Gorilla Glass business in the second half of 2023 which it expects can help to offset weakness in the smartphone and IT markets. In the July earnings call Corning CEO Wendell Weeks said that Corning plans to introduce two new products, one this fall and one next year, featuring innovations that significantly increase Corning’s value per device.
Corning’s other business segments, which propped up company profits in 2022, mostly faltered in Q2’23. Corning’s Optical Communications (COC) segment saw revenues decline 5% Q/Q and 19% Y/Y and net income decreased by 12% Q/Q and 23% Y/Y as demand for passive optical network products remained weak. Corning’s Environmental Technologies business, which sells diesel and gas particulate filters to the automotive industry saw revenues increase 6% Q/Q and 28% Y/Y and profits increase 30% Q/Q and 73% Y/Y, but Corning’s Life Sciences segment saw revenues and net income decline sequentially and Y/Y.
Corning Revenue by Business Division
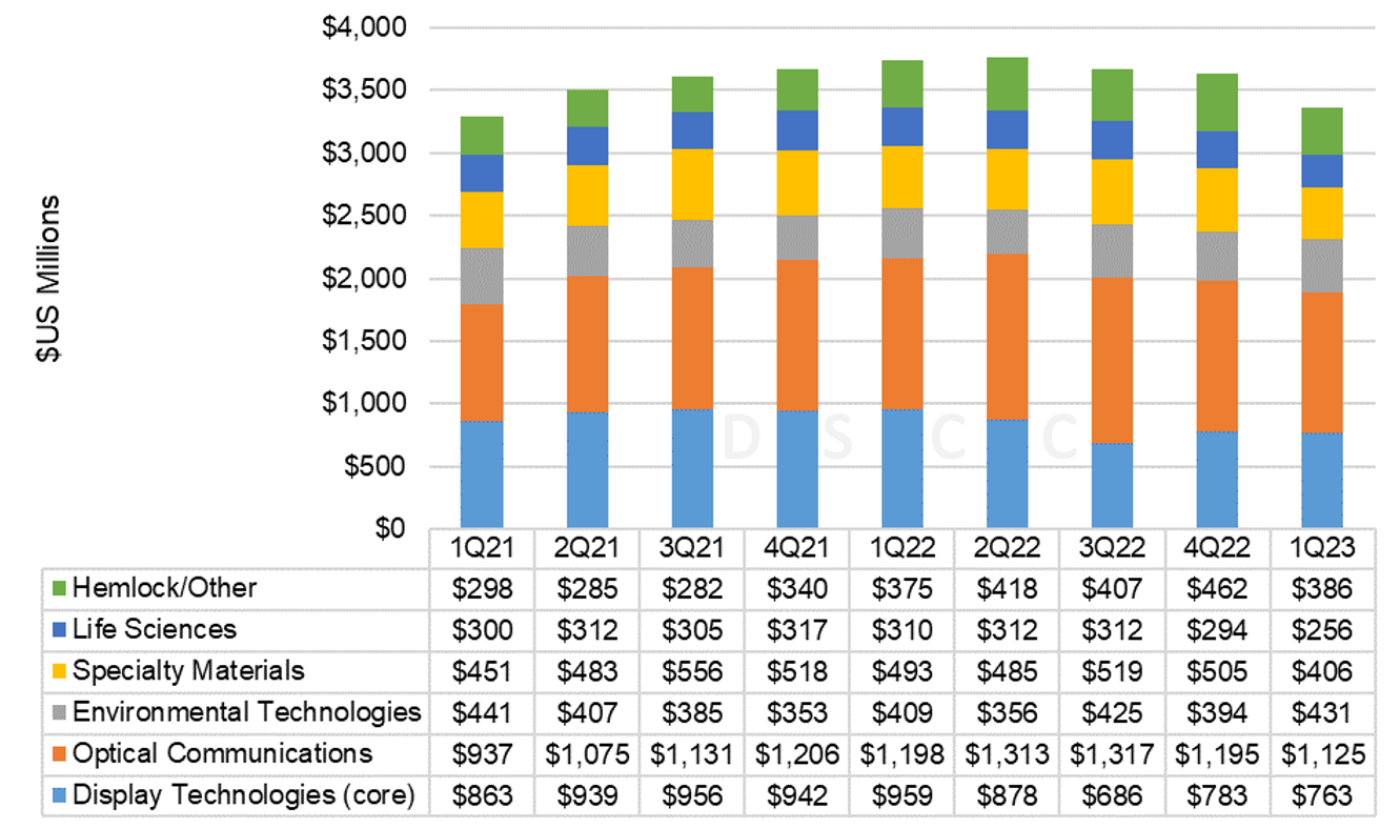
The operating profit margin of Corning’s Display Technologies business edged up sequentially to 22% in Q2’23 but this remains much lower than 26% in Q2’22.
Starting in 2021, Corning no longer provides guidance for individual businesses but rather for the corporation as a whole. Corning expects Q3’23 core revenue of around $3.5B, similar to Q2’23 but this would represent a decrease of 5% from Q3’22. Corning expects core EPS in Q3 to be about the same or slightly better compared to the $0.45 in Q2’23, but this would be down about 10% Y/Y. Corning indicated that revenues and profits in Q3 would improve sequentially in its Display Technologies and Specialty Materials businesses, but that Optical Communications and Environmental Technologies were expected to deteriorate sequentially.
NEG
NEG reported a net loss of JPY16.7B (-US$122M) for Q2’23 on revenues of JPY71.3B ($519M). NEG’s revenues fell short of analysts’ consensus expectations of JPY76.6B, and NEG’s operating loss of JPY 3.6B (-$26M) was worse than analysts’ expectations of a loss of JPY 1.7B. Revenues were up 5% Q/Q but down 18% Y/Y, while the net loss in Q2 compares with a net profit of JPY 885M in Q1’23 and net income of JPY 10.1B in Q2’22. NEG’s net loss in Q2’23 resulted from a non-operating restructuring charge of JPY 12B ($88M) in its display business.
NEG does not report operating results of its separate businesses. However, it reports revenue for its electronics and information devices segment, including display glass and NEG’s Dinorex cover glass business, along with businesses for glass for optical and electronic devices. In Q2’23, E&I Device revenue increased 14% Q/Q but decreased 16% Y/Y to JPY 33.5B ($244M). NEG said that in Q2’23 sales of FPD glass were significantly lower than Q2’22 “due to the impact of inventory adjustments in demand for consumer electronics and automotive components.”
NEG’s other business segment, Performance Materials, saw revenues decline by 2% Q/Q and by 20% Y/Y to JPY 37.8B.
For the rest of 2023, NEG said that they “expect strong shipments of FPD glass against the backdrop of a recovery in the display market”, and that they plan to “strongly promote product price revisions and sales expansion of G10.5 glass.”
AGC
AGC saw a slump in its most profitable business segment but improvement in some of its other non-display glass businesses to book a profit in Q1’23. AGC’s display glass business saw revenue increase Q/Q and Y/Y but profits for its electronics business were down Q/Q and Y/Y.
AGC reported a net profit of JPY23B ($168M) on revenues of JPY496B ($3.6B) in Q2’23. Revenues in JPY increased by 1% Q/Q but decreased by 2% Y/Y and the net profit decreased by 18% Q/Q and by 57% Y/Y. AGC revenues fell short of consensus analyst expectations of JPY520B and AGC’s operating profit of JPY 30.1B ($219M) fell short of analyst expectations of JPY37.8B.
AGC had reported an asset impairment in Q4’22 of JPY 73.7B ($521M) in its Display business, and after its Q1’23 earnings release, AGC further reported that it had decided to discontinue glass production at its Takasago plan in Kansai, Japan. In its decision to shut down Takasago, AGC cited sluggish TV sales and “soaring raw materials and fuel costs, and rising manufacturing costs due to the appreciation of Asian currencies.” AGC reported a non-operating loss of JPY 12B ($88M) as restructuring for its Takasago plant, but this was offset by non-operating gains from the sale of a flat glass business in China and from foreign exchange gains.
In Q2’23, AGC’s Electronics segment recorded operating income of JPY1.0B ($8M) on revenues of JPY71.2B ($518M). The electronics segment includes a display subsegment that incorporates both display glass and AGC’s Dragontrail cover glass business and another subsegment for electronic materials. Electronics revenue increased by 1% Q/Q but decreased by 1% Y/Y. Within the electronics segment, AGC’s electronics materials revenues decreased by 15% Q/Q and by 2% Y/Y, while revenues from display increased by 19% Q/Q and by 1% Y/Y at JPY42.5B ($310M). Electronics operating income fell 45% Q/Q and 13% Y/Y, and within the electronics segment, AGC indicated that its electronics materials represented 140% of segment profit (i.e., JPY 1.4B) and that its display segment represented -40% of segment profit (i.e., JPY 0.4B loss).
AGC Quarterly Revenue by Business Segment
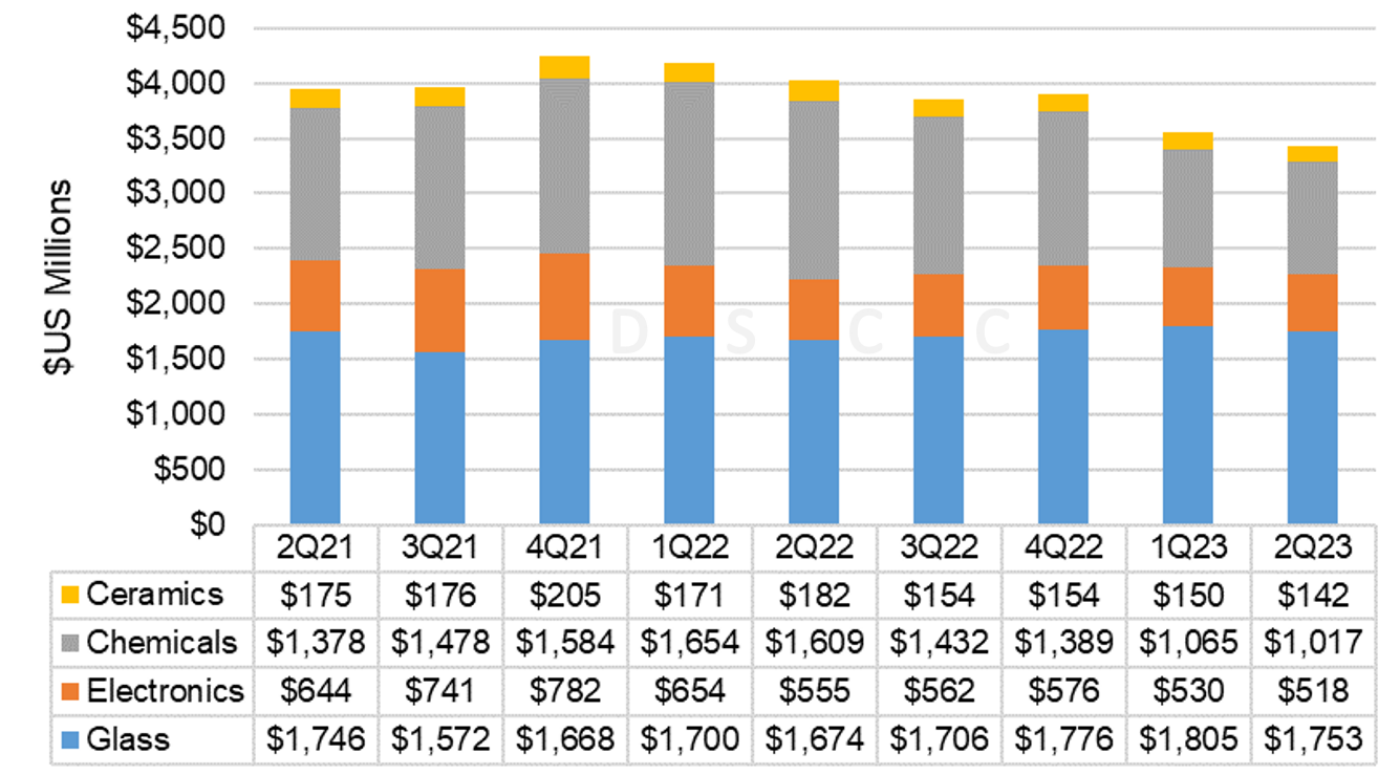
Among AGC’s other business segments, its chemicals business in Q2 reported a 1% decrease Q/Q and a 33% decrease Y/Y in revenues, and operating profit in the segment declined 20% Q/Q and 71% Y/Y. AGC split its former glass business into two segments, Architectural glass and Automotive glass, and reported Y/Y increases in revenues and profits for both segments, attributable to price increases.
AGC revised its guidance for the full year 2023, downgrading its outlook compared to guidance given in February. At a corporate level, AGC now expects revenues of JPY 2050B (was JPY 2150), up 1% Y/Y and operating profit of JPY 150B (was JPY 190B), down 18% Y/Y. At a business segment level, AGC reduced its outlook for revenue in Electronics from JPY 340B to JPY 330B and reduced its expectations for operating profit from JPY 38B to JPY 25B.
AGC indicated that in Q3’23, it expects shipments of display glass to increase by a low single-digit % sequentially, and shipments of specialty glass for display (i.e., cover glass) to increase. AGC said that it expects to achieve a turnaround in its display business through technological innovation and “revisiting and revising our policy on pricing.” AGC targets a ROCE (return on capital employed) of 10% in its display business.
AGC continues to provide investors with updates on its medium- and long-term strategy, including details of revenues from strategic businesses, which does not include display. AGC expects growth in its strategic businesses and targets those for investment, while it expects core businesses to generate cash.
Glass Maker Comparison
With financial results for the top three glassmakers, we can give a comparison of their results. Since the two Japanese companies include cover glass in their display-related business segments, it makes sense to compare the combination of Corning’s display technologies and specialty materials (Gorilla Glass) businesses, as shown in the chart here.
Glass Maker Revenues from Display Business Segments
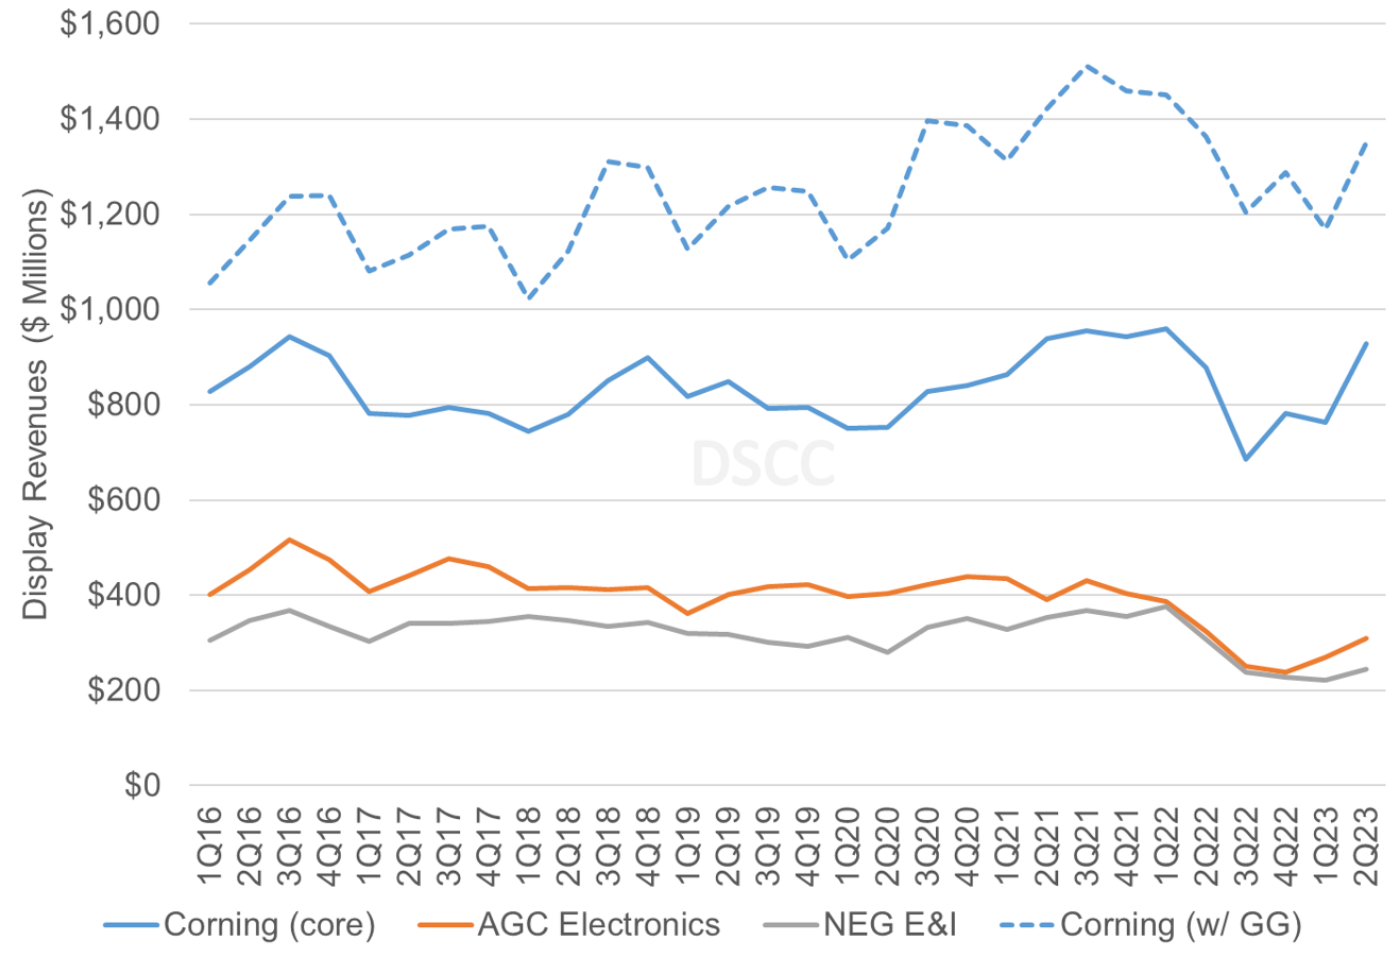
Corning’s combined revenue captured 71% of total industry revenues in Q2’23, up 1% from Q1’23 and up 3% from Q2’22. AGC share of 16% was stable both Q/Q and Y/Y, while NEG share decreased from 14% to 13% Q/Q. With AGC reporting only a small profit and NEG reporting a larger loss, Corning’s profits from the segment exceeded 100% of industry profits.
Glass Maker Operating Profits from Display Business Segments
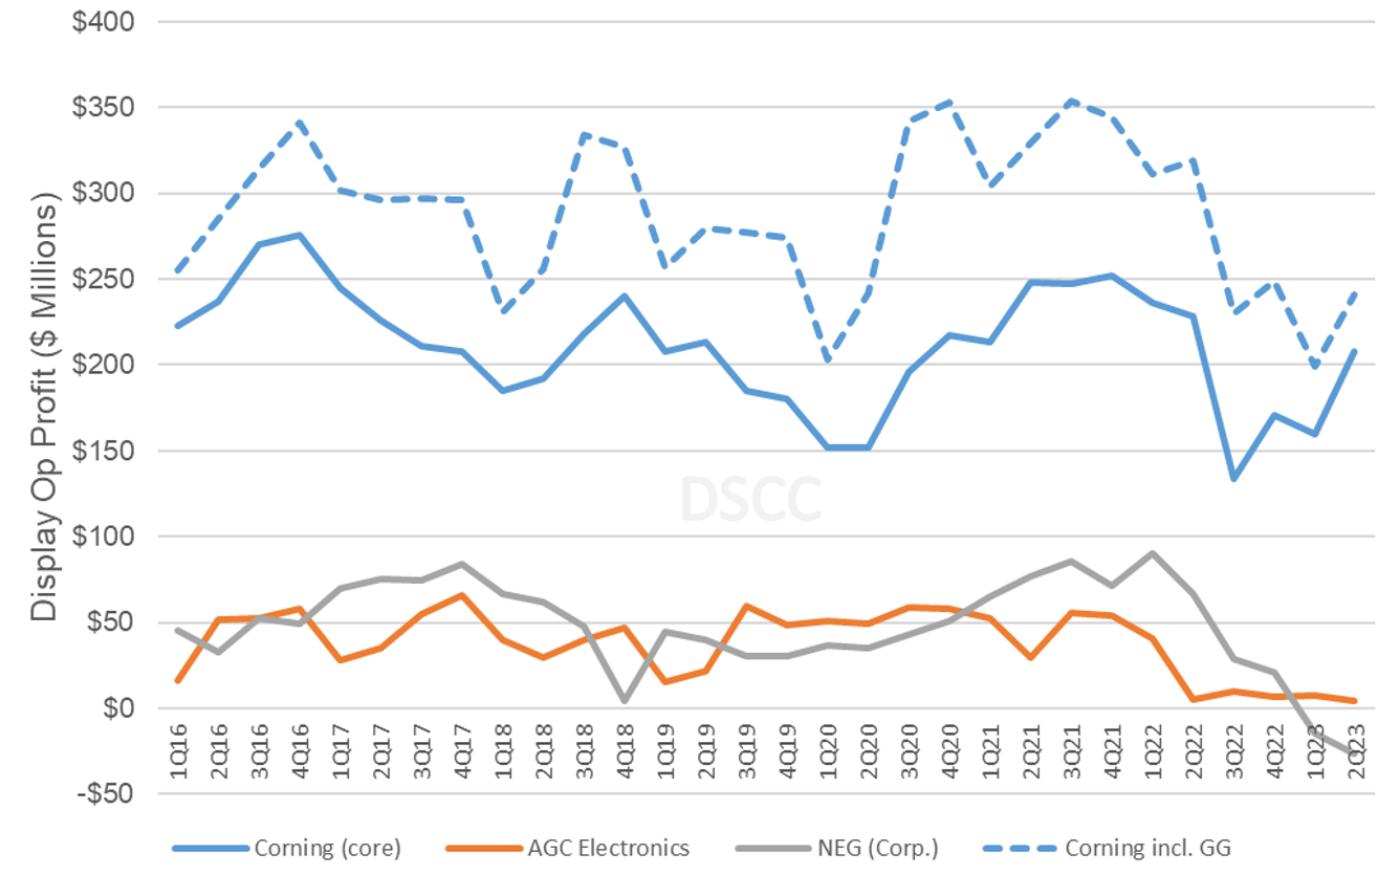
Corning’s profit margin has consistently been much better than its Japanese competitors. Corning’s operating margin for displays including Gorilla Glass increased from 17% in Q1’23 to 18% in Q2’23. While NEG does not break out profit for its business segments, its corporate operating profit margin fell from -3% in Q1’23 to -5% in Q2’23. AGC’s operating margin for Electronics decreased from 3% in Q1’23 to 1% in Q2’23 and AGC has indicated that within Electronics, AGC’s margin for Display is negative.
DSCC estimates that glass prices decreased by 0.3% in Q1’23 in terms of Japanese yen, to an average of JPY 1171 per square meter. While the Q2 price is 5% higher than the all-time low of glass prices in Q4 2020 when expressed in yen, when translated into dollars the average price of $8.55 per square meter is an all-time low and 20% lower than the price in Q4’20.
Since both of its Japanese competitors have reported negative operating margins in the display business and have shut down unprofitable display glass plants, Corning felt confident enough in May 2023 to announce a price increase. It is clear that its Japanese competitors have followed Corning’s lead and raised prices as well. As it stands now, it appears that flat panel makers may have used the glass price increase to leverage higher panel prices, resulting in an improvement in profitability all around.
