FPD生産ライン稼働率、Q3'25は低下傾向
出典調査レポート Quarterly All Display Fab Utilization Report の詳細仕様・販売価格・一部実データ付き商品サンプル・WEB無料ご試読は こちらから お問い合わせください。
これらCounterpoint Research FPD部門 (旧DSCC) 発の分析記事をいち早く無料配信するメールマガジンにぜひご登録ください。ご登録者様ならではの優先特典もご用意しています。【簡単ご登録は こちらから 】
FPD生産ライン稼働率、Q3'25は低下傾向
2025年初めの数ヵ月間上昇していたFPD生産ライン稼働率は3月から4月にかけてピークを迎え、Q3’25は低下傾向にある。Counterpoint Researchが先週発刊した Quarterly All Display Fab Utilization Report 最新版で明らかにしている。今年に入って中国での需要急増と米国の関税政策による歪みが見られたが、FPDメーカーはその後、在庫積み増しを避けるべく生産を抑えているようだ。
同レポートは、FPD業界のすべての生産ライン、すなわち100以上のラインを対象に、生産能力、TFT投入量、稼働率を月次で追跡しており、提供データはピボットテーブルによってFPDメーカー、国、TFTライン世代、バックプレーン、フロントプレーン、基板タイプなどの項目別に分類できるようになっている。稼働率については、Q1’19以降の実績と2025年の月次予測を掲載している。
Q1’25は稼働率がやや上昇したが、これは政府の補助金制度による中国TV市場の旺盛な需要に支えられたものだった。Counterpoint ResearchのQuarterly Advanced TV Shipment and Forecast Report によると、中国では先端技術LCD搭載TV出荷数が140%増加、特に超大型TVの伸びが顕著だった。またQ1’25には、トランプ大統領による関税引き上げを見越してTVメーカーが米国向け出荷を急いだことも需要の押し上げをもたらした。第2四半期開始時点では、米国のTV在庫水準が通常より高かったが、現在では中国から米国へのTV輸入に41.9%の関税が課されているため、メーカー各社は貿易協定による関税引き下げを期待しつつ、出荷を控えている状況だ。
Q2’25の生産ライン稼働率を見ると、日本と台湾で前期より上昇したが中国で2%低下したことから、世界全体では前期をわずかに下回る結果となった。Q3’25は中国の稼働率が再び低下するため、世界の稼働率はさらに下がる予測となっている。
TFT生産ライン稼働率 月次推移 (地域別)
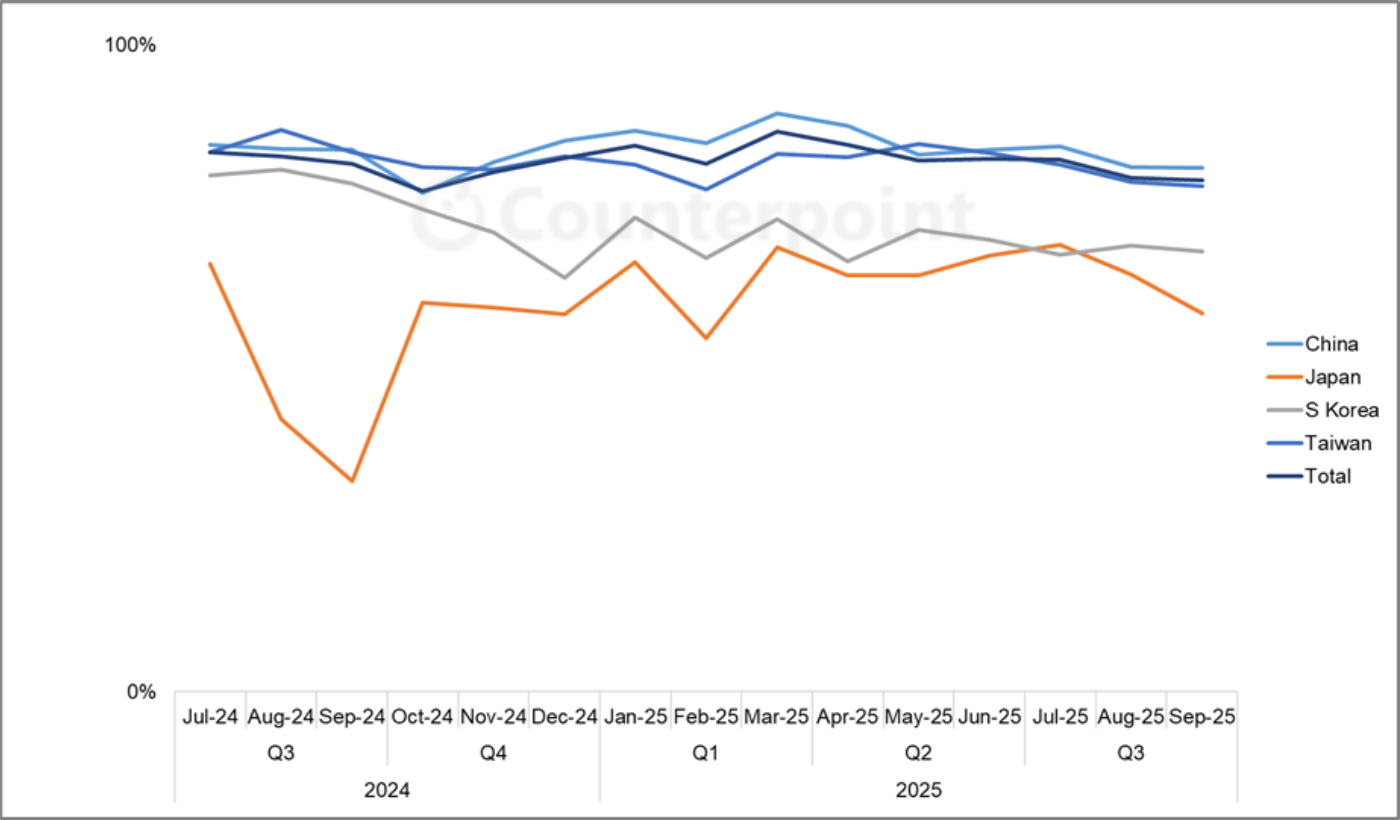
韓国は、全生産能力のうちOLEDが占める割合が非常に高く、他のすべての地域ではLCDが主流となっている。OLEDライン、特にTV用OLEDラインの稼働率が低いため、韓国はしばしば日本と稼働率の最下位争いをする状況にある。Q2’25からQ3’25にかけての稼働率の低下はLCDに限定されており (次のグラフを参照)、OLED生産ラインは、スマートフォン需要がピークを迎えOLED TV需要も改善する第3四半期にピークシーズンを迎える。
TFT生産ライン稼働率 四半期推移 (フロントプレーン別)
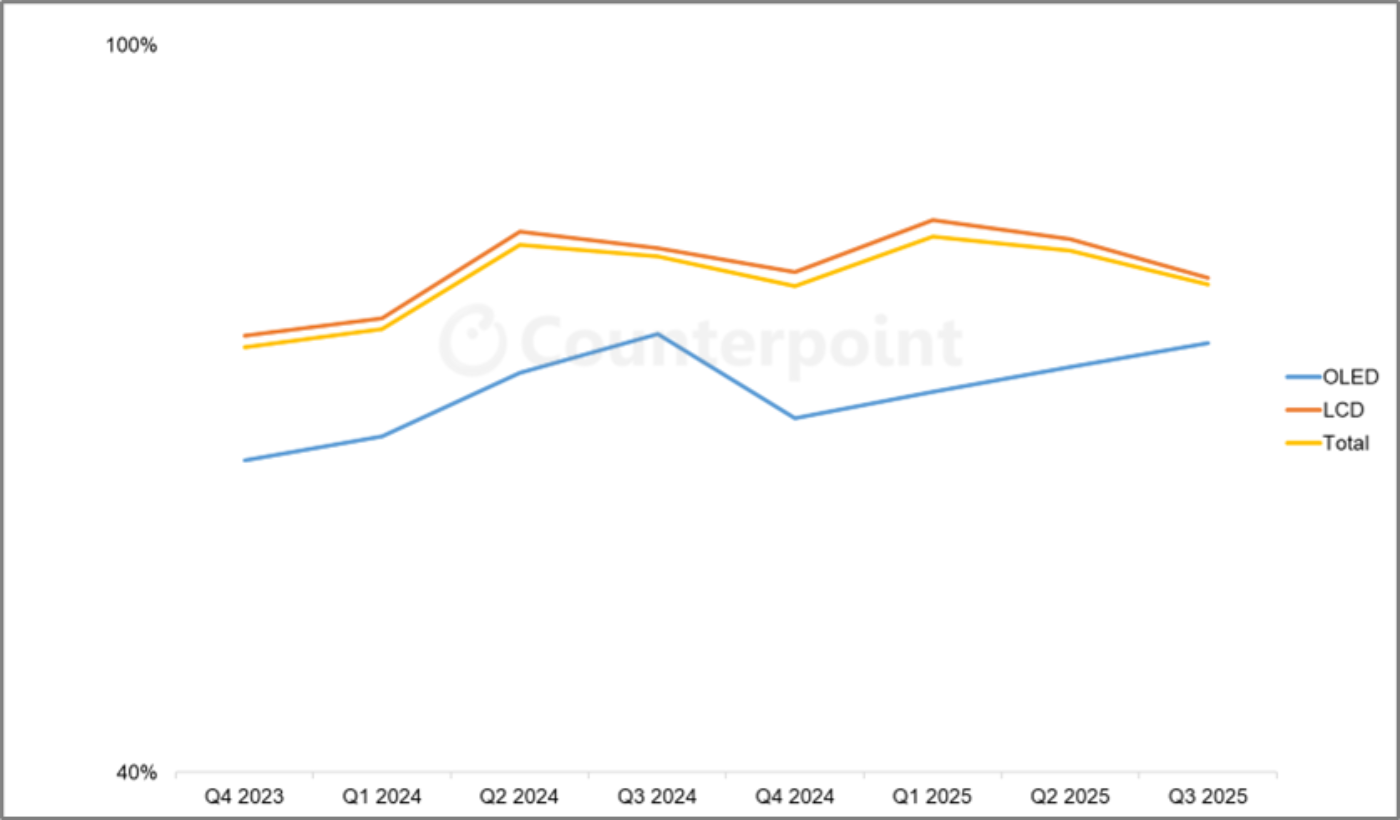
Quarterly All Display Fab Utilization Report はその名の通り、すべてのディスプレイ技術と用途を対象としている。Counterpoint Researchでは、モバイル機器用のOLEDとLTPS LCDに焦点を絞った Quarterly OLED and Mobile/IT Fab Utilization Report も発刊しており、こちらも先週最新版がリリースされた。次のグラフは、LTPS LCDとOLEDの稼働率を基板タイプ別 (リジッドとフレキシブル) に示したものである。
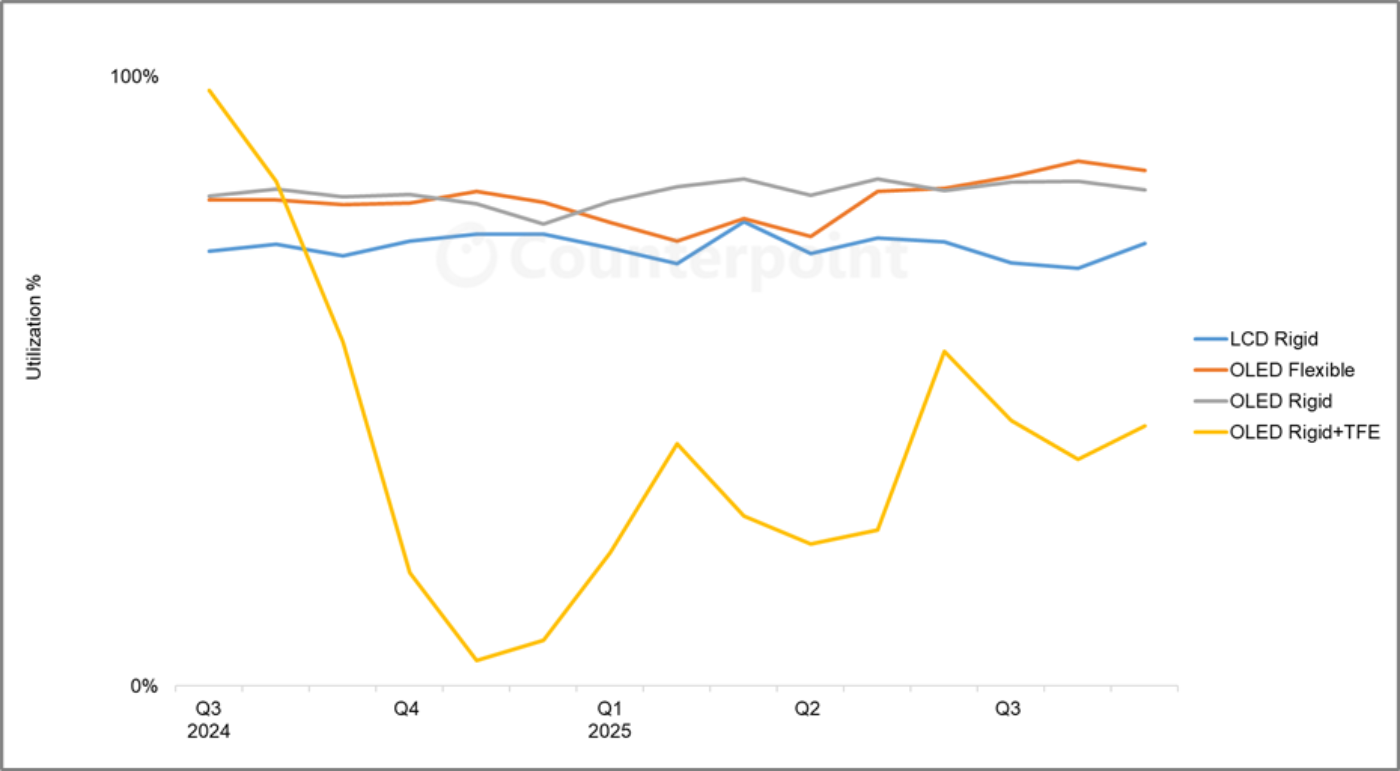
ノートPC用リジッドOLEDの需要拡大が続いていること、またスマートフォン用リジッドOLED需要がLTPS LCD需要を侵食し増加していることから、リジッドOLEDが2023年の低水準から上昇している。リジッドOLEDとLTPS LCDはともにスマートフォン市場の下位から中位層に対応しており、プレミアムセグメントよりも季節要因の影響が少ない。ハイエンドのスマートフォンにはフレキシブルOLEDが使用されており、フレキシブルOLEDはAppleの製品導入サイクルとホリデー商戦がおもな要因として機能し、稼働率は毎年上半期に低下し下半期に上昇するという一貫した季節性パターンに落ち着いている。Q1’25の季節的減速は例年より穏やかで、稼働率はQ3’25に季節的ピークに達する見通しだ。
LGDとSDCの新規Rigid+TFE OLEDラインはOLED搭載iPad Pro向けパネル供給のためQ3’24に高稼働率を記録したが、iPad Pro需要が驚くほど低調だったことから、Q4’24には稼働率が急落した。これらのRigid+TFE OLEDラインは2025年になって稼働率が徐々に上昇している。
TFT生産ライン稼働率 月次推移 (ディスプレイ技術別・基板別)
FPD業界の総生産能力は需要を上回る水準にある状況が続いているが、そのギャップは2022-2023年に比べてかなり小さくなっている。地政学的な争いによって需要展望の不透明感が増していることから、業界はハードクラッシュを避けるために稼働率の抑制を継続する必要があるが、2023年と2024年の「急ブレーキ」に比べると、2025年は「軽くブレーキを踏む」程度になりそうだ。
------------------------------------
Counterpoint Researchの Quarterly All Display Fab Utilization Report は業界のすべてのFPD生産ラインを対象に生産能力、TFT投入量、稼働率を月次で追跡しており、提供データはピボットテーブルによってFPDメーカー、国、TFTライン世代、バックプレーン、フロントプレーン、基板タイプなどの項目別に分類できるようになっています。稼働率については、Q1’19以降の実績と2024年および2025年上半期の月次予測を掲載しています。
出典調査レポート Quarterly All Display Fab Utilization Report の詳細仕様・販売価格・一部実データ付き商品サンプル・WEB無料ご試読は こちらから お問い合わせください。
[原文] Flat Panel Display Fab Utilization Trending Down in Q3
After a rally in the first months of the year, flat panel display fab utilization peaked in March-April and has been trending down in Q3 2025, according to the latest release of Counterpoint Research’s Quarterly All Display Fab Utilization Report, issued last week. After a flurry of demand in China and distortions from US tariff policy earlier in the year, panel makers appear to be pulling back to avoid building inventory.
The report details monthly capacity, TFT input and utilization for every flat panel display fab in the industry, which means more than 100 fabs in all, and includes pivot tables to allow segmentation by supplier, country, TFT fab generation, backplane, frontplane or substrate type. The report provides historical utilization back to Q1 2019 and a forecast by month for 2025.
We saw a modest surge in utilization in Q1 2025 based on strong demand in the China TV market associated with a government subsidy program. According to Counterpoint Research’s Quarterly Advanced TV Shipment and Forecast Report, advanced LCD TV shipments in China increased by 140%, with especially strong growth in very large size TVs. Adding to the demand pull in Q1 2025, TV makers rushed to get products into the US in anticipation of a tariff increase by President Trump. As Q2 started, US TV inventory was higher than normal, and since TV imports to the US from China now face a 41.9% tariff, companies are holding back, hoping that a trade deal will provide a reduction.
Worldwide fab utilization decreased slightly QoQ in Q2 2024 despite sequential increases in utilization in Japan and Taiwan, as utilization in China fell by 2%. We expect utilization to drop further in Q3 2025 as the China number will decrease again.
South Korea has a dramatically higher share of its capacity as OLED, while all other regions are dominated by LCD. Low utilization of OLED lines, especially OLED TV lines, means that South Korea frequently finds itself vying with Japan for the region with the lowest utilization. The slowdown in utilization in Q2-Q3 2025 is confined to LCD (see next chart), as OLED line utilization reaches a seasonal peak in Q3 with demand for smartphones peaking and improvement in OLED TV demand.
The Quarterly All Display Fab Utilization Report, as its name implies, covers every display technology and application, but a separate Counterpoint Research report, the Quarterly OLED and Mobile/IT Fab Utilization Report, also updated last week, provides a more narrow focus on OLED and LTPS LCD for mobile devices. The next chart here shows a view of utilization for LTPS LCD and OLED with Rigid and Flexible substrates.
Rigid OLED has increased from low levels in 2023 as demand for rigid OLED panels for notebook PCs continues to increase and demand for rigid OLED smartphone panels has increased at the expense of LTPS LCD. Both rigid OLED and LTPS LCD serve the lower and middle tiers of the smartphone market, which exhibit less seasonality than the premium segment. Higher-end smartphones use flexible OLED panels, which have settled into a consistent seasonal pattern of lower UT% in the first half and higher UT% in the second half of each year, driven primarily by Apple’s product introduction cycle and holiday sales. The seasonal slowdown in Q1 2025 was milder than usual, and utilization is expected to hit its seasonal peak in Q3 2025.
The new Rigid+TFE OLED lines for LGD and SDC were running at high utilization in Q3 2024 to supply OLED panels for the OLED iPad Pro, but utilization plummeted in Q4 2024 as iPad Pro demand turned out to be surprisingly weak. Utilization of those Rigid+TFE lines is increasing slowly in 2025.
The display industry’s total capacity continues to exceed demand, but that gap is much smaller today than in 2022-2023. With geopolitical strife adding uncertainty to the demand picture, the industry will need to continue to restrain utilization to avoid a hard crash. That restraint looks a lot like a “tap on the brakes” in 2025 as compared to “slam on the brakes” in 2023 and 2024.
Counterpoint Research’s Quarterly All Display Fab Utilization Report covers capacity, TFT input and utilization by month for every flat panel display fab in the industry, with pivot tables to allow segmentation by supplier, country, TFT fab generation, backplane, frontplane or substrate type. The report provides historical utilization back to Q1 2019 and a forecast by month for 2025. Counterpoint Weekly readers interested in subscribing to the Quarterly All Display Fab Utilization Report should contact info@counterpointresearch.com.
