AMOLED材料市場、2027年に22億ドルに成長 (年平均成長率12%)
出典調査レポート Semi-Annual AMOLED Materials Report の詳細仕様・販売価格・一部実データ付き商品サンプル・WEBご試読は こちらから お問い合わせください。
これらDSCC Japan発の分析記事をいち早く無料配信するメールマガジンにぜひご登録ください。ご登録者様ならではの優先特典もご用意しています。【簡単ご登録は こちらから 】
冒頭部和訳
AMOLEDスタック材料 (全アプリケーション対象) の出荷額は2022年に前年比10%減となったが、2023年には4%増の14億ドルに到達、2027年には21億8000万ドルに成長し、2023年から2027年の年平均成長率は12%になると予測されている。DSCCが Semi-Annual AMOLED Materials Report 最新版で明らかにしている。Universal Display Corporationが発表通り青色燐光エミッタードーパントの商品化に成功すれば、2027年の出荷額は数億ドル単位で増加の可能性もある。このレポートでは、複数の用途、メーカー間の関係を示すマトリックス図、コスト比較など、AMOLED材料のあらゆる側面を詳細に解説している。
7月に発刊された最新レポートでは、AMOLEDの生産能力と稼働率の見通しに関するDSCCの最新予測を収録している。モバイルとTVはともに当初予測に比べて需要減少に苦しんでおり、サプライチェーンの過剰在庫が削減されることから、TV向けの投入は2023年に大きく減少する。このレポートには、業界で蛍光青色発光体の使用が継続すると仮定したベースケースシナリオと、燐光青色がもたらす出荷額追加の概要を示す特別追加シナリオが含まれている。
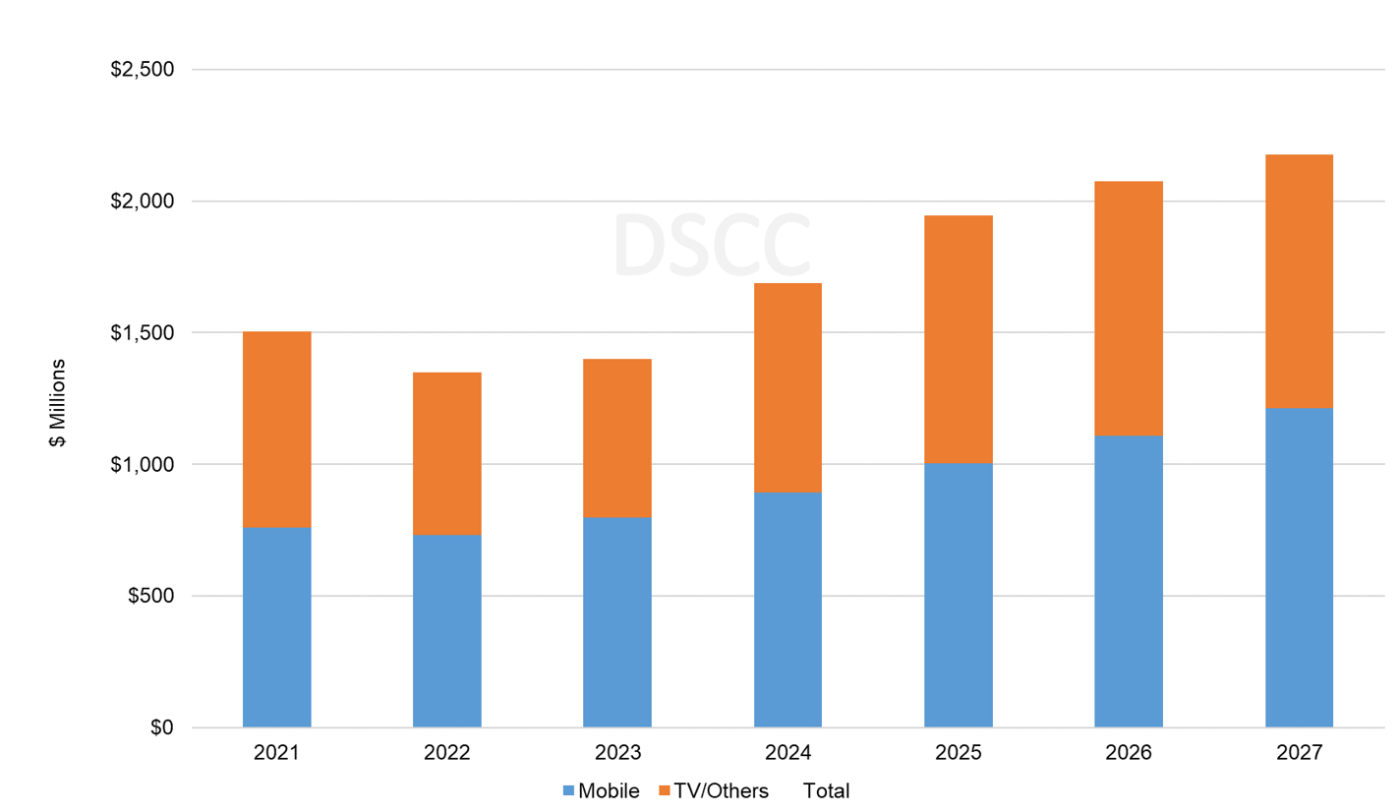
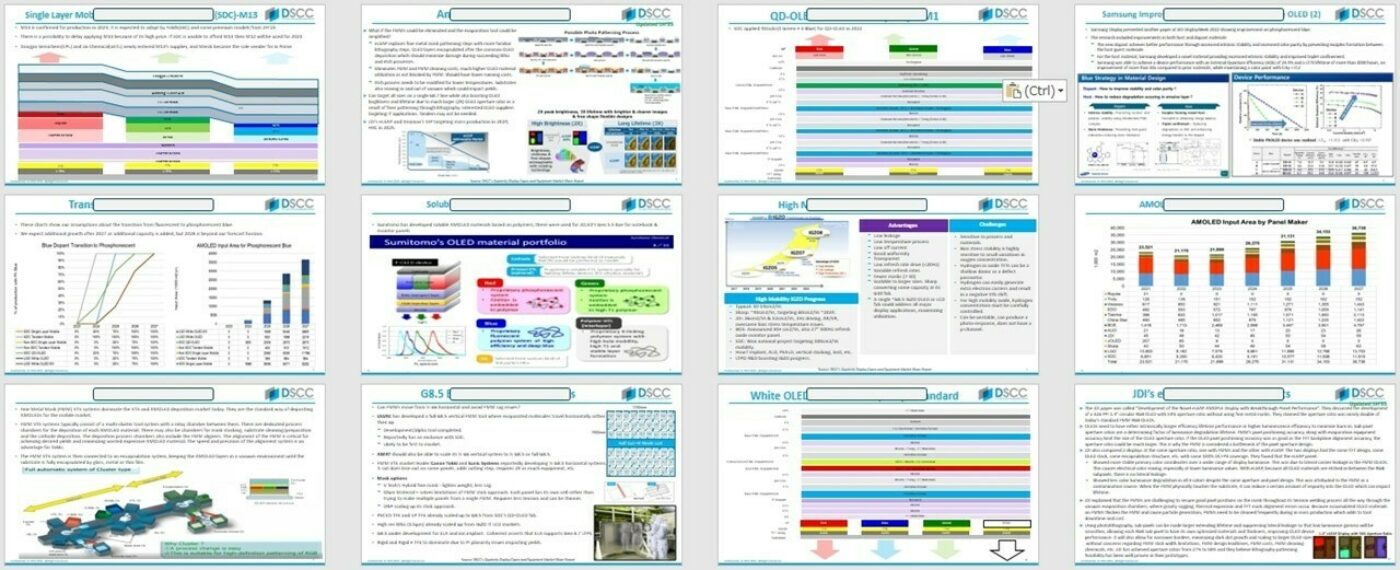
一つ目のグラフは、アプリケーション別のAMOLED材料出荷額予測を示している。TVやその他の大画面アプリケーションの出荷額は2022年に前年比17%減、2023年にはさらに3%減となり、2024年に成長軌道に戻ると見られている。TV向け出荷額は2023年から2027年にかけて年平均成長率13%で増加し10億ドル近くになると予測される。モバイルアプリケーションは今後もOLED材料売上の大部分を占め、年平均成長率11%で12億ドルまで成長すると予測されている。
第8.7世代VTE RGB OLEDラインの新規生産能力はITをターゲットとしている。同じ材料を使用できることから、この新規生産能力はUDCとその他VTE材料メーカーに利益をもたらす。追加生産能力についての詳細はDSCCの Quarterly Display Capex and Equipment Market Share Report に掲載している。
AMOLED Materials Market to Grow to $2.2B by 2027
※ご参考※ 無料翻訳ツール (DeepL)
After declining in 2022 by 10%, revenue for AMOLED stack materials for all applications is expected to grow 4% Y/Y to $1.40B in 2023 and expected to grow to $2.18B in 2027, a 12% CAGR (2023-2027), according to the latest update of DSCC’s Semi-Annual AMOLED Materials Report. Revenues can be hundreds of millions of dollars higher in 2027 if Universal Display Corporation successfully commercializes a blue phosphorescent emitter dopant as they have announced. The report details all aspects of AMOLED materials, including multiple applications, supplier matrices and cost comparisons.
The July 2023 report incorporates the latest update to DSCC’s capacity and utilization outlook for AMOLED; both mobile and TV have suffered reduced demand compared to our prior forecast and TV input is down sharply in 2023 as excess inventory in the supply chain is reduced. The report includes a base case scenario that assumes the industry continues to use fluorescent blue emitters and includes a special additional scenario outlining the additional revenue generated by phosphorescent blue.
Our forecast for AMOLED material revenues by application is shown in the first chart here. Revenues from TV and other large screen applications declined by 17% Y/Y in 2022 and are expected to decline another 3% Y/Y in 2023 before returning to growth in 2024. We expect revenues from TV to increase by a 13% CAGR in 2023-2027 to nearly $1B. Mobile applications will continue to represent a majority of OLED material sales, growing at an 11% CAGR to $1.2B.
New capacity for VTE RGB OLED fabs in G8.7 will be targeted at IT. This new capacity will benefit UDC and other VTE materials suppliers since the same materials can be used. Details of the capacity additions can be found in DSCC’s Quarterly Display Capex and Equipment Market Share Report.
AMOLED Material Revenues by Application
The stack profiles, along with estimates of material thickness, material utilization and material prices, form a picture of the unyielded stack cost for each AMOLED product architecture.
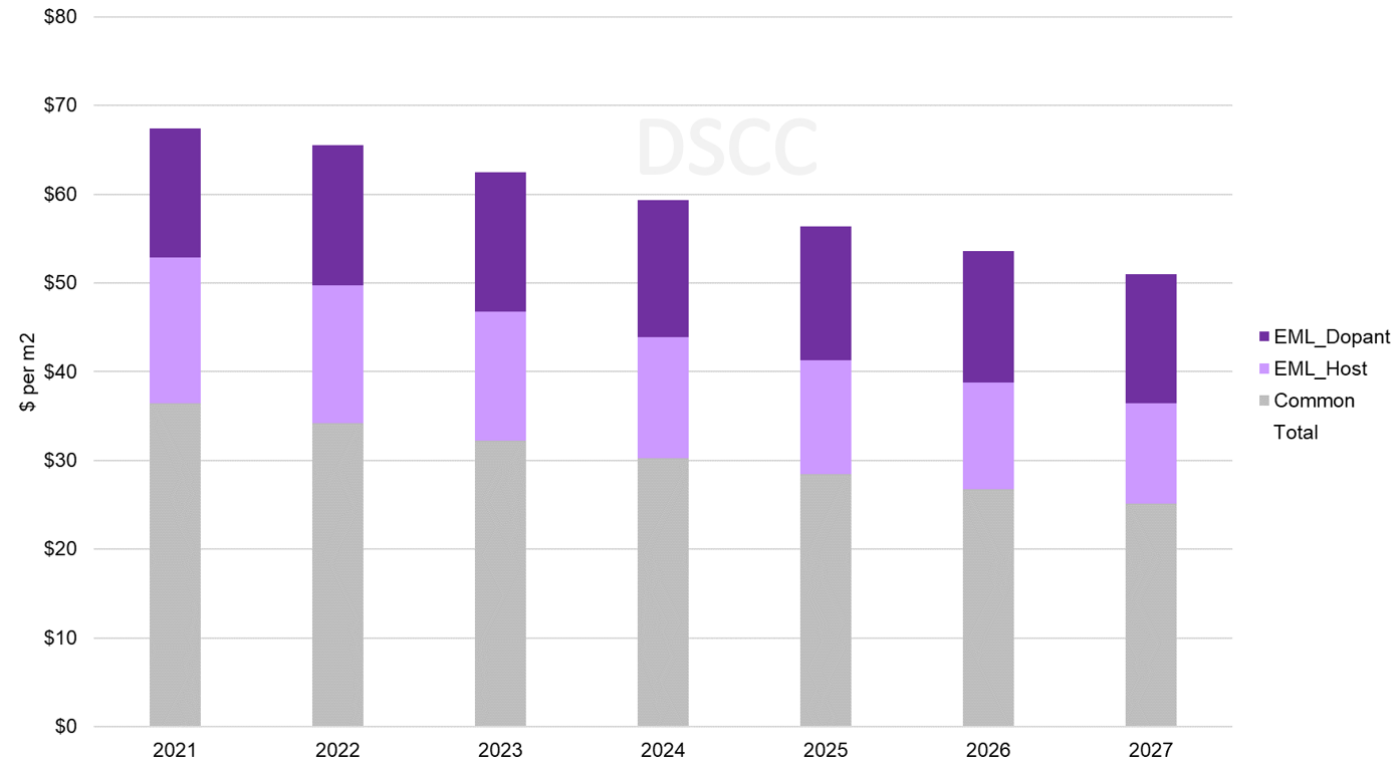
The following chart here shows our outlook for the material cost for LGD’s White OLED panels. We expect that steady, incremental improvements in material utilization and price will help LGD drive the unyielded stack cost of its standard WOLED panels from $62 per square meter in 2023 to $51 per square meter in 2027, an average decrease of 5% per year. For LG Display, with increased experience we expect that yields will also improve over time, so that the cost declines of yielded OLED stack materials will be even greater.
LGD’s OLED EX panels have two changes that boost brightness but also add cost to the OLED stack. The OLED EX panels have an additional green emitting layer to generate more light, and LGD employs deuterium in the host materials of the blue emitting layers to extend the lifetime of the panels. With these two changes, we estimate that the unyielded stack cost of the OLED Evo panel adds nearly $40 per square meter in cost. Although this figure also declines over time, we estimate the cost adder in 2026 to remain more than $30 per square meter. With this continuing cost adder, we expect that OLED EX will continue to be positioned as a premium product, positioned to compete directly with Samsung’s QD-OLED.
Unyielded Material Cost per m2 for WOLED Panels
Our report provides an estimate of AMOLED stack material costs QD-OLED, which we expect will be lower than those for WOLED. When compared with the standard WOLED panels, the cost advantage of the QD-OLED stack is modest because QD-OLED requires three blue emitting layers plus an additional green emitting layer to boost brightness. We estimate that in 2023, the unyielded stack costs for QD-OLED are expected to be ~20% lower than the standard WOLED. Of course, for QD-OLED, the unyielded stack cost is only a part of the picture. The yields on the mature WOLED technology are undoubtedly higher than those for QD-OLED, and the front end of the QD-OLED display includes both a color converter and a color filter, and therefore will be substantially more expensive than the simpler color filter used in WOLED. While we estimate that the OLED stack cost of QD-OLED is lower than that of WOLED, we expect the total product cost of QD-OLED to be higher. For a more detailed comparison of the full panel costs for QD-OLED and WOLED, please see DSCC’s Biannual Advanced TV Panel Cost Report.
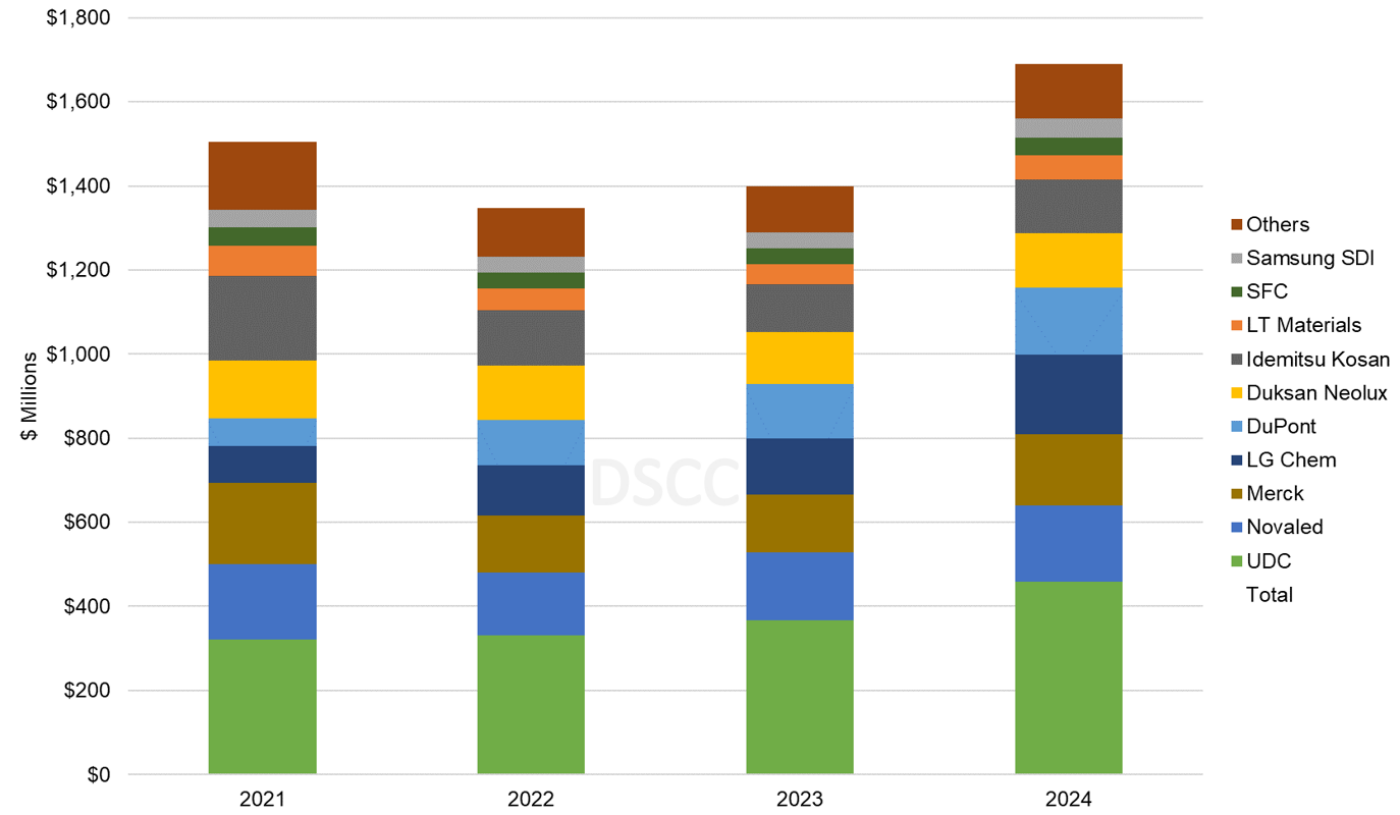
Based on the existing supplier matrix including some shifts in suppliers in 2023, the report includes a projection of AMOLED material revenues by supplier, as shown in the next chart. Universal Display Corporation (UDC) has been the #1 supplier in revenues for the industry, and we expect that to continue. Novaled, Merck and LG Chem hold the number two through four positions among materials suppliers. These four companies are expected to capture 57% of industry revenues in 2023, but as the chart indicates, there is a long tail of companies supplying materials into the industry.
AMOLED Materials Revenues by Supplier
This most recent edition of the report includes a scenario estimating the additional OLED material revenues generated from the potential shift from fluorescent to phosphorescent blue emitters. After refusing to describe a timeline for many years, Universal Display Corporation in February 2022 announced that it was on track to enable the introduction of phosphorescent blue OLED into the commercial market in 2024. UDC has largely confirmed this timeline in subsequent announcements, although at Display Week 2023, UDC clarified that they expect to have a phosphorescent blue that is commercially available in 2024, but that the timetable for devices using the new material would be up to their clients.
This shift, if it happens, will act as an accelerant for the growth of the entire OLED industry.
For mobile devices, it will allow a rebalancing of the pixel structure, reducing the size of the blue sub-pixel and increasing the size of the red and green sub-pixels and therefore improving light efficiency overall. This improved light efficiency can be used for higher brightness premium displays, or it can be traded off for lower power consumption, improving battery life. Either way, OLED panels with phosphorescent blue emitters will have a higher value to device makers, and we expect they will command a substantial price premium.
For TV applications, the improved efficiency can be used to boost brightness or to reduce the number of emitting layers. LGD uses two blue emitting layers in its WOLED stack, and SDC uses three blue emitting layers in its QD-OLED stack. Reducing a single emitting layer reduces the total number of layers by four, because it removes the need for electron and hole transport layers and p/n charge generation layers.
Because of the substantial value added by phosphorescent blue emitters, we expect that Universal Display will be able to generate significantly more revenue from sales of its blue dopant materials compared to the corresponding revenue from fluorescent blue dopants. Our report makes assumptions about the time for the industry to transition from fluorescent to phosphorescent and how that varies by panel maker and by application. The report also makes assumptions about the revenue premium to be generated by phosphorescent to come to an estimate of phosphorescent blue dopant revenues. Subscribers to the report can see all the detailed assumptions and the conclusion, but for readers of this newsletter it will suffice to say that the increased revenue would be a substantial boost to revenues for UDC.
The DSCC Semi-Annual AMOLED Materials Report includes profiles for all major AMOLED stack architectures, supplier matrices for the main OLED panel makers and revenue projections for 18 different material types and 20 material suppliers.
出典調査レポート Semi-Annual AMOLED Materials Report の詳細仕様・販売価格・一部実データ付き商品サンプル・WEBご試読は こちらから お問い合わせください。
