TV用LCD価格 (3月度分析)
冒頭部和訳
TV用LCD価格は12月から1月にかけて一旦動きを止めたが、その後は過去最低値から再び上昇している。LCD生産ライン稼働率が通常の水準を大幅に下回っているため、TVサプライチェーンの在庫は減少しており、パネル調達が回復し始めている。FPDメーカーが価格の上昇を歓迎しているのは間違いないが、価格はキャッシュコストを下回っており、業界は依然として難しい立場にある。
一つ目のグラフはTV用LCD価格動向の最新予測である。予測期間は2023年6月まで延長されている。2021年中盤から2022年夏にかけて、パンデミック後に価格が急落したことがグラフに表れている。価格は2022年9月に過去最低値を記録し、10月から11月にかけて緩やかに上昇した。2ヵ月間の一時停止の後、価格は2月に再び上昇し、3月にもまた上昇の方向である。
価格が第3四半期から第4四半期にかけてV字型パターンを示したため、Q4’22の平均価格は前期比でほぼ横ばいとなり、12月の価格は9月より3%上昇したにもかかわらず、平均ではわずか0.1%しか上昇しなかった。Q1’23の平均価格は前期比2.7%上昇が予測されており、FPDメーカー各社にはようやく本格的な前期比成長の恩恵がもたらされることになりそうだ。
LCD TV Panel Prices Edging Up in Q1
※ご参考※ 無料翻訳ツール (DeepL)
After a pause in December and January, LCD TV panel prices are increasing again from their all-time lows. With LCD fab utilization well below normal levels, TV supply chain inventories have been decreasing and panel purchases have started to recover. While the price increases are undoubtedly welcomed by panel makers, the industry remains in a difficult position with prices below cash costs.
The first chart here highlights our latest TV panel price update to June 2023, showing the post-pandemic price plunge from mid-2021 to summer 2022. Prices hit their all-time lows in September 2022 and increased modestly in October and November. After a two-month pause, prices increased again in February and will increase again in March.
Because of a V-shaped pattern of prices in Q3 and Q4, the average price was close to flat on a Q/Q basis for Q4’22, increasing an average of only 0.1%, even though December prices were 3% higher than September prices. Panel makers are seeing a true Q/Q benefit in Q1’23, with average prices now expected to be up 2.7% Q/Q.
LCD TV Panel Prices
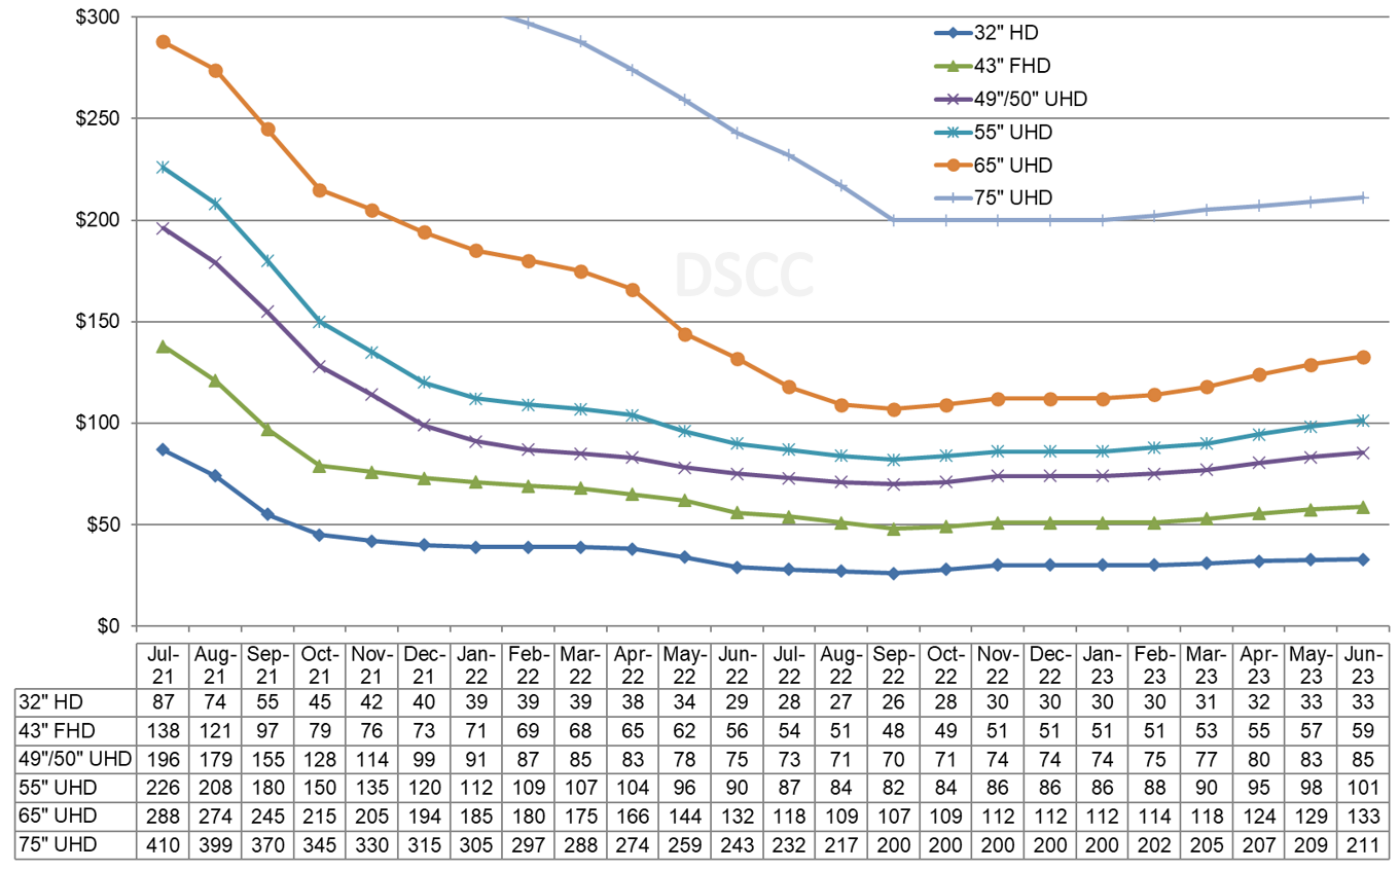
While prices for larger size panels (50” through 75”) increased in February, the smaller size panels under 50” did not enjoy the same increase, as the TV supply chain inventory correction has been slower in the smaller sizes. We expect prices for all sizes of LCD TV panels to increase in March, with the M/M increase ranging from 1.5% to 3.9%.
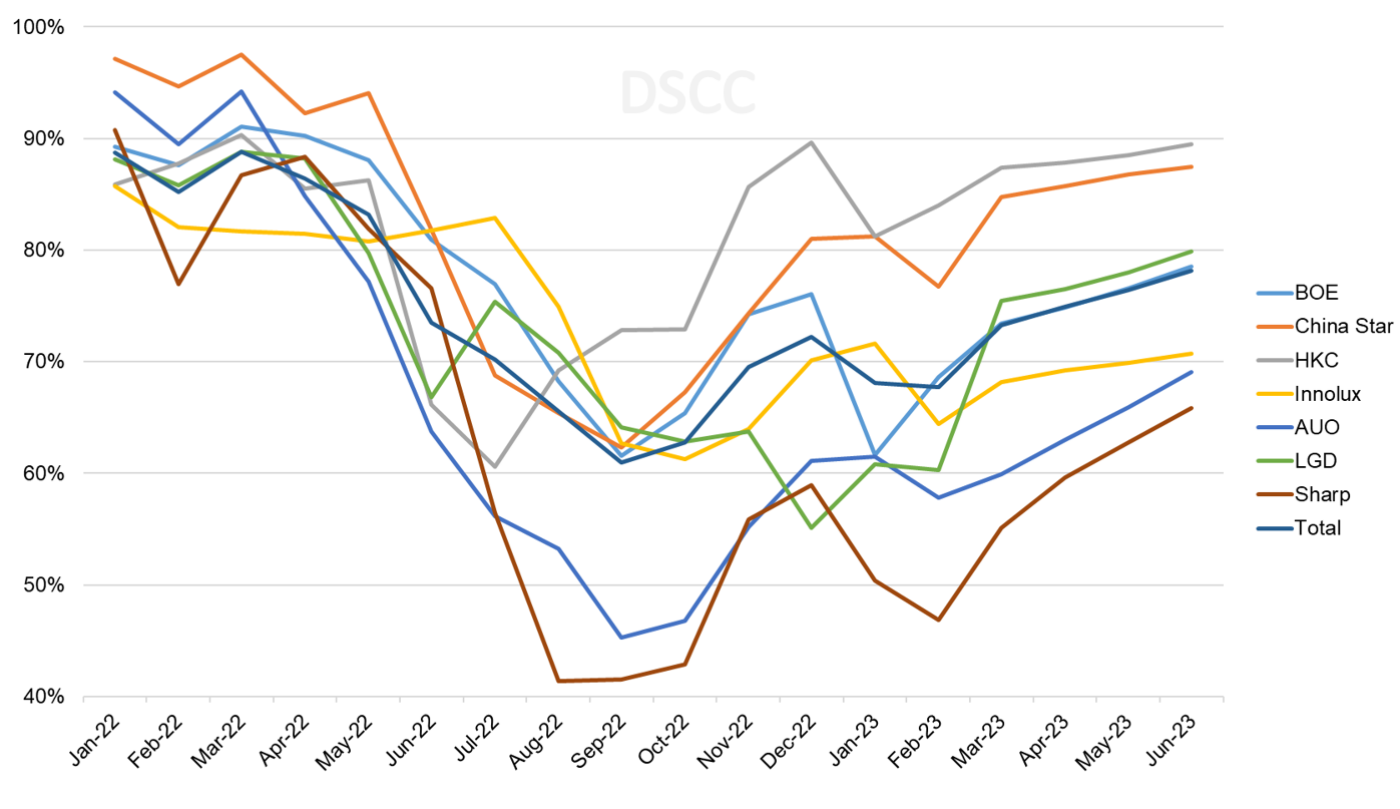
The pattern of prices mimics a similar pattern in fab utilization as shown in the next chart. Although the utilization pattern varied for individual companies, total TFT LCD fab utilization hit bottom in September 2022 with fabs running at only 61% of capacity. UT% increased modestly in October and November and then paused in December but resumed its increase in Q1’23.
TFT LCD Monthly Fab Utilization by Manufacturer
As we look at pricing on an area basis, we are seeing a narrowing of the range of prices. The larger screen sizes up to 85” enjoyed a significant price premium over smaller sizes, but the price premium for 65” was eliminated in Q2’22 and for the past year the price premium for 75” panels and for 85” panels has been rapidly eroded. The area premium for 75” and 85” will be further reduced in Q1 and Q2’23 as the prices for smaller sizes increase at a faster rate.
Monthly Area Prices per Square Meter for TV Panels
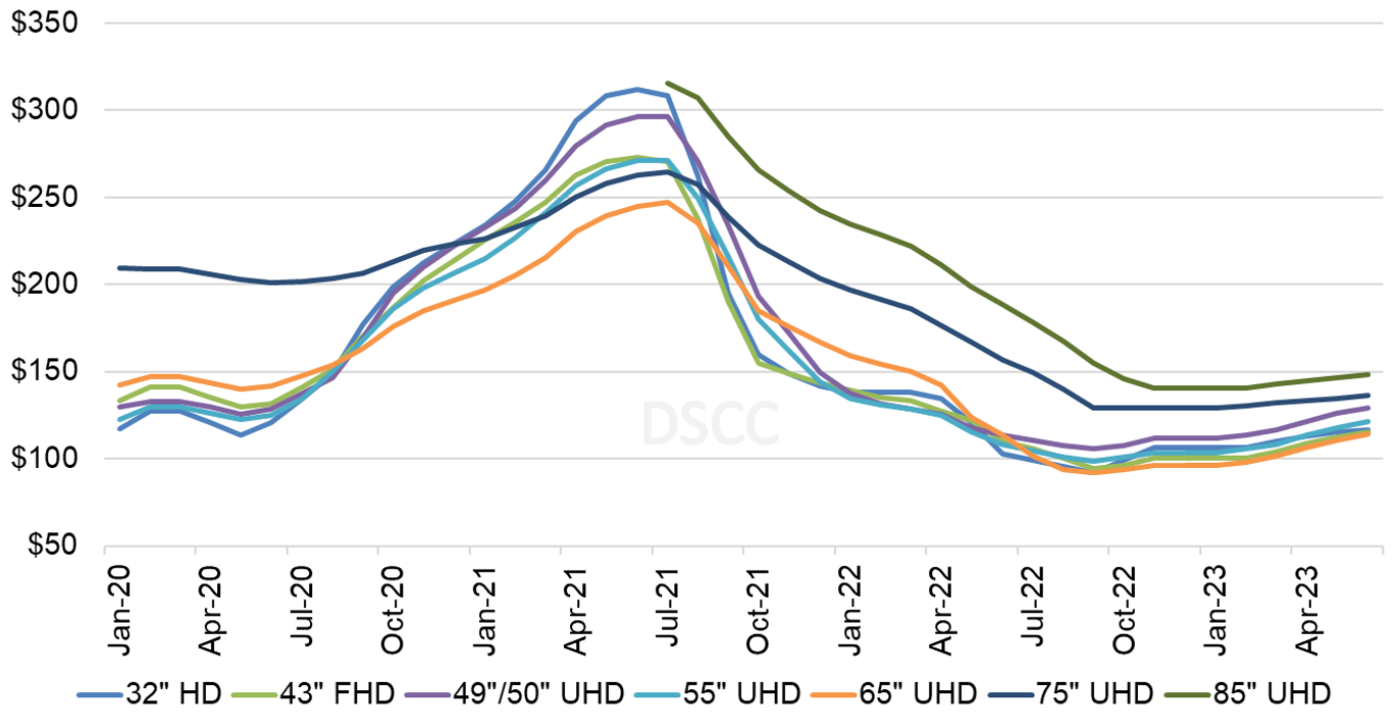
In June 2022, a 75” panel was priced at $144 per square meter, a $41 or 40% premium over the 32” area price. In September 2022 when the market hit bottom, the 75” premium over 32” had dropped to $37 but was still the same in percentage terms at 40%. By January 2023, the 32” price had increased while the 75” price did not, reducing the premium to $23 per square meter or 21%. With price increases continuing in Q2 2023, by June the 75” price will be only $19 or 16% higher than the price for 32”.
The lower panel prices and soft demand led to operating losses for panel makers relying on LCD production in Q3 and Q4 2022. The average operating margin across the flat panel display industry in Q3, excluding SDC, was a 13% loss. We still await the results of the big Chinese panel makers, but LGD’s operating margin got slightly worse while both AUO and Innolux improved their operating margin slightly. The price increases in Q1’23 along with higher fab utilization are likely to allow for another modest improvement in panel maker operating margins, but they are likely to remain deeply in the red through the first half of 2023.
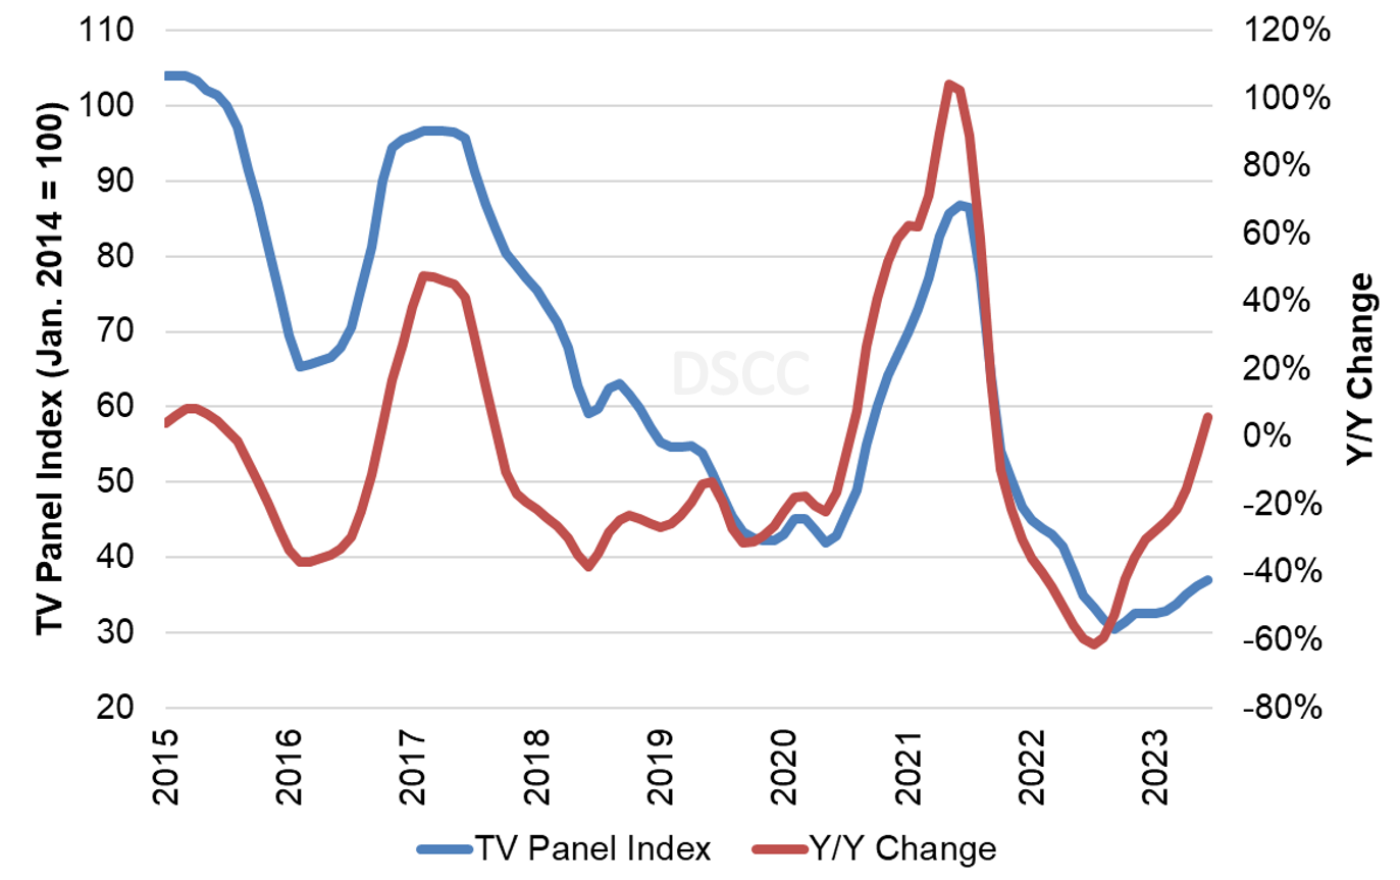
Our final chart in this sequence shows our LCD TV panel price index, taking a longer view from 2015 through June 2023. The expected price increases in March 2023 will bring our index up to 34, compared to the low of 30.5 in September 2022. We expect the price index to cross into positive territory in June 2023 on a Y/Y basis for the first time since September 2021.
LCD TV Panel Price Index
Although it appears that the worst is over for panel prices, the industry’s capacity still far outstrips the likely demand for the foreseeable future. The modest rally in the first half of 2023 will help panel makers to reduce their losses, but LCD makers will need prices to continue to increase in the second half of the year to bring operating margins into the black.
本記事の出典調査レポート
Quarterly All Display Fab Utilization Report
一部実データ付きサンプルをご返送
ご案内手順
1) まずは「お問い合わせフォーム」経由のご連絡にて、ご紹介資料、国内販売価格、一部実データ付きサンプルをご返信します。2) その後、DSCCアジア代表・田村喜男アナリストによる「本レポートの強み~DSCC独自の分析手法とは」のご説明 (お電話またはWEB面談) の上、お客様のミッションやお悩みをお聞かせください。本レポートを主候補に、課題解決に向けた最適サービスをご提案させていただきます。 3) ご購入後も、掲載内容に関するご質問を国内お客様サポート窓口が承り、質疑応答ミーティングを通じた国内外アナリスト/コンサルタントとの積極的な交流をお手伝いします。
