iPhone 14用パネル調達動向~パネルメーカーシェア等の月次実績
冒頭部和訳
2022-2023年のスマートフォン市場において、iPhone 14シリーズが数少ない好材料であることは間違いない。経済の低迷にもかかわらず、このシリーズによってAppleはシェアを拡大し、ASP (平均単価) はiPhone 13シリーズを超える水準に上昇している。以下のグラフは、DSCCがサプライチェーン情報源から得た月次パネル調達実績データを示しており、2021-2022年シーズンのiPhone 13シリーズと2022-2023年シーズンのiPhone 14シリーズを比較している。
More DSCC Analysis on iPhone 14 Monthly Panel Procurement Results and Outlook
※ご参考※ 無料翻訳ツール (DeepL)
The iPhone 14 Series is unquestionably one of the few bright spots in the 2022 and 2023 smartphone market. It has allowed Apple to gain share and even boost its blended ASPs vs. the iPhone 13 Series despite the downturn in the economy. In the following charts, you can see their monthly panel procurement results obtained by DSCC through its supply chain sources where the iPhone 13 series in 2021-2022 is compared with the iPhone 14 series in 2022-2023. As indicated:
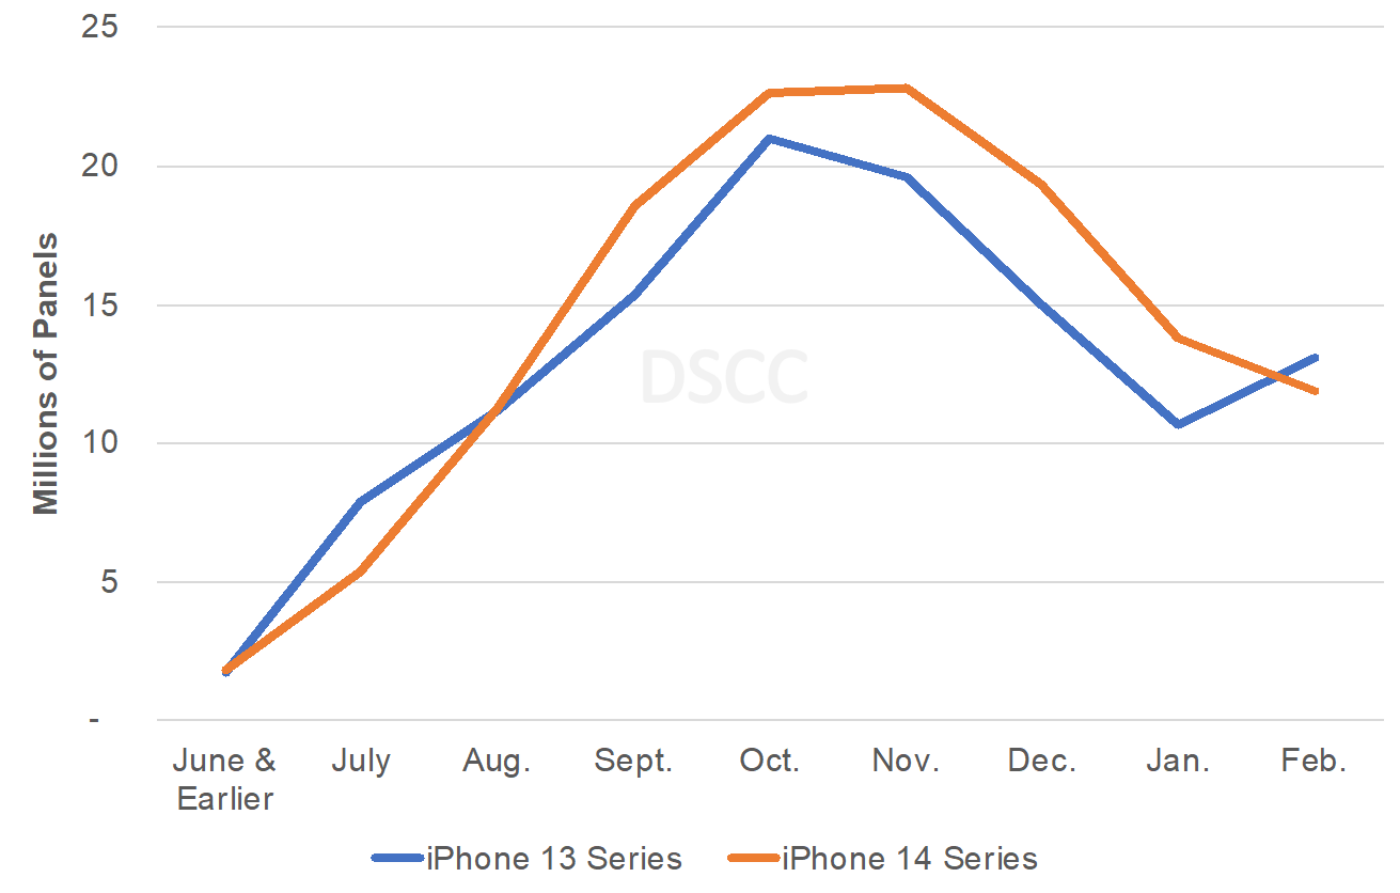
- While the iPhone 13 panel volumes were initially higher, the iPhone 14 volumes overtook the iPhone 13 volumes from August and led monthly through January. Demand was stronger than anticipated and the higher demand made the supply chain challenges more difficult. However, Apple said in its earnings call that supply is no longer an issue. Apple likely had some panel inventory that they were unable to ship in Q4. We have heard from other analysts that other components for the Pro models were also seeing high inventory at the end of the year also due to Apple’s factory shutdown issues in China in December, with Q1 expected to be weak. In the case of displays for the iPhone, we saw a 29% decline in new panel shipments in January as inventory was corrected. However, that correction or a decline in demand is expected to cause a further drop in panel shipments of 14% in February. As a result, we now see iPhone 14 Series panel shipments in February falling behind those of the iPhone 13 in the preceding year and we expect a similar result in March. February panel shipments are expected to be the lowest since August and the demand outlook will now likely come under greater scrutiny. Panel shipments for the first seven months (through December) were 11% higher than the iPhone 13 and that figure is expected to decline to 10% after February and likely shrink further in March.
Apple’s iPhone 14 Series vs. iPhone 13 Series Procurement Over the First Nine Months
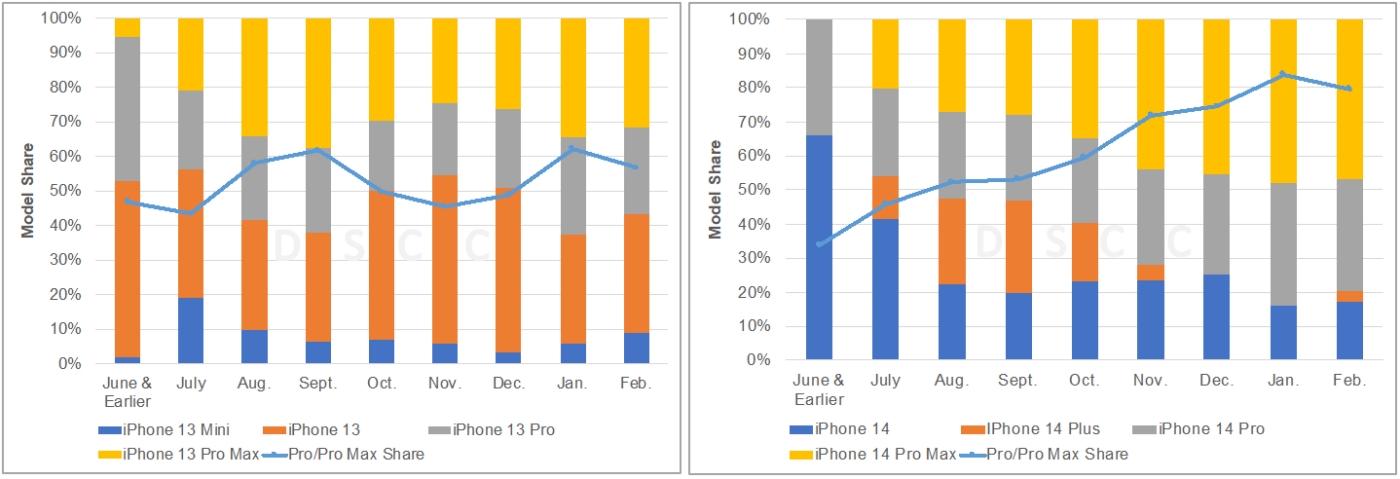
The iPhone 14 has also succeeded in achieving a much richer mix than the iPhone 13. The iPhone 14 Pro Max and the iPhone 14 Pro have achieved dramatic growth vs. their 13 counterparts. You can see in the right chart here that the Pro/Pro Max share of the iPhone 14 panel volumes have been significantly higher than the iPhone 13, accounting for a 66% share through February vs. a 53% share for the iPhone 13 series. The mix has continued to rise through the launch, reaching a 75% share in December and at least an 80% share in January and February. Also of note, is how the Plus model has failed to secure much share after replacing the failed Mini. It seems that Apple’s users are really gravitating toward the improved cameras on the Pro/Pro Max models and potentially the Dynamic Island as well, which gives Pro/Pro Max cameras a unique look.
In comparing the iPhone 14 Series vs. the iPhone 13 Series through February, we see the following changes in volumes by. Model:
- iPhone 14 Pro Max: Up 43%;
- iPhone 14 Pro: Up 32%;
- iPhone 14: Down 36%;
- iPhone 14 Plus vs. iPhone 13 Mini: Up 62%, which speaks to how bad the iPhone 13 Mini performed as the iPhone 14 Plus only has an 11% share of iPhone 14 Series volumes. The 13 Mini only had a 7% share of iPhone 13 Series volumes through February of 2022.
What does this mean for revenues and blended ASPs? Cumulative iPhone revenues through February on a panel shipment timeline are 17% higher with blended ASPs 6% higher despite keeping the Pro and Pro Max ASPs flat. Of course, revenues are smaller on a phone shipment timeline due to the time gap between panel and phone shipments and don’t consider different prices or currency changes overseas.
iPhone 13 Series vs. iPhone 14 Series Mix through February 2022 vs. 2023
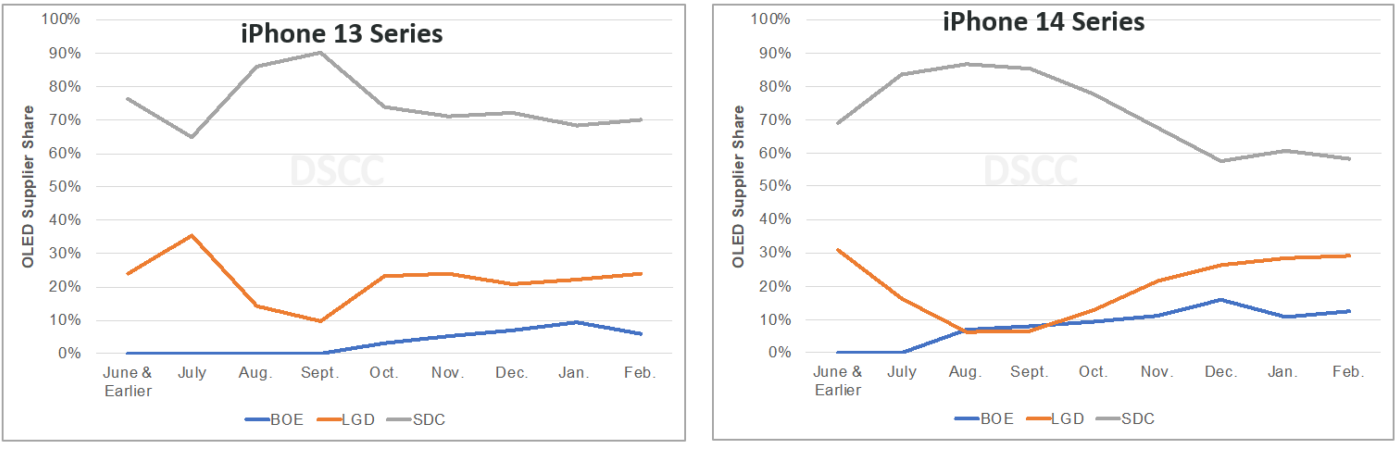
Also of note are the changes in panel supplier share. SDC dominates Apple’s OLED business. SDC maintained a 74% cumulative share through December, but its share is expected to fall to 71% through February with LGD gaining share for six straight months to reach a 29% share in February and a 19% cumulative share. Apple is looking to improve its margins by allocating more share to LGD on the Pro Max with a healthy price gap between the two companies due to SDC’s device and manufacturing technology, capacity and other advantages. LGD’s cumulative share was higher at this point on the iPhone 13 at 21% due to its challenges in getting qualified for the LTPO based 14 Pro Max. SDC’s share was also higher on the iPhone 13 at this point at 75% due to a lower position for BOE. BOE is taking share on the base iPhone 14 model due to its willingness to undercut both Korean suppliers. BOE’s cumulative share is expected to be 10% through February vs. 4% on the 13 Series.
iPhone 13 and 14 Shipment Share by Panel Suppliers
For more insights into Apple’s display supply chain on a regular basis, contact お問い合わせ窓口.
本記事の関連調査レポート
Quarterly Advanced Smartphone Display Shipment and Technology Report
一部実データ付きサンプルをご返送
ご案内手順
1) まずは「お問い合わせフォーム」経由のご連絡にて、ご紹介資料、国内販売価格、一部実データ付きサンプルをご返信します。2) その後、DSCCアジア代表・田村喜男アナリストによる「本レポートの強み~DSCC独自の分析手法とは」のご説明 (お電話またはWEB面談) の上、お客様のミッションやお悩みをお聞かせください。本レポートを主候補に、課題解決に向けた最適サービスをご提案させていただきます。 3) ご購入後も、掲載内容に関するご質問を国内お客様サポート窓口が承り、質疑応答ミーティングを通じた国内外アナリスト/コンサルタントとの積極的な交流をお手伝いします。