TV用LCD価格 (2月度分析)
冒頭部和訳
TV用LCD価格は2022年9月に底を打ち、第4四半期には価格が上昇したサイズもあったが、その上昇は長くは続かなかった。12月から2月にかけて価格に動きは見られず、こう着状態にあるようだ。ほとんどのサイズの価格は第4四半期に上昇したが、値上がり幅はわずかだった。LCD価格の下落スパイラルの最終段階では、FPDサプライチェーンにおける大幅な在庫減少と、それに対応するFPDメーカーの生産ライン稼働率の大幅な低下という特徴が見られた。
しかし、需要のシグナルは弱く、価格に上昇の勢いは見られない。中国ではW11 (11月11日) / W12 (12月12日) 商戦の結果が期待外れに終わり、米国と欧州でもホリデーシーズンの結果は残念なものだった。中国では12月から1月にかけて新型コロナ関連の混乱が見られ、例年見られる旧正月の盛り上がりも台無しになった。その結果、FPDサプライチェーンの在庫は第1四半期も高水準にとどまった。
第1四半期にFPDメーカーの稼働率が低い状態が続いたことで、業界の過剰在庫はようやく解消に向かっており、3月から第2四半期にかけては緩やかな価格上昇が見込まれている。
一つ目のグラフはTV用LCD価格動向の最新予測である。予測期間は2023年6月まで延長されている。2020年中盤から2021年中盤までパンデミックによって価格は急騰、その後半部分がグラフに示されている。2021年秋になると、業界史上最も急速な価格下落が始まった。第2四半期の平均価格下落率は13.1%だったが、第3四半期の平均価格下落率は16.5%とさらに拡大した。
LCD TV Panel Prices Holding Steady
※ご参考※ 無料翻訳ツール (DeepL)
After LCD TV panel prices hit bottom in September 2022 and prices for several sizes increased in Q4, the rally in prices proved to be short-lived and prices have been in a holding pattern, with no changes from December into February. While prices for most sizes increased in Q4, the increase was modest. The last phase of the downward spiral in panel prices was characterized by a massive inventory drawdown in the display supply chain and a corresponding massive reduction in fab utilization by panel makers.
However, weak demand signals have undermined the price rally. Disappointing results from the double 11 and double 12 shopping events in China have combined with disappointing holiday sales in the US and Europe. COVID-related disruptions in China in December and January spoiled the traditional Lunar New Year surge. As a result, display supply chain inventory remains elevated in Q1.
Continued low utilization at panel makers in Q1 will help the industry finally to deplete the excess inventory, and we now expect a modest price rally starting in March and extending into Q2.
The first chart here highlights our latest TV panel price update, now extended to June 2023, showing the latter part of pandemic-fed surge from mid-2020 to mid-2021 and then the fastest price decreases in the industry starting in the autumn of 2021. The average Q/Q price decline in Q2’22 was 13.1% and the decline in Q3’22 was even larger at 16.5%.
LCD TV Panel Prices
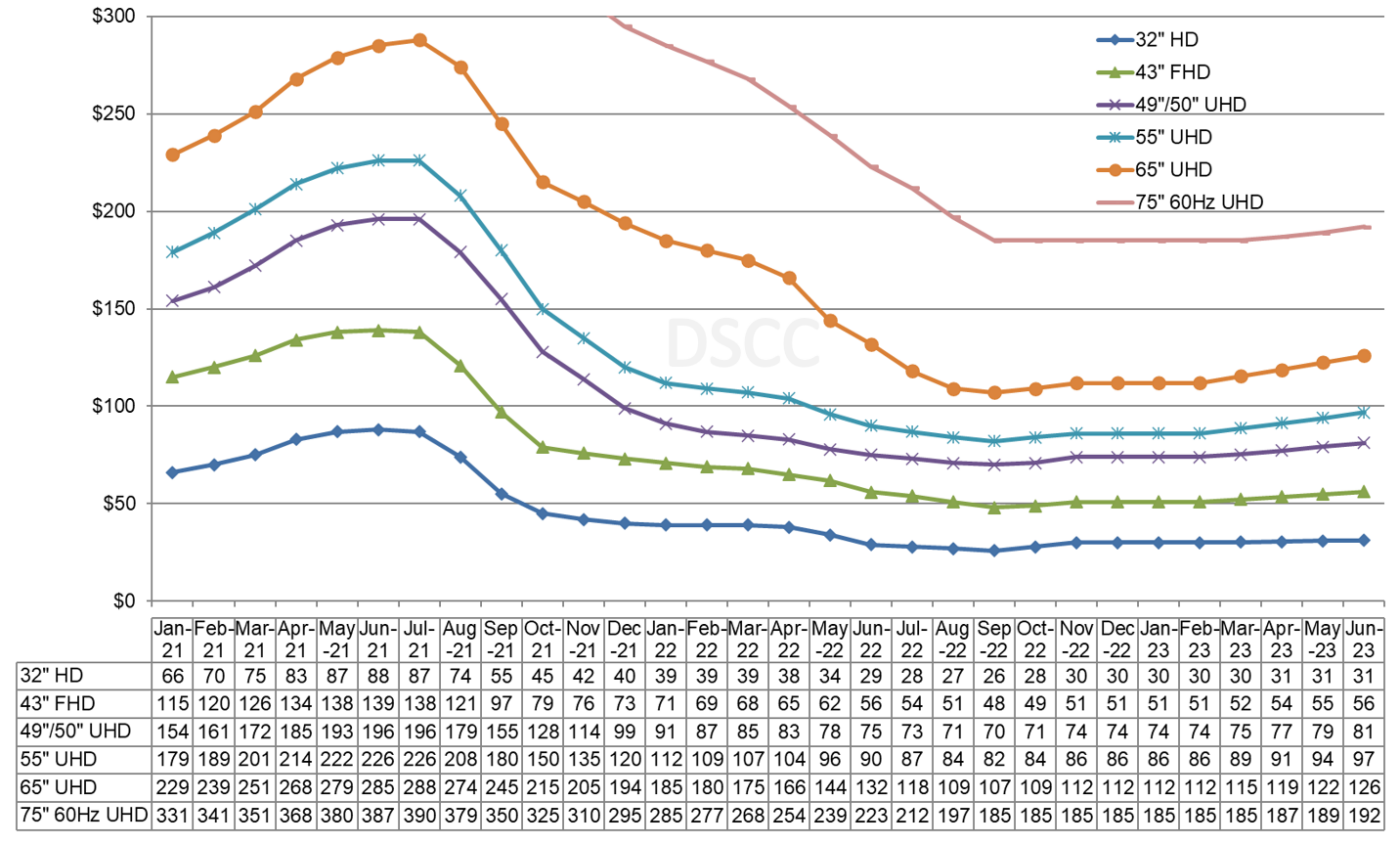
Prices for smaller sizes started to increase in October, but because of the offsetting patterns in Q3 and Q4 (down during Q3 and up during Q4) the average price for Q4 increased only 0.5% over the average price in Q3. The average price in December was 6.1% higher than in September, so even if prices remain flat during the current quarter, there will be a Q/Q increase.
We expect prices to remain unchanged again in February before beginning a slow increase in March. On average, we expect March prices to be 1.9% higher than December prices and expect Q1 2023 prices to be 1.7% higher than Q4’22 prices.
As we look at pricing on an area basis, the larger screen sizes made efficiently on Gen 10.5 fabs, 65” and 75”, long enjoyed a significant price premium over smaller sizes, but the price premium for 65” was eliminated in Q2’22 and for the past year the price premium for 75” panels has been rapidly eroded. The area premium for 75” will be further reduced in Q1 and Q2’23 as the prices for smaller sizes increase at a faster rate than 75”.
Monthly Area Prices per Square Meter for TV Panels
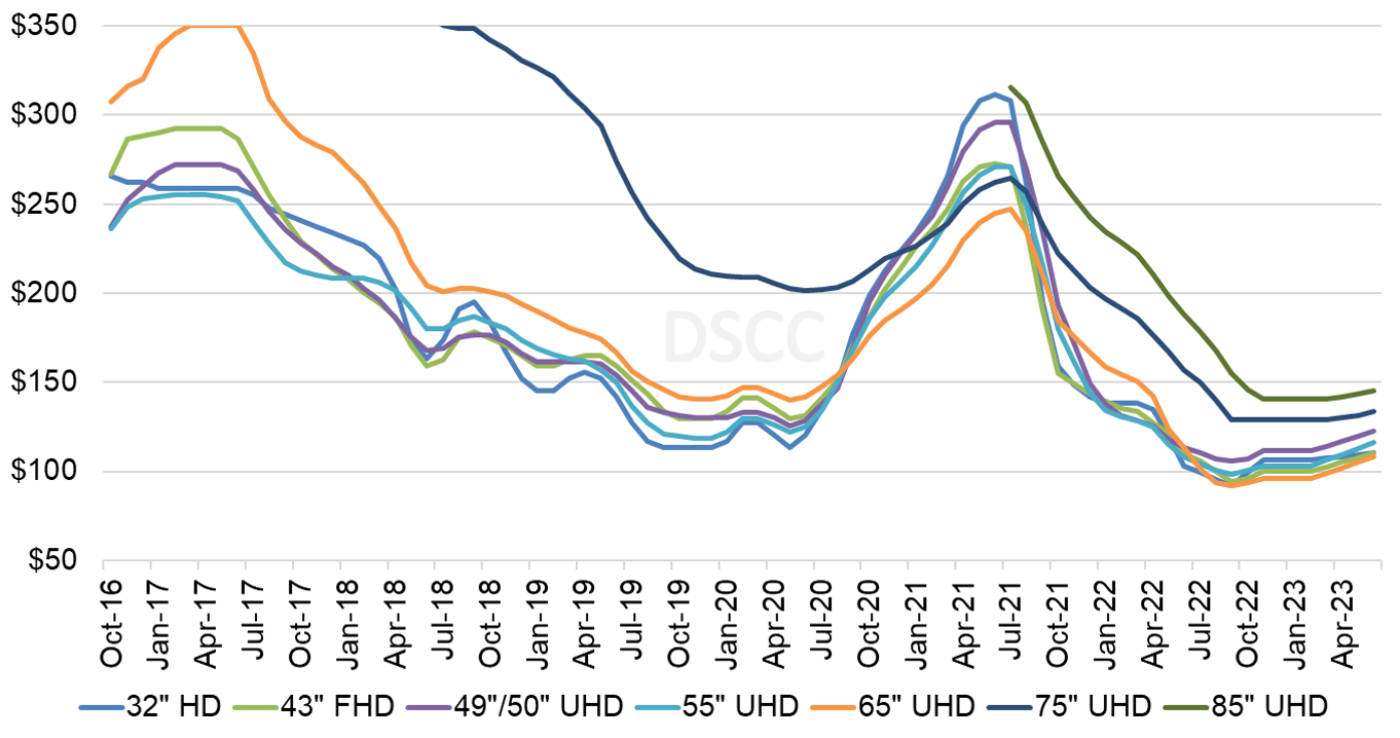
In June 2022, a 75” panel was priced at $144 per square meter, a $41 or 40% premium over the 32” area price. In September 2022 when the market hit bottom, the 75” premium over 32” had dropped to $37 but was still the same in percentage terms at 40%. By January 2023, the 32” price had increased while the 75” price did not, reducing the premium to $23 per square meter or 21%. Although we expect the 75” price to increase starting in April, the 32” price will increase faster, and the area price premium for 75” will fall to $22 but remain at 21%.
The lower panel prices and soft demand led to operating losses for panel makers relying on LCD production in Q3’22. The average operating margin across the flat panel display industry in Q3, excluding SDC, was a 13% loss. With panel prices increasing in the fourth quarter, it is possible that the results improved, but not by much. To date, we have seen only LGD and SDC’s Q4 results; LGD’s operating margin was 0.8% worse in Q4 while SDC’s margin was 1.4% worse, but both companies earn a majority of revenue from OLED panels so are less affected by LCD panel price changes. We will start to see the results of Taiwan panel makers this week.
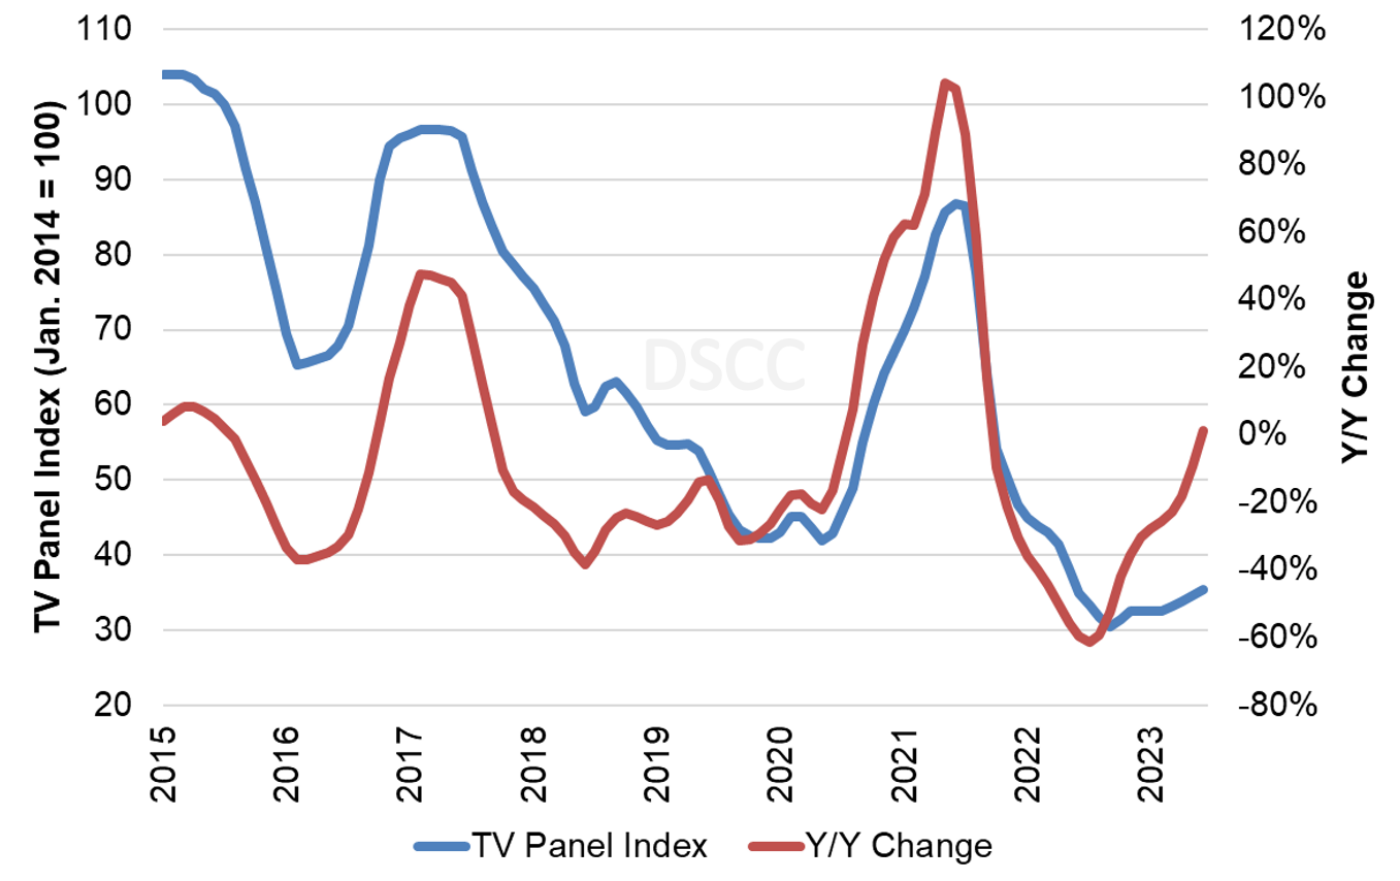
Our final chart in this sequence shows our LCD TV panel price index from 2015 through June 2023. The expected price increases starting in March 2023 will bring our index up to 35, compared to the low of 30.5 in September 2022. The price index cross into positive territory in June on a Y/Y basis for the first time since September 2021.
LCD TV Panel Price Index
It appears that the worst may be over for panel prices, but the industry’s capacity still far outstrips the likely demand for the foreseeable future. After the excess inventory has been removed from the display supply chain, we expect that the prices will stage a modest rally, helping panel makers to reduce their losses, but LCD makers are likely to sustain operating losses through the first half of the year.
