Q2'22のFPDメーカー各社の業績分析
冒頭部和訳
FPDメーカーの出荷金額がQ4’21に過去最高を記録した後、Q1’22とQ2’22に連続して二桁パーセントの減少となり、業界全体の利益は損益計算書のすべてのレベル、すなわち売上総利益、営業利益、税引前利益、純利益、EBITDA利益のいずれも前期より低くなったことが、DSCCの Quarterly Display Supply Chain Financial Health Report (一部実データ付きサンプルをお送りします) の財務実績概要で明らかになった。FPDメーカー全社からQ2’22財務業績が報告され、今年上半期の業界全体の業績がまとめられた。大半のFPDメーカーにとって2021年の多額の利益は遠い昔の話で、多くのメーカーが損失を報告している。
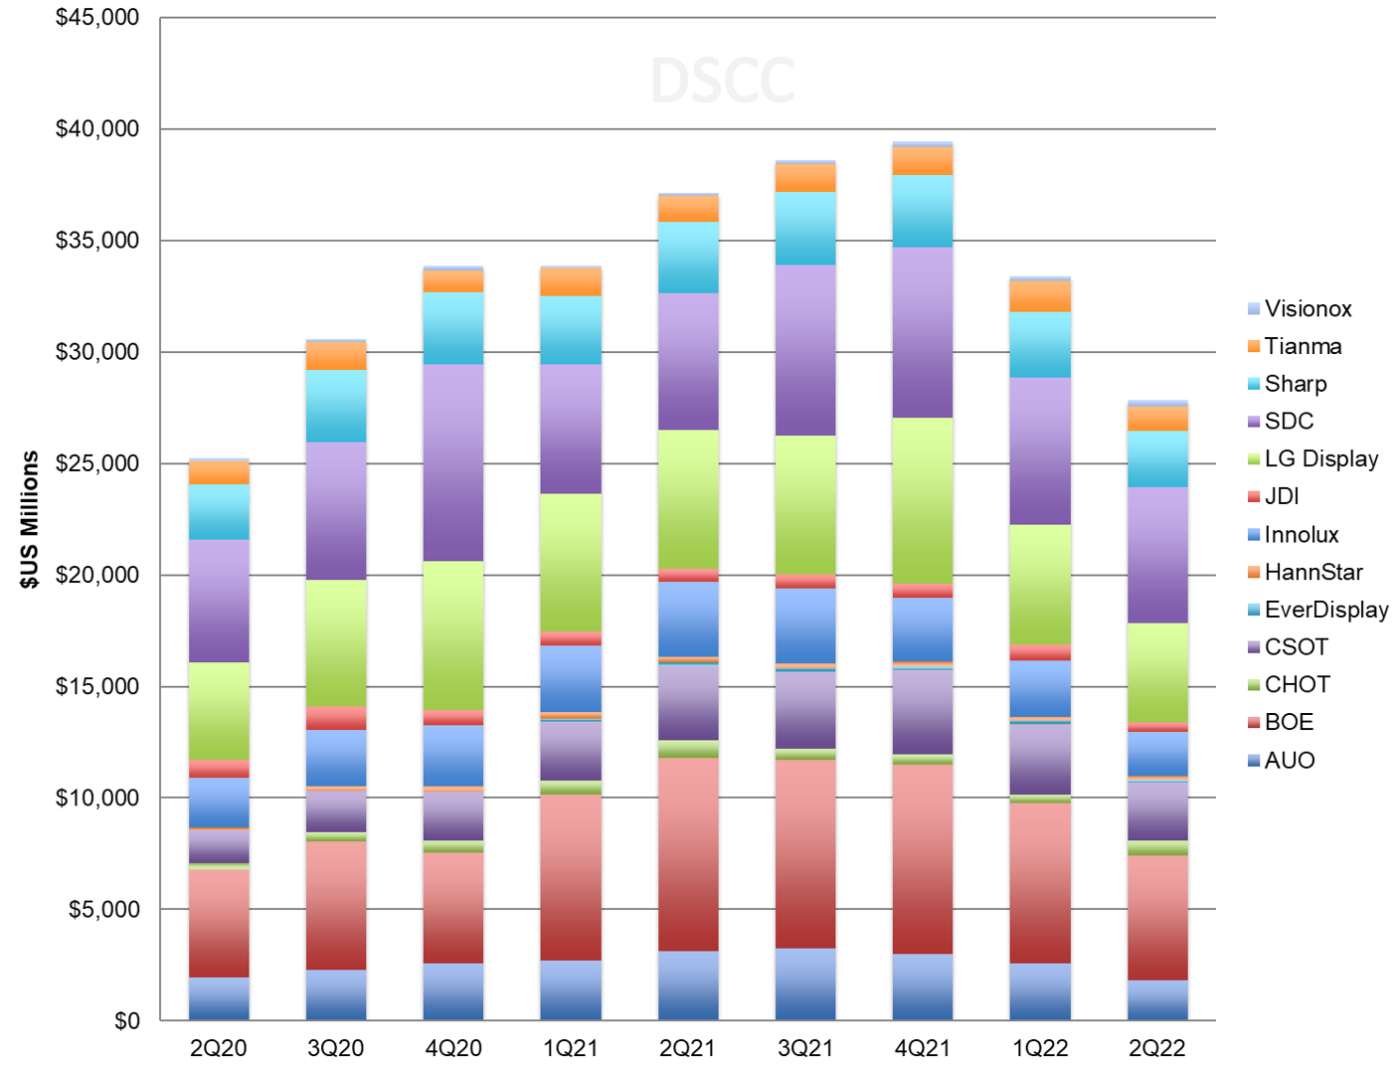
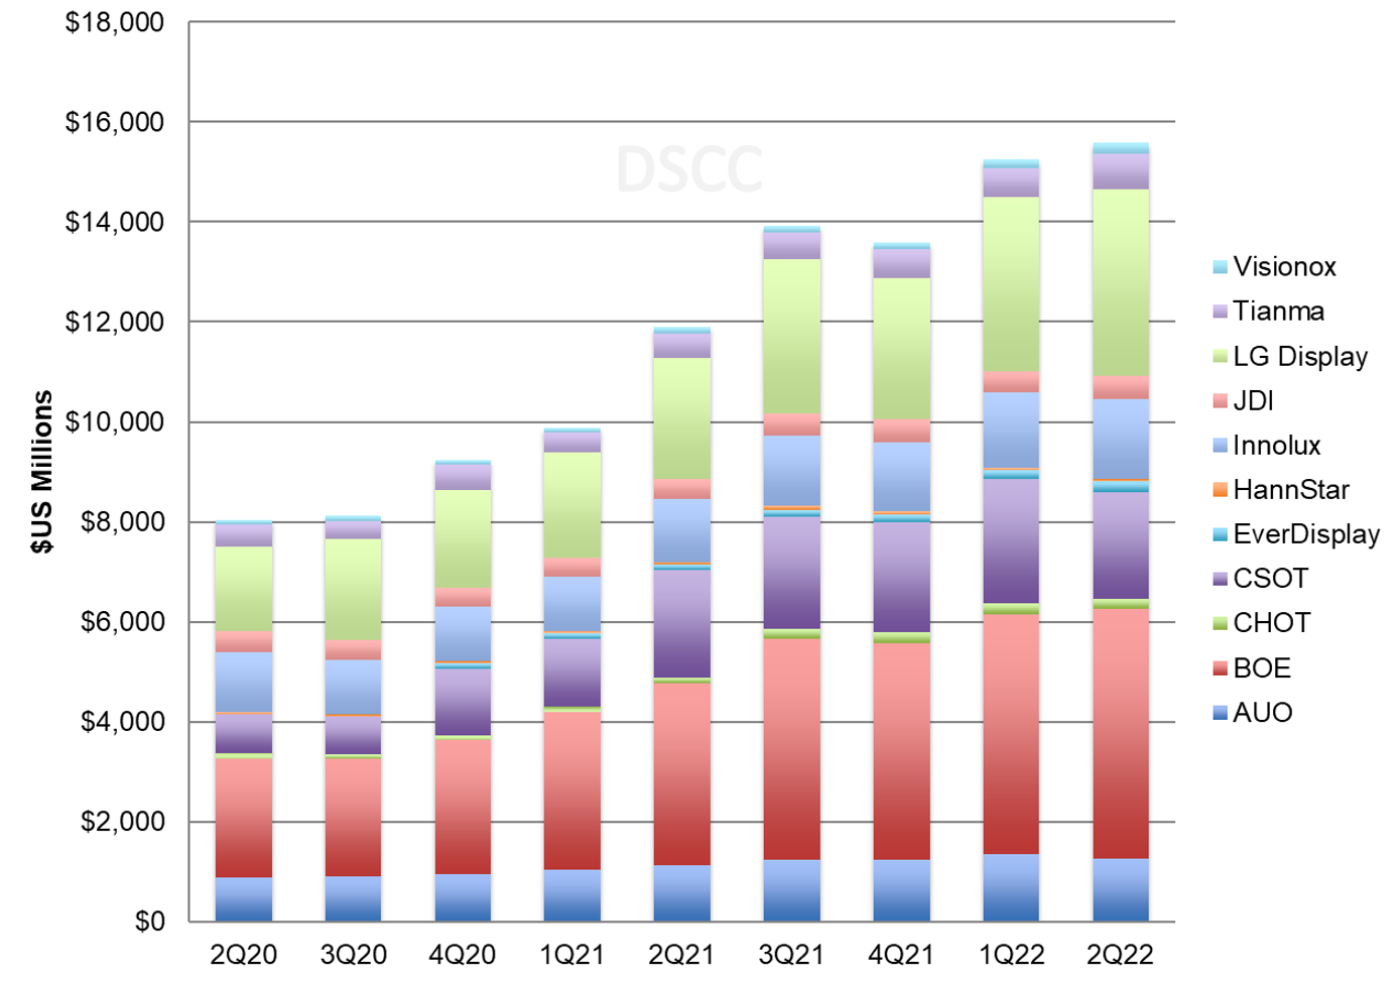
1つ目のグラフは上場FPDメーカー13社の四半期別出荷金額を示している。総出荷金額は前期比17%減、前年比25%減の278億ドルとなり、過去最高だったQ4’21の394億ドルから30%減少した。BOE がLCDの高価格を追い風に5四半期連続で金額シェアトップの座を維持した後、Q2’22にはSamsung Displayが首位の座を奪還した。Samsung Displayの出荷金額は前期比8%減となったが、業界全体の出荷金額に対する同社のシェアは20%から22%に上昇した。BOEの出荷金額は前期比22%減、前年比35%減となり、同社のシェアは21.5%から20.2%に低下した。LGD のシェアは16%で安定しているが、同社の出荷金額は業界全体と同じく前期比で17%減少した。その後にはAUO、Innolux、CSOT、Sharpの4社が7% から9%のシェアで続いており、各社の出荷金額は18億ドルから26億ドルの範囲にある。
Flat Panel Display Revenues and Profits Continued to Deteriorate in Q2’22
After reaching their all-time high in Q4’21, flat panel display maker revenues declined at a double-digit % sequentially for both Q1 and Q2’22, and total industry profits declined Q/Q at all levels of the income statement – gross profits, operating profits, pre-tax profits, net profits and EBITDA profits, according to the summary of their financial performance in DSCC’s Quarterly Display Supply Chain Financial Health Report (一部実データ付きサンプルをお送りします). With all panel makers reporting their Q2’22 results, we can compile a full industry review for the first half of the year. The hefty profits of 2021 are now distant in the rear-view mirror for most panel makers, and many of them reported losses.
The first chart in this section shows quarterly revenues for the 13 publicly traded panel makers. Total revenues decreased by 17% Q/Q and were down by 25% Y/Y at $27.8B, down 30% from their all-time high of $39.4B in Q4’21. After five quarters where BOE held the top position in revenue share on the strength of high LCD panel prices, Samsung Display regained the lead in revenue in the second quarter. Samsung revenues decreased by 8% Q/Q but it gained share from 20% to 22% of industry revenues. BOE revenues fell by 22% Q/Q and 35% Y/Y and BOE’s share dropped from 21.5% to 20.2%. LGD’s share held steady at 16% as its revenues declined 17% Q/Q in line with the industry total. Then there is a cluster of four companies between 7% and 9% share: AUO, Innolux, CSOT and Sharp, each with revenues in the range of $1.8B - $2.6B.
Flat Panel Display Maker Revenues
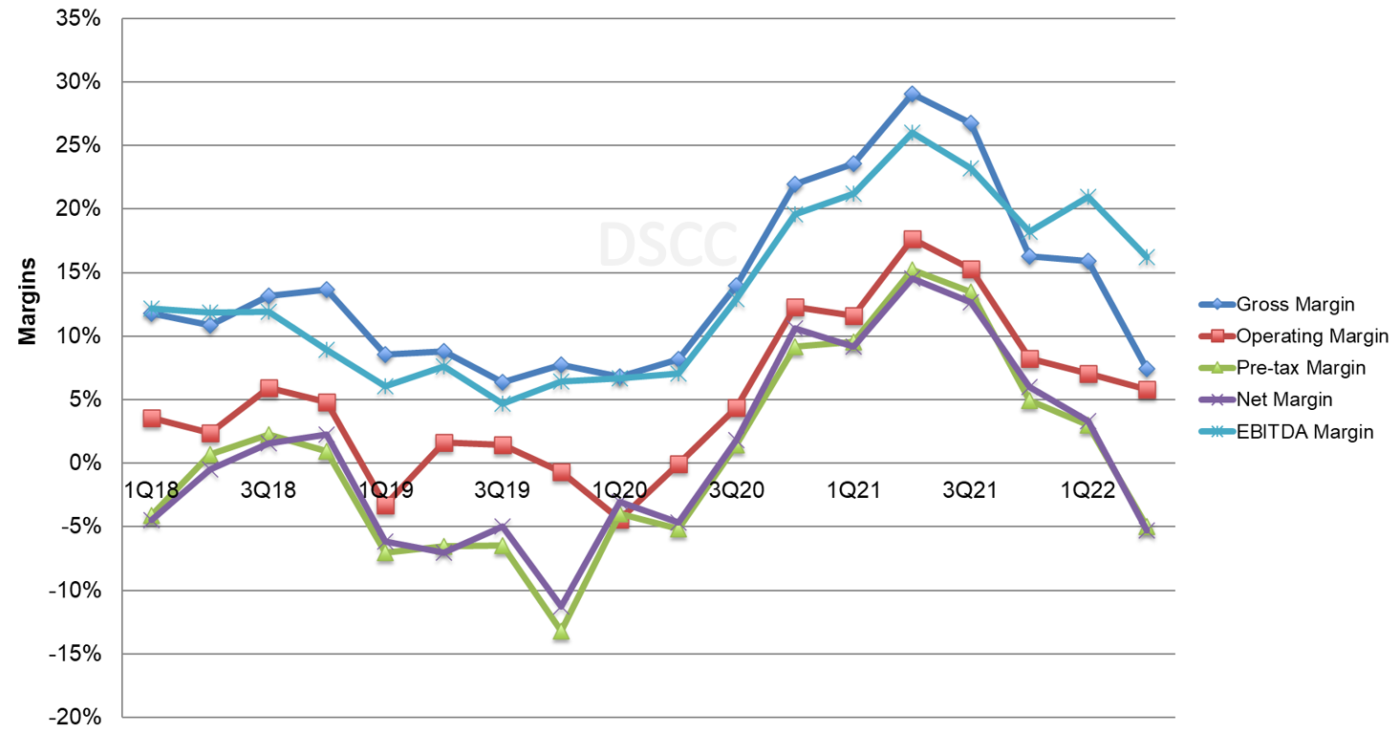
The effect of the Crystal Cycle is clearly shown on the next chart of industry margins. The increase in LCD panel prices for TVs and IT products increased gross margins and EBITDA margins for five straight quarters to a peak in Q2’21 and the down part of the cycle started in Q3. Industry margins declined between 1% and 9% Q/Q and are now down 10-22% from their all-time highs set in Q2’21.
Note that these margin figures exclude certain companies from certain metrics: for example, Samsung reports operating margin for its display business, but not pre-tax or net margin. Nevertheless, the series is consistent over time, clearly demonstrating the industry’s long descent from 2017-2019, sharp recovery in 2020-2021, peak in Q2’21 and decline into 2022.
Display Industry Margins
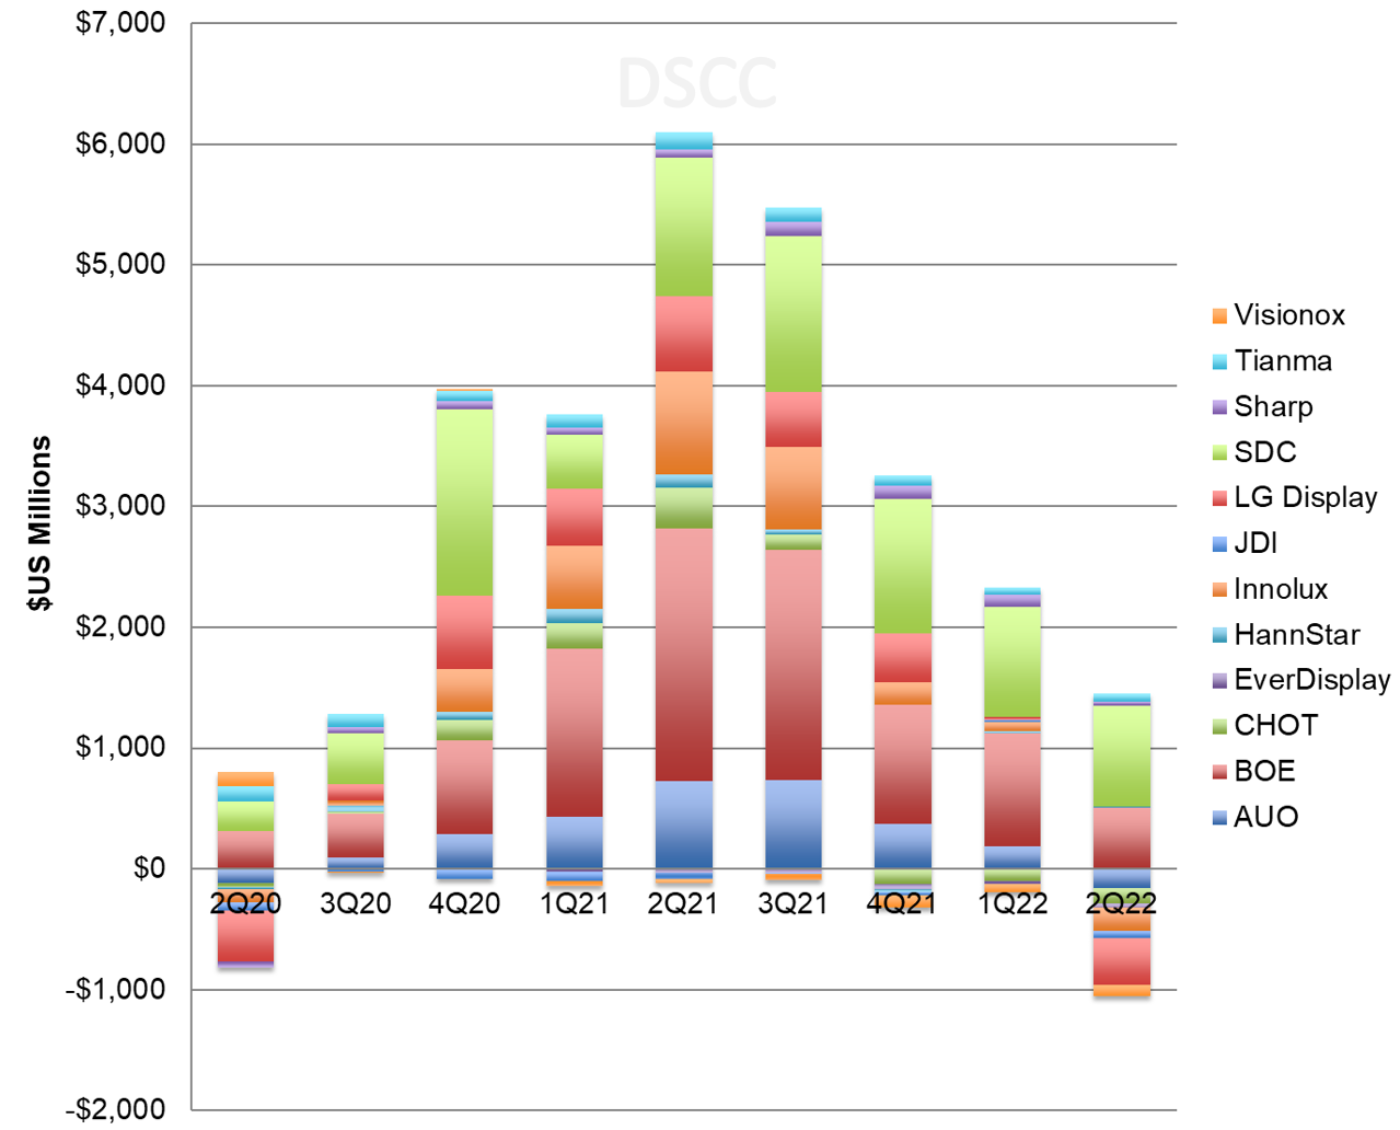
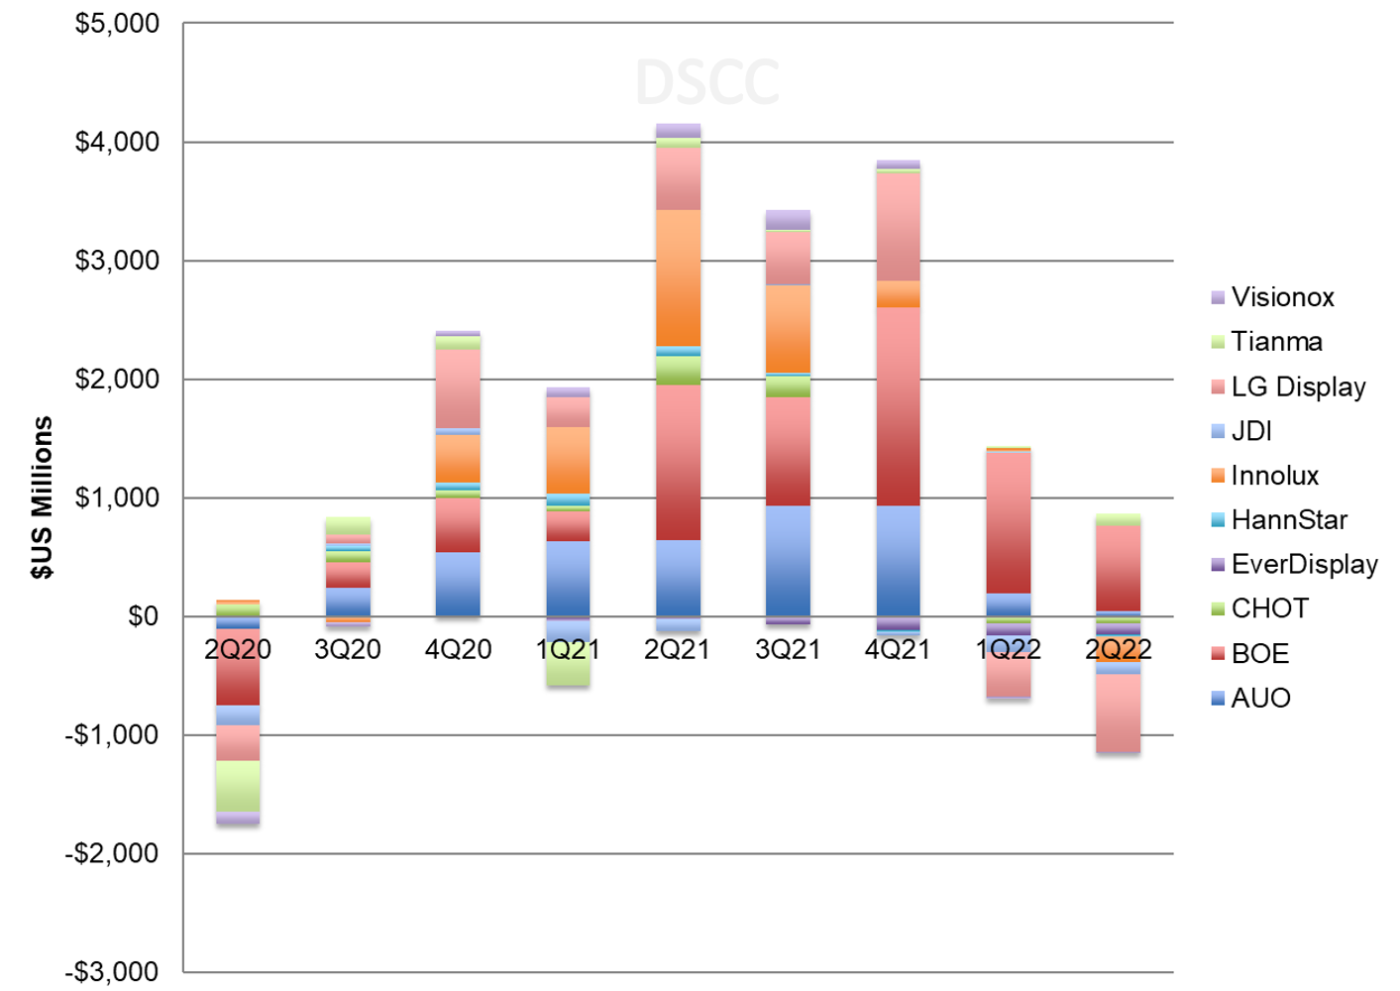
During down-cycle of 2018-2019, display industry operating profits were dominated by Samsung Display, but with rising LCD panel prices BOE took the top spot starting in Q1’21. Since LCD prices have fallen, Samsung Display is again the top dog in terms of operating profits. BOE remained profitable in Q2, and both Samsung and BOE operating profits were greater than the total for the industry as a whole as most other panel makers fell to operating losses. Only five of the twelve panel makers reported positive operating profits and only Samsung and BOE reported operating profits greater than $100M for the quarter, whereas four companies (AUO, CHOT, Innolux and LG Display) reported operating losses larger than $100M. The total industry operating results were still positive because of the large profits by Samsung, but total industry operating profits decreased by 81% Q/Q and by 93% compared to a year ago.
Panel Maker Operating Results
Net profit figures exclude Samsung and Sharp, which do not report net profits of their display businesses, and the rest of the display industry posted a net loss of $1.01B in Q2’22, compared to a net profit of $786M in Q1’22 and a net profit of $4.04B in Q2’21. In one year, the quarterly net profit of panel makers decreased by more than $5B. BOE was one of only three companies to report a net profit, leading the industry with a net profit of $334M.
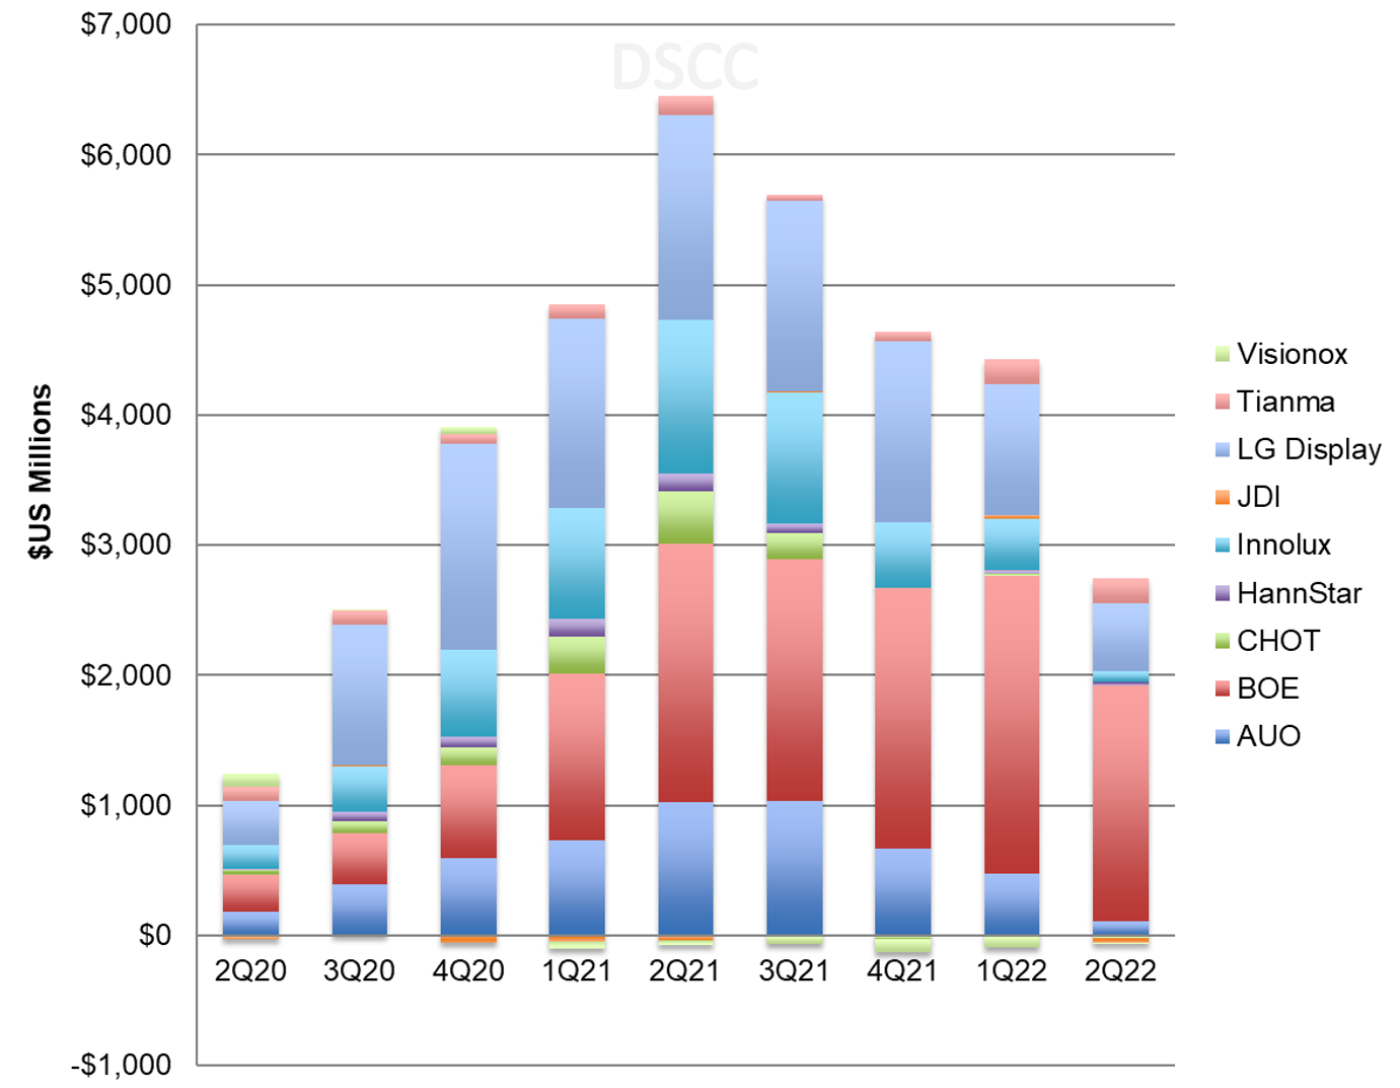
EBITDA by company is shown in the next chart, and EBITDA for the industry decreased by 38% Q/Q and by 58% Y/Y to $2.7B. Six of the nine panel makers reporting this result recorded positive EBITDA in Q2’22, with CHOT, JDI and Visionox reporting negative EBITDA. BOE again held the top spot in EBITDA with $1.8B in the quarter and LGD also recorded more than $500M in EBITDA, but LCD’s total dropped by almost 50% compared to Q1. EBITDA totals exclude Samsung, Sharp and CSOT, which do not report depreciation/amortization for their display businesses separately.
Panel Maker EBITDA
Turning to company balance sheets, we see that although several panel makers started reducing their utilization in June, it was not enough to prevent an increase in inventory in Q2’22. While panel maker inventories were constrained by tight supply as pandemic demand surged in the second half of 2020, inventories have been increasing since Q4’20 and total industry inventory increased by another $300M in Q2, up 2% Q/Q and 31% Y/Y. Inventories at the end of Q1’22 were more than $7.5B higher than Q2’20. With reduced revenues, inventory days increased by 15 days Q/Q and by 34 days Y/Y to 73. High inventory has put continuing pressure on panel prices in Q3.
Panel Maker Inventory Value
The profits during the pandemic allowed most of the panel makers to pay down debt and establish clean balance sheets, but with net losses and difficult cash positions debt to equity ratios started increasing again in Q2’22. Taiwan makers AUO, Innolux and HannStar have conservative balance sheets with negative net debt/equity, but BOE’s D/E increased from 53% to 59%, China Star’s increased from 83% to 115%, and LG Display’s D/E increased from 88% to 97%.
Historically, panel makers have been notorious for their miserable performance on free cash flow (FCF). In prior Crystal Cycles, periods of profit were typically accompanied by heavy capital investment, so FCF was minimal at the top of the Crystal Cycle and negative at the bottom. In 2018, industry FCF was a negative $7.2B, and the industry booked another $5.1B of negative FCF in 2019. Increasing profits in the second half of 2020 allowed the industry to reach positive FCF for the full year 2020 at +$1.0B. The industry hit a high water mark of FCF in 2021 with $12.4B, but in the first half of 2022 FCF evaporated. Total FCF for the ten companies that report this figure fell to a negative $288M, compared to a positive $739M in Q1’22 and a positive $4B in Q2’21. After seven consecutive quarters of positive free cash flow from Q3’20 through Q1’22, the industry fell into the red in Q2. BOE remained solidly on the plus side with a positive FCF of $724M; excluding BOE the FCF of the industry was more than $1B in the red.
Panel Maker Free Cash Flow
The industry saw its best upswing of the Crystal Cycle in 2020-2021 and is now seeing its worst downswing since at least 2008-2009. The companies which benefitted most during the upcycle concentrated on LCD panels for large-area applications; this includes the Taiwan panel makers but also CHOT, BOE and CSOT in China. With the start of the downcycle in Q3’21, the companies focused on large-area LCD are suffering disproportionately. With shipments and prices continuing to decline in the current quarter, we can expect Q3’22 to be even worse for LCD makers.
本記事の出典調査レポート
Quarterly Display Supply Chain Financial Health Report
一部実データ付きサンプルをご返送
ご案内手順
1) まずは「お問い合わせフォーム」経由のご連絡にて、ご紹介資料、国内販売価格、一部実データ付きサンプルをご返信します。2) その後、DSCCアジア代表・田村喜男アナリストによる「本レポートの強み~DSCC独自の分析手法とは」のご説明 (お電話またはWEB面談) の上、お客様のミッションやお悩みをお聞かせください。本レポートを主候補に、課題解決に向けた最適サービスをご提案させていただきます。 3) ご購入後も、掲載内容に関するご質問を国内お客様サポート窓口が承り、質疑応答ミーティングを通じた国内外アナリスト/コンサルタントとの積極的な交流をお手伝いします。
