下落が続くTV用LCD価格
冒頭部和訳
TV用LCD価格が引き続き下落しており、第2四半期に入ってもまだ下がっている。価格がキャッシュコストに接近するに従い、その下落ペースは鈍化しているものの、価格が底を打ち反発する兆候は見られない。ロシアによるウクライナ侵攻が世界のTV需要に悪影響を与える可能性と、高い在庫水準が相まって、第2四半期にも価格圧力の継続が示唆されている。
年間で最も販売が停滞する第2四半期に入り、TV用LCD市場はやや落ち着きを取り戻しているように見える。価格は2021年中盤のピークから劇的に下落したが、供給は第1四半期を通じて堅調に推移し、第2四半期の開始を迎えた。価格はキャッシュコストを下回る水準までに下落の余地はあまりないが、需要に明らかな推進要因はなく、ウクライナでの戦争によって需要の不透明感も高まっている。
下図はTV用LCD価格の最新データ更新を反映したものだが、2020年中盤から2021年中盤までのFPD業界史上最大の価格上昇と、その後の2021年秋に見られた業界最速の価格下落の両方を示している。いずれのサイズのLCDも、11月以降は前年比で価格が下がっている。価格の下落はQ1’22に緩和され、3月の平均価格下落率は1.8%で、2021年7月以来最も低い下落率だった。ただし、これほど減速した価格下落ペースでさえ年率換算ではほぼ20%になるため、無期限に持続可能なものではない。
LCD TV Panel Prices Continue to Decline
LCD TV panel prices continue to decline and more is on the way as we progress to the second quarter. Although the pace of price decreases is slowing as prices approach cash costs, there is no sign that prices will hit bottom and rebound. The potential for a negative impact on global TV demand from the Russian war in Ukraine combined with high inventory levels suggests continued price pressure in Q2.
As we head into the slowest selling season of the year in Q2, the LCD TV panel market appears to be in a sort of a lull. Prices have declined dramatically from their peaks in mid-2021 but supply has continued to be robust throughout the first quarter and to start the second. Prices cannot fall much further before they are below cash costs, but there are no obvious drivers of demand, and demand uncertainty has been heightened by the war in Ukraine.
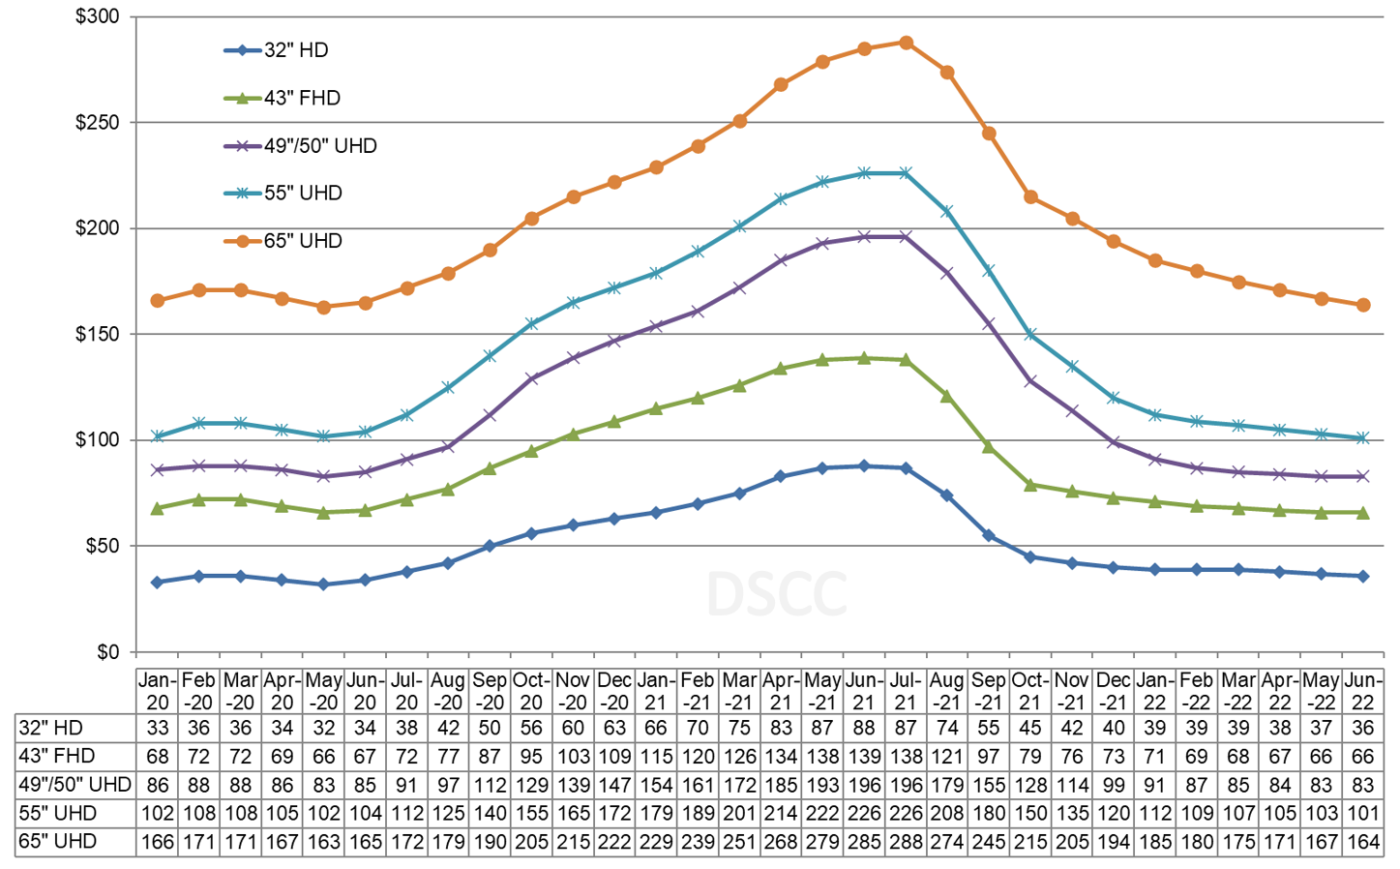
The first chart here highlights our latest TV panel price update, showing the both the biggest price increases in the history of the flat panel display industry, from mid-2020 to mid-2021 and then the fastest price decreases in the industry in the autumn of 2021. All sizes of panels have been at lower prices Y/Y since November. Price declines moderated in Q1’22, and the average price decline in March was 1.8%, the slowest decline since July 2021. Even this more moderate pace is not sustainable indefinitely, though, since it represents an annualized rate of nearly 20%.
LCD TV Panel Prices January 2020 - June 2022
Looking toward Q2, we expect prices to continue to fall, but at an even more moderate pace compared to Q1. We expect price declines for all TV sizes in a narrow range of 4-7%, with an average decline among the six sizes we track of 5.3%. This average matches the pace of declines in March and also represents an annualized rate of nearly 20%.
In March 2022, prices for all TV panel sizes except 32” fell, but the pattern by screen size shifted slightly. In the four months from November to February, the biggest declines were in the sizes optimized on Gen 8.5 (49”/50” and 55”). In March, the biggest declines were in sizes optimized on Gen 10.5 (65” and 75”).
The fourth quarter of 2021 saw the biggest Q/Q price declines in the history of the flat panel display industry. Across the six sizes we track, the Q4 price declines averaged 32%. The first quarter of 2022 saw slower declines overall but the most severe declines continued to be on 49”/50” and 55” panels. The average decline across the six sizes we track is 13%, but 55” prices declined 19% in Q1 and 49”/50” prices declined 23%.
As we look at pricing on an area basis, we are now seeing that all sizes 55” and below seem to be converging to a narrow range, but the Gen 8.5 sizes are at the bottom of the stack. In April 2022, 55” are the lowest priced panels on an area basis at $126 per square meter, and 49”/50” panels are slightly higher at $127, but all the sizes below 65” are in a narrow range between $127 and $135.
Monthly Area Prices per Square Meter for TV Panels, January 2018 - June 2022
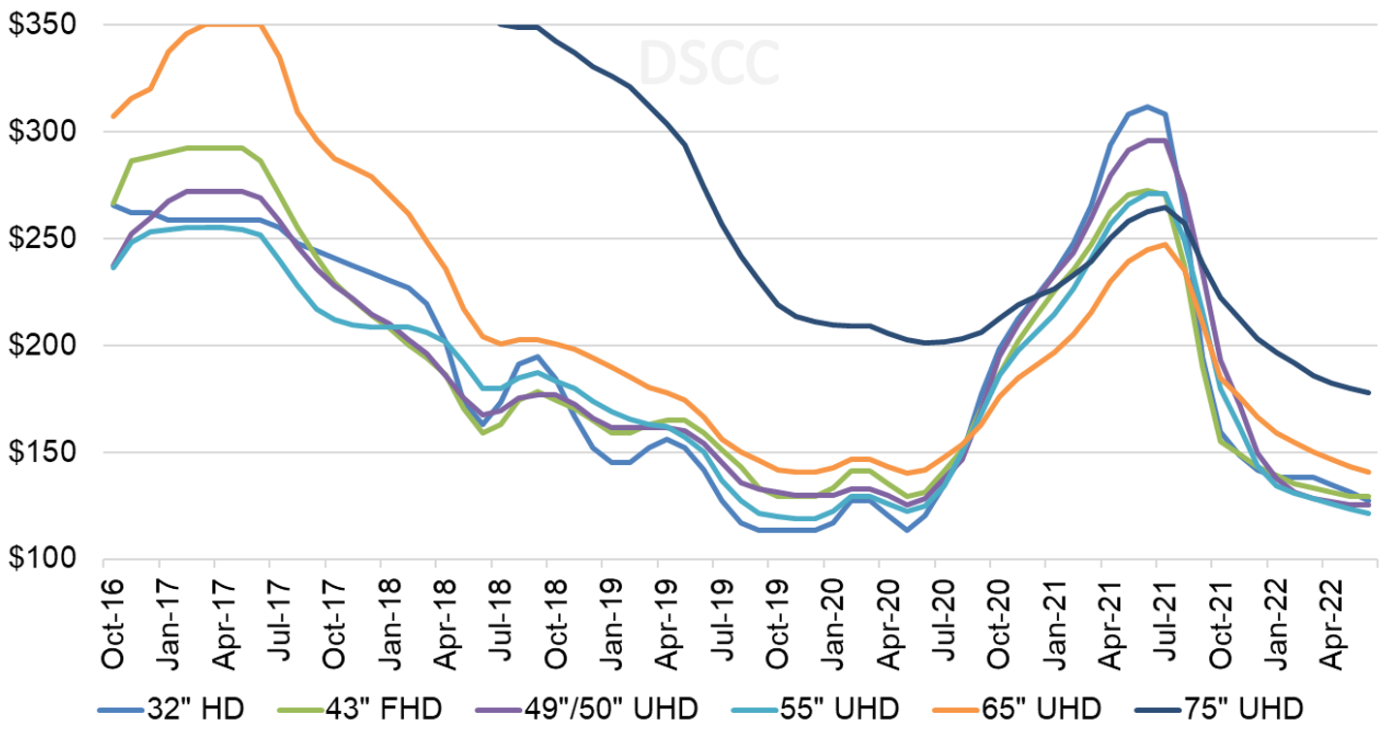
While prices have converged for all the smaller size panels, 65” and 75” panels continue to have a premium on an area basis. For April 2022, 65” panels sell at a premium of $21 or 17% over 55”, and 75” panels have a premium of $57 or 45%. Panel makers with Gen 10.5 capacity (BOE, CSOT and Sharp SIO) are at a relative advantage in the current oversupply environment.
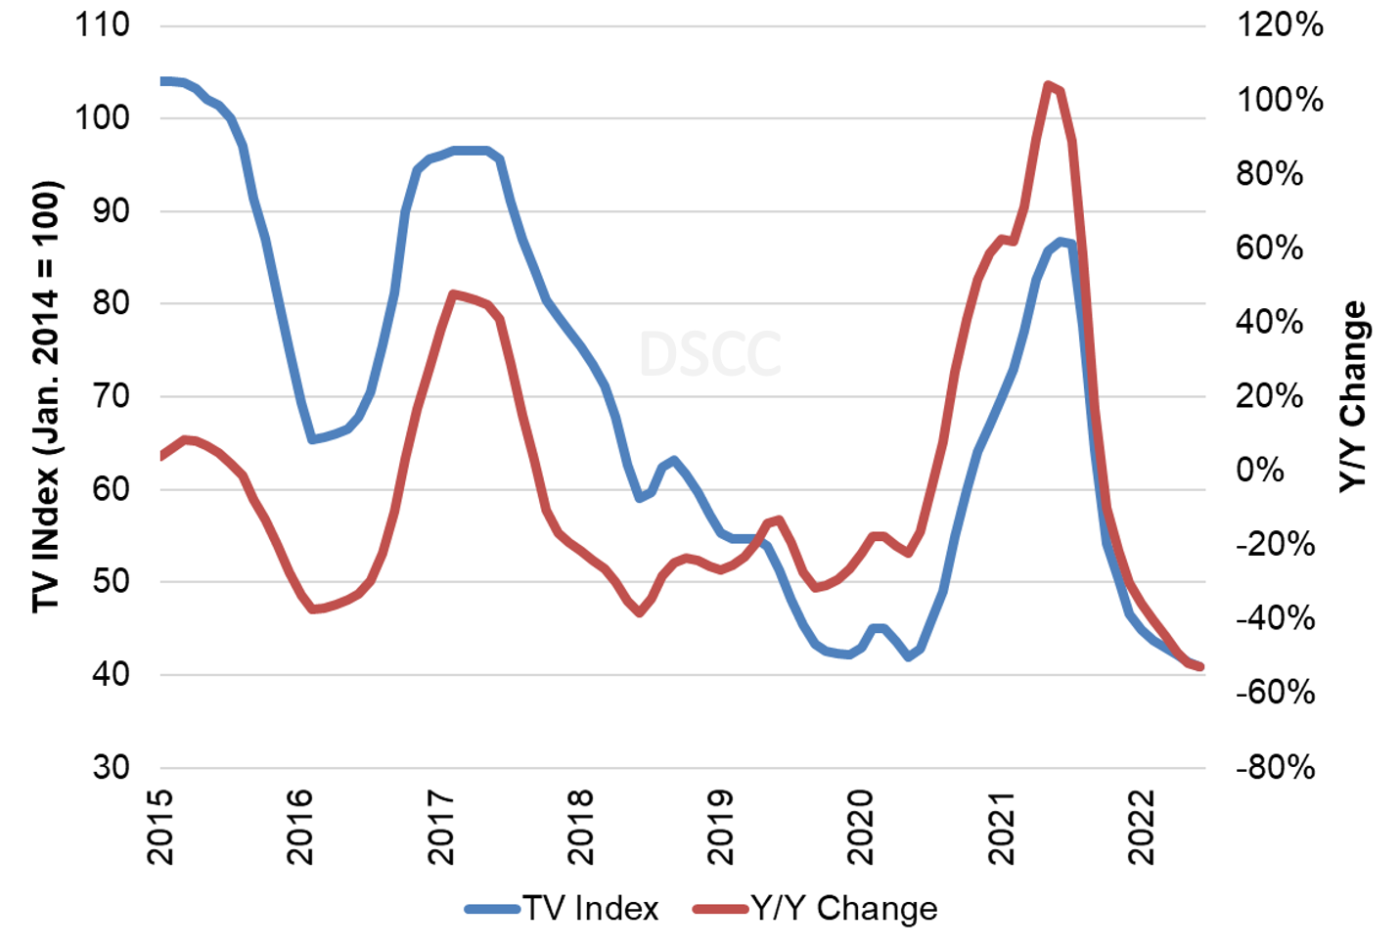
The last chart here takes a longer view and shows our TV price index, set to 100 for prices in January 2014, and the Y/Y change of LCD TV panel prices. Our index increased from its all-time low of 42 in May 2020 to 87 in June 2021, but prices already declined to 43 in March. We now expect the index to decline to 41 by June, 50% lower than March 2021 and representing an all-time low for LCD TV panel prices. Although we don’t expect every screen size to hit all-time lows in the first half of 2022, 75” panels already hit an all-time low in February and we expect 65” to match its all-time low by June.
TV Panel Price Index and Y/Y Change, January 2015 - June 2022
With the COVID-19 demand surge assisted by shortages in glass and DDICs, we saw a historic year of increases in panel prices, and panel makers post their most profitable quarter ever in the second quarter of 2021. Profits declined in Q3 but not by much, but in Q4, profits for the three Taiwan panel makers plunged as the panel price declines hit home. Earnings results for Q1 are likely to be worse than Q4, given the 13% average price decline for LCD TV panels, but the drop from Q4 to Q1 will likely be less severe than the drop from Q3 to Q4.
Although the price declines have been more moderate in 2022, there is no realistic prospect of prices stabilizing. TV demand continues to be weak, and TV makers have become more cautious in their outlook based on the expected negative impact of Russia’s war in Ukraine. Despite the signals of weak demand, panel maker utilization remained high in Q1’22 and appears to be continuing at a high level. The industry appears to be building inventory at a rate that is unsustainable, and past experience suggests that price declines will continue until prices fall below cash costs.
