FPD生産ライン稼働率、Q1'25は上昇傾向
出典調査レポート Quarterly All Display Fab Utilization Report の詳細仕様・販売価格・一部実データ付き商品サンプル・WEB無料ご試読は こちらから お問い合わせください。
これらCounterpoint Research FPD部門 (旧DSCC) 発の分析記事をいち早く無料配信するメールマガジンにぜひご登録ください。ご登録者様ならではの優先特典もご用意しています。【簡単ご登録は こちらから 】
記事のポイント
- Q4'24の生産ライン稼働率低下は予想よりも早く終わり、11月以降は稼働率が上昇している。
- TVおよびIT製品の需要増加に伴い、Q1'25はLCD生産ライン稼働率が上昇している。
- 季節的な落ち込みが例年よりも穏やかなことから、Q1'25のOLED生産ライン稼働率は前年同期より高くなる見通しである。
2024年夏に始まり10月の国慶節休暇まで続いた減速の後、FPD生産ライン稼働率は年末に向けて上昇に転じ、Q1'25に入ってさらに上昇していることが、Counterpoint Researchが先日発刊した Quarterly All Display Fab Utilization Report で明らかになった。FPDメーカー各社は需要拡大の兆しに対応していると見られる。
Q3’24には韓国と台湾で稼働率が前期比で上昇したものの中国では低下し、世界FPD生産ライン稼働率は前期比でやや低下した。Q4'24は日本を除く全地域で投入量が減少し、稼働率はさらに低下した。
Q4'24は全体としてQ3'24から減速したが、減少分のほぼすべてが10月に発生したもので、これは中国FPDメーカーが長期の国慶節休暇を取ったためである。稼働率は11月と12月に上昇したが、これは中国で消費者向け政府プログラムにより需要が増加したこと、ITおよびTVブランドがトランプ政権発足を前に関税回避のため米国向け出荷用に在庫を積み増したことがその要因である。
Q1'25の稼働率はさらに上昇し、2024年11月と12月の投入ペースに近くなると予測される。TV需要は引き続き堅調で、スマートフォン市場で例年見られる季節的減速も今年は穏やかなようだ。
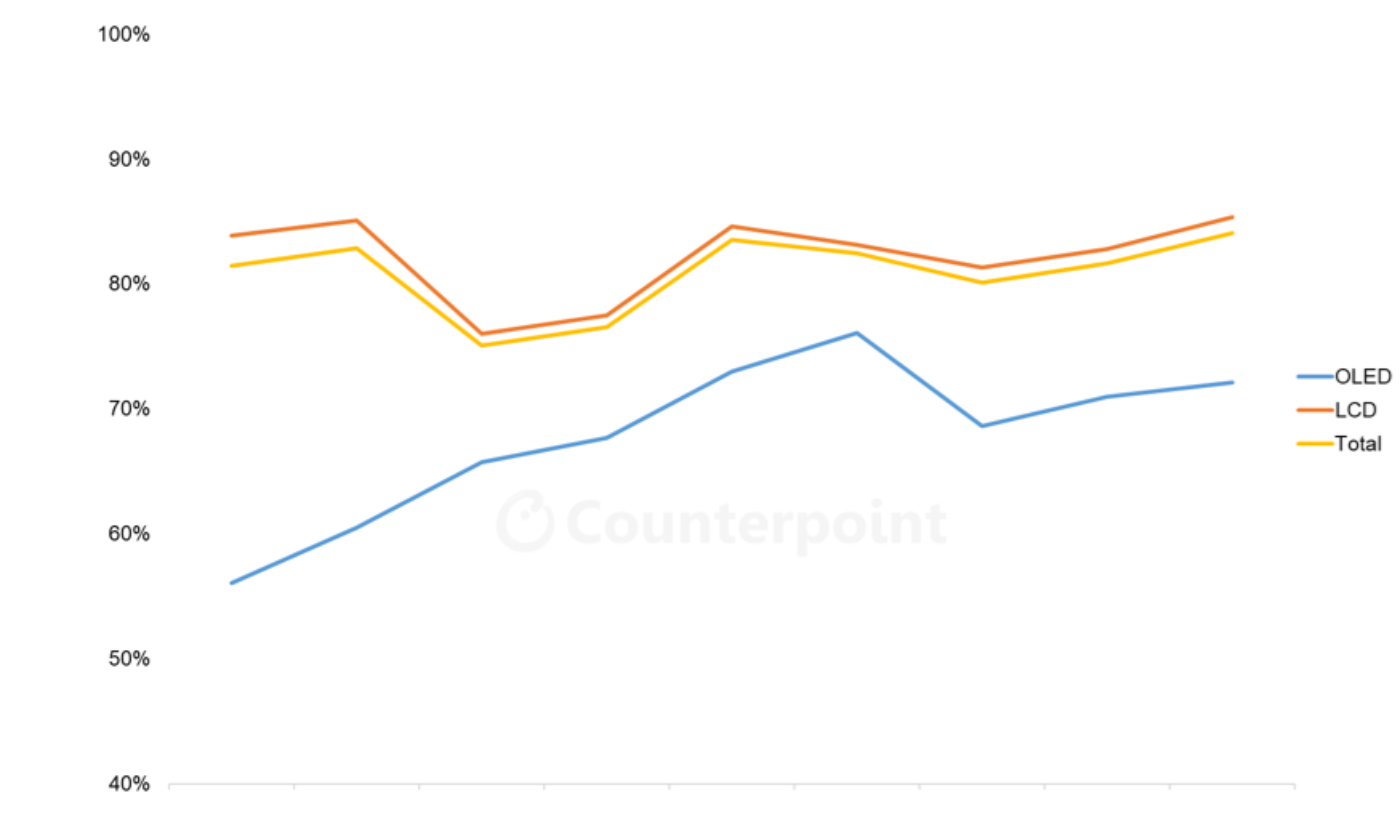
韓国はOLED生産能力シェアが著しく高く、他の地域はすべてLCDが大部分を占める。Q3’24の稼働率鈍化は、以下の図に示す通り、LCDに限られたものであり、OLEDライン稼働率はスマートフォン需要やOLED TVの需要改善により季節的なピークに達した。Q4'24のOLEDライン稼働率はLCDよりも大幅に低下したが、これはLGDのOLED TVラインが在庫管理で大きく減速したためである。OLED生産能力はFPD総生産能力の10%に過ぎないため、業界全体の稼働率はLCDラインに近い。
TFT生産ライン稼働率 四半期推移 (フロントプレーン別、2023-2025年)
モバイル用ディスプレイに目を向けると、ノートPC用リジッドOLED需要が引き続き増加していること、またスマートフォン用リジッドOLED需要がLTPS LCD需要を侵食し増加していることから、リジッドOLEDは2023年の低水準からQ2'24以降70%台に達するまで上昇している。リジッドOLEDとLTPS LCDはともにスマートフォン市場の下位から中位層に対応しており、プレミアムセグメントよりも季節要因の影響が少ない。ハイエンドのスマートフォンにはフレキシブルOLEDが使用されており、フレキシブルOLEDはAppleの製品導入サイクルとホリデー商戦がおもな要因として機能し、稼働率は毎年上半期に低下し下半期に上昇するという一貫した季節性パターンに落ち着いている。2024年の季節性パターンは例年より落ち着いたもので、Q3'24のピークは低め、Q1'25の減速は緩やかになっている。
2024年はFPD業界にとって回復の年であり、供給減少 (Sharp堺工場第10世代ラインの閉鎖) と需要増加 (IT需要改善とTV画面大型化) によって需給バランスが整い始めた。業界の総生産能力はFPD需要をはるかに上回る水準にある状況が続いているが、そのギャップは2022-2023年に比べてかなり小さくなっている。需要のけん引役が不透明なため、業界は需給バランスが供給過剰に転じないよう稼働率の抑制を継続する必要があるが、その抑制は2023年と2024年の「急ブレーキ」に比べ、2025年は「軽くブレーキを踏む」程度になるかもしれない。
------------------------------------
Counterpoint Researchの Quarterly All Display Fab Utilization Report は業界のすべてのFPD生産ラインを対象に生産能力、TFT投入量、稼働率を月次で追跡しており、提供データはピボットテーブルによってFPDメーカー、国、TFTライン世代、バックプレーン、フロントプレーン、基板タイプなどの項目別に分類できるようになっています。稼働率については、Q1’19以降の実績と2024年および2025年上半期の月次予測を掲載しています。
出典調査レポート Quarterly All Display Fab Utilization Report の詳細仕様・販売価格・一部実データ付き商品サンプル・WEB無料ご試読は こちらから お問い合わせください。
[原文] Flat Panel Display Fab Utilization Increasing in Q1 2025
- The Q4 2024 slowdown in fab utilization ended earlier than expected and utilization has increased since November.
- LCD fab utilization is increasing in Q1 2025 with increased demand for TV and IT products.
- OLED utilization will be higher YoY in Q1 2025 as the seasonal slowdown is milder than prior years.
After a slowdown that started in the summer of 2024 and extended to the National Day holiday in October, flat panel display fab utilization started to increase in the last months of the year and is increasing further in Q1 2025, according to the latest release of Counterpoint Research’s Quarterly All Display Fab Utilization Report, issued last week. Panel makers appear to be responding to stronger demand signals.
Worldwide fab utilization dropped slightly QoQ in Q3 2024 despite sequential increases in utilization in South Korea and Taiwan, as utilization in China fell. Utilization dropped further in Q4 2024 as input fell in all regions except Japan.
Although the fourth quarter as a whole was a slowdown from Q3, almost all of the reduction came in October, as Chinese panel makers took an extended National Day holiday. Utilization increased in November and December as demand increased in China driven by government programs for consumers and as IT and TV brands built inventory to ship to the US to avoid tariffs before the Trump Administration took office.
We expect utilization to increase further in Q1 2025, closer to the pace of inputs in November and December 2024. The demand for TVs remains solid and the normal seasonal slowdown in the smartphone market appears to be milder this year.
South Korea has a dramatically higher share of its capacity as OLED, while all other regions are dominated by LCD. The slowdown in utilization in Q3 2024 was confined to LCD as shown on the chart here, as OLED line utilization reached a seasonal peak with demand for smartphones and improvement in OLED TV demand. OLED fab utilization fell more dramatically than LCD in Q4 2024, with a big slowdown on LGD’s OLED TV lines to control inventory. The industry’s total utilization closely follows the LCD line as OLED capacity represents only 10% of total FPD capacity.
Turning to mobile displays, rigid OLED has increased from low levels in 2023 to reach the 70% range since Q2 2024 as demand for rigid OLED panels for notebook PCs continues to increase and demand for rigid OLED smartphone panels has increased at the expense of LTPS LCD. Both rigid OLED and LTPS LCD serve the lower and mid tiers of the smartphone market which exhibit less seasonality than the premium segment. Higher-end smartphones use flexible OLED panels, and flexible OLED has settled into a consistent seasonal pattern of lower UT% in the first half and higher UT% in the second half of each year, driven primarily by Apple’s product introduction cycle and holiday sales. The seasonal pattern was more muted in 2024, with a lower seasonal peak in Q3 2024 and a softer seasonal slowdown in Q1 2025.
2024 was a recovery year for the display industry, as the supply/demand balance started to right itself through decreased supply (the closure of Sharp’s Sakai G10 fab) and increased demand (improvement in IT demand and larger TV screen sizes). Total industry capacity continues to exceed demand for displays, but that gap is much smaller than in 2022-2023. With demand drivers uncertain, the industry will need to continue to restrain utilization to avoid shifting the supply/demand balance into oversupply, but that restraint may look like a “tap on the brakes” in 2025 as compared to “slam on the brakes” in 2023 and 2024.
Counterpoint Research’s Quarterly All Display Fab Utilization Report covers capacity, TFT Input and utilization by month for every flat panel display fab in the industry, with pivot tables to allow segmentation by supplier, country, TFT fab generation, backplane, frontplane or substrate type. The report provides historical utilization back to Q1 2019 and a forecast by month for the first half of 2025. Counterpoint Weekly readers interested in subscribing to the Quarterly All Display Fab Utilization Report should contact info@counterpointresearch.com.
