生産ライン稼働率低下がコストに与える影響~Advanced TV Cost Report 最新刊より
DSCC Advanced TV Cost Report Shows Cost Impact of Low Fab Utilization
DSCC has released its latest update of the Semi-Annual Advanced TV Display Cost Report (一部実データ付きサンプルをお送りします), with updates to OLED and LCD cost profiles. This quarter’s edition includes updates to all sizes of WOLED panels and 55”+ LCD sizes including LCD with MiniLED backlights, and cost profiles for 55” and 65” QD-OLED panels from SDC.
The cost report provides detailed cost profiles of 90 distinct LCD products, including combinations of screen size, refresh frequency (60Hz/120Hz), backlight (conventional /QDEF/MiniLED), gen size and manufacturing location (Korea / China) and including open cell models. The report covers 34 distinct OLED products, ranging in size from 27” to 97”, with resolutions from FHD to 8K, and manufactured on Gen 8.5 in China and Korea.
The sharp slowdown in the premium TV market, combined with the increased capacity of both LCD and OLED TV panels, combined in 2022 to a severe oversupply, which led to sharp reductions in fab utilization on both LCD and OLED lines, as shown in the first chart here. LCD lines in both Korea and China suffered a sharp slowdown in utilization in Q3’22 with a partial recovery starting in Q4’22 and continuing a slow but steady recovery in 2023. Samsung’s QD-OLED showed a similar pattern with a sharper recovery in Q4’22, but LGD’s WOLED lines have seen a longer and more severe slowdown and a delayed recovery, which only starts in Q2’23.
Utilization of TV Flat Panel Display Fabs
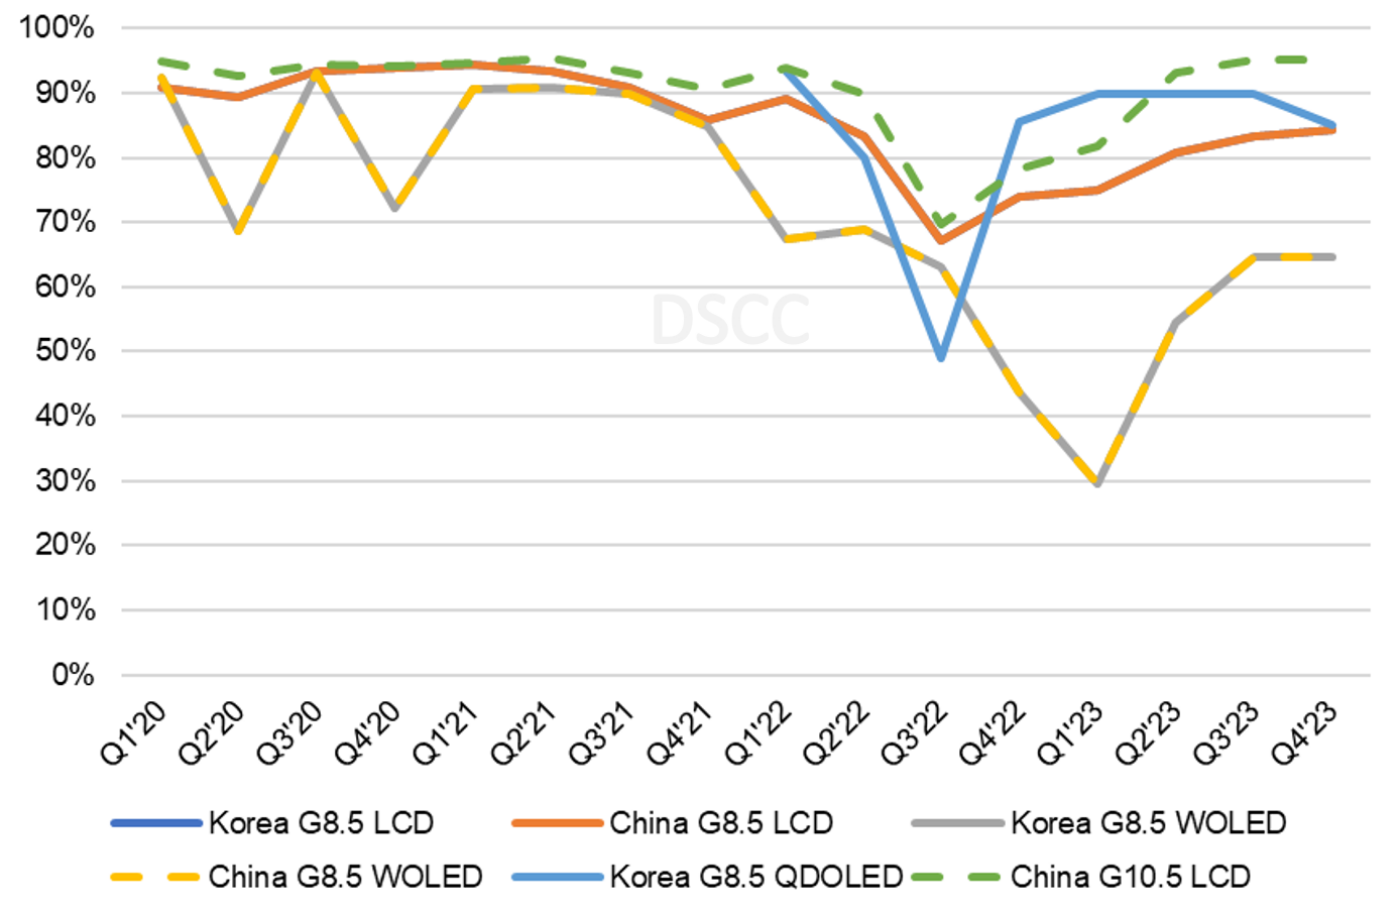
Fab utilization has a strong impact on total display costs because fixed costs are amortized over panels produced, and a higher utilization (along with higher yield) allows for fixed costs to be amortized over more units, reducing the cost per unit. In the case of Samsung’s QD-OLED fab, the biggest fixed cost is depreciation, making up nearly 50% of the total display cost even when utilization is high.
In Q4’22, LG Display took a $1B extraordinary loss to impair its WOLED lines in China, which has reduced but not eliminated depreciation costs for China WOLED production. While the lines have been impaired, there remain assets including the building, which continue to be depreciated. The total depreciation cost on these lines in 2023 is roughly 1/3 the amount in 2022.
However, depreciation is not the only fixed cost in flat panel display production. Personnel costs are effectively fixed since work crews cannot be eliminated and restarted in a short time span. Similarly, certain indirect costs such as utilities or equipment maintenance are likewise independent of fab utilization.
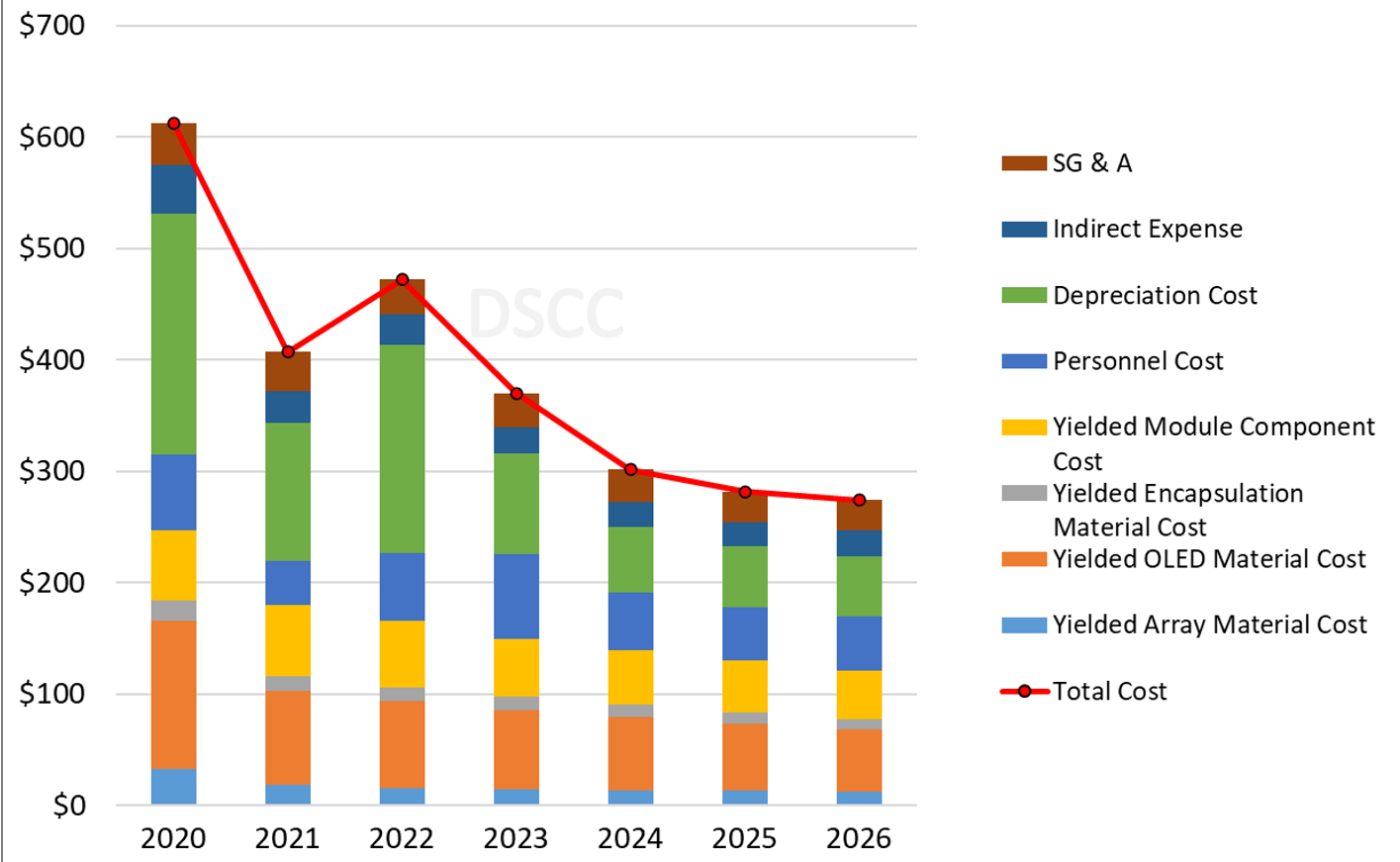
The impact of lower utilization can be seen in the next chart here, showing 55” UHD panel cost on Gen 8.5 in China. While total costs of China production decreased substantially from 2020 to 2021 as the China fab improved yield, total costs per unit increased in 2022 because of the big increase in depreciation costs. Although the asset impairment reduced depreciation costs in 2023, personnel costs per unit remain elevated because of the low utilization. Higher utilization in 2024-2026 allows for better amortization of fixed costs and improved the total cost picture.
WOLED TV Panel Cost for 55” UHD on Gen 8.5 in China
Similar to LGD’s WOLED, the costs for Samsung Display’s QD-OLED panels are sensitive to changes in fab utilization, but the larger impact in 2022-2023 comes from an improvement in yield. LGD’s WOLED products have had high yields in Korea for many years and in China since 2021, but Samsung Display struggled through the initial yield curve for QD-OLED in 2022.
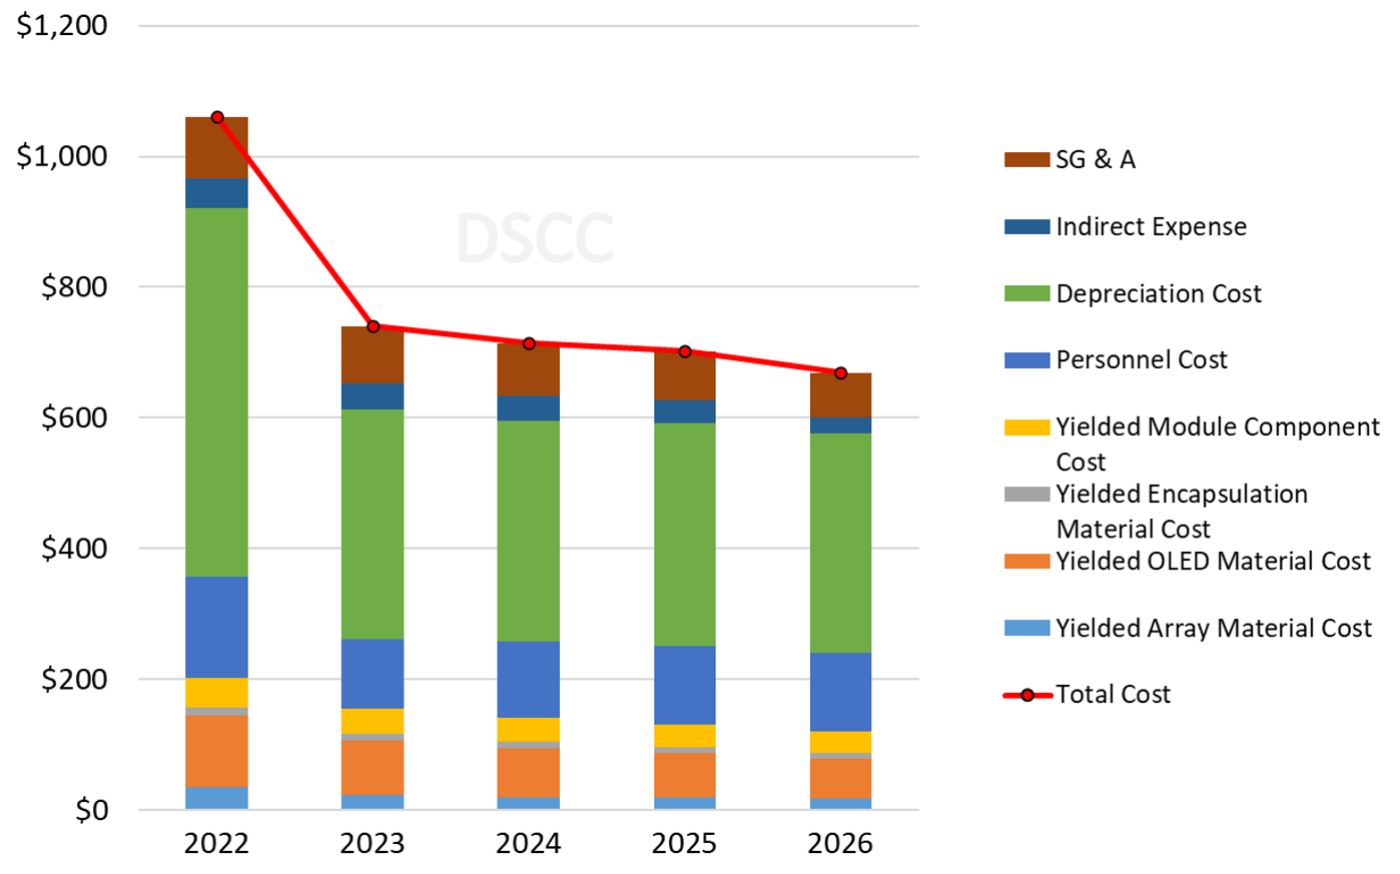
Although, by our estimates Samsung greatly improved QD-OLED yield throughout the year in 2022, the average yield for the year for 65” QD-OLED panels was only 68% in 2022. We expect that to improve to 84% in 2023 and 85% in 2024, and the big jump in yield in 2023 allows for a substantial improvement in total cost per unit, as shown on the next chart here. In addition to the yield improvement, the average fab utilization of SDC’s QD-OLED lines improves from 77% to 89%.
The combination of these two factors, plus modest reductions in some component costs, allows for a 30% reduction in the 65” QD-OLED panel total cost in 2023 compared with 2022. However, since in 2023 both yield and fab utilization are high, these factors have little room for futher improvement and the annual cost reductions in 2024-2026 are much more modest. The chart makes clear that QD-OLED, with its heavy investment for capacity, will remain a high cost technology on a total cost basis because of high depreciation.
QD-OLED TV Panel Cost for 65” UHD on Gen 8.5 in Korea
Subscribers to the report can see the detailed cost models for all sizes of both WOLED and QD-OLED panels, including quarterly cost estimates from 2022 through 2026 with breakdown by cost components and the corresponding estimates of yield and fab utilization.
The latest report updates the cost models for LCD panels with MiniLED backlights. The report allows for comparison across the wide range of performance (and cost) within LCD, from conventional LCD with 60Hz refresh to 120Hz to QDEF panels and finally MiniLED + QDEF. Combined with the OLED cost models, the report allows a complete comparison of the cost of all large-screen TV types.
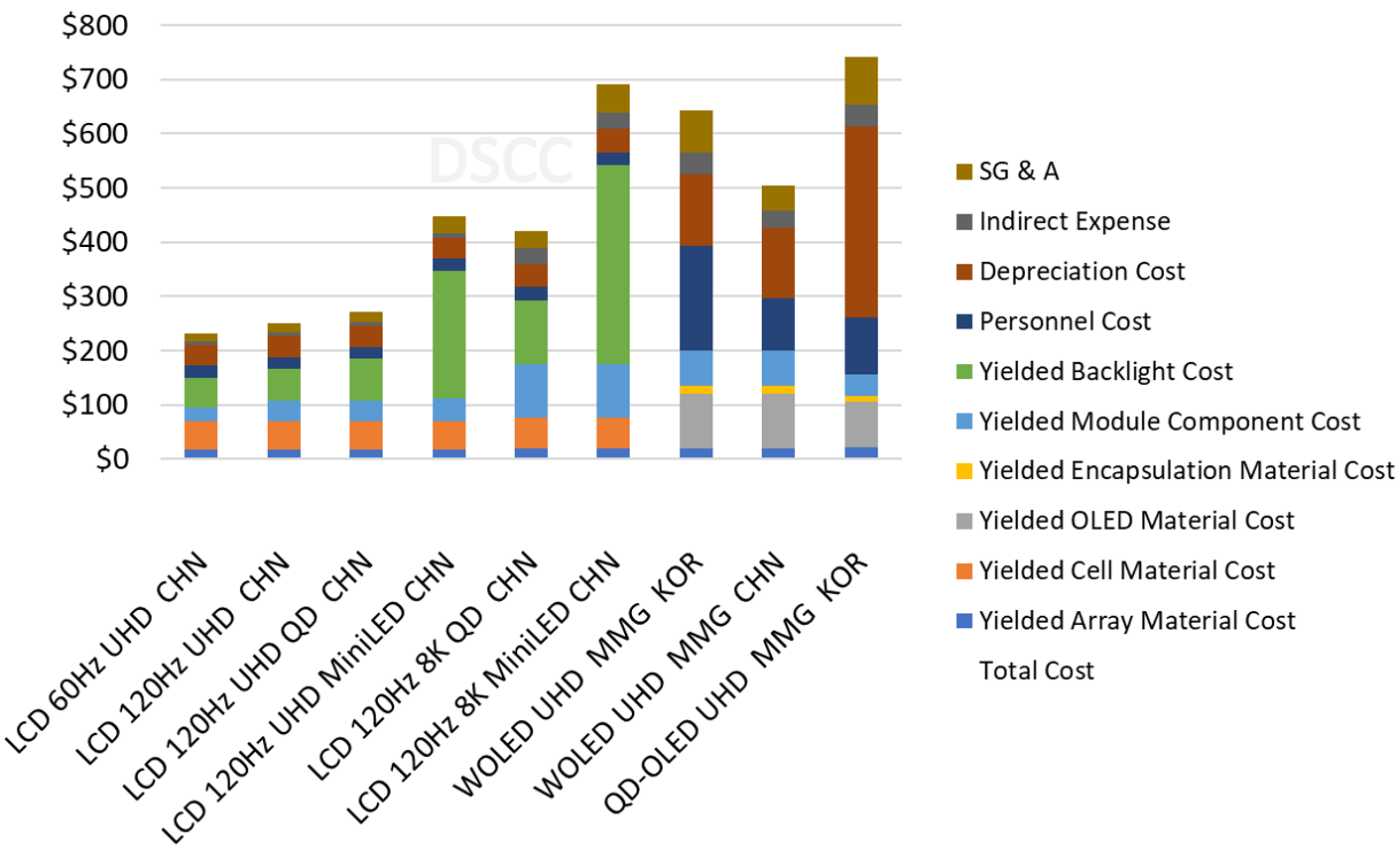
The next chart here shows the cost profiles for 65” panels across the range of technologies on the market in 2023. LCD products are made on Gen 10.5 lines in China while WOLED products are made with MMG on Gen 8.5 lines in China and Korea and QD-OLED products are made with MMG on Gen 8.5 lines in Korea. Conventional LCD with UHD resolution and 60Hz refresh rates have the lowest cost, more than 50% lower than WOLED UHD made in China. LCD step-up products with 120Hz and QDEF add only a modest cost, roughly 5% and 10%, respectively. MiniLED UHD and 8K QD LCD are both substantial cost adders, increasing total costs by roughly 50% each individually, and when combined the 65” 8K MiniLED LCD TV panels have a total cost higher than 65” WOLED UHD panels made in China with MMG. QD-OLED panels have the highest cost of any display technology on the market.
65” Panel Total Cost in 2023 for LCD and OLED Panels
As noted above, subscribers to the Semi-Annual Advanced TV Display Cost Report (一部実データ付きサンプルをお送りします) receive cost profiles of all major product configurations competing in the premium TV space in both LCD and OLED. The report includes Excel files with the detailed cost models in tables and in graphical form, and a PDF, which outlines the main findings of this quarter’s update. The PDF includes comparisons of competing technologies (such as WOLED vs. Inkjet Printing, or LCD vs. QDEF) and differing manufacturing platforms (Korea vs. China, Gen 8.5 vs. Gen 10.5).
本記事の出典調査レポート
Semi-Annual Advanced TV Display Cost Report
一部実データ付きサンプルをご返送
ご案内手順
1) まずは「お問い合わせフォーム」経由のご連絡にて、ご紹介資料、国内販売価格、一部実データ付きサンプルをご返信します。2) その後、DSCCアジア代表・田村喜男アナリストによる「本レポートの強み~DSCC独自の分析手法とは」のご説明 (お電話またはWEB面談) の上、お客様のミッションやお悩みをお聞かせください。本レポートを主候補に、課題解決に向けた最適サービスをご提案させていただきます。 3) ご購入後も、掲載内容に関するご質問を国内お客様サポート窓口が承り、質疑応答ミーティングを通じた国内外アナリスト/コンサルタントとの積極的な交流をお手伝いします。
