FPD生産ライン稼働率
冒頭部和訳
DSCCが先週リリースした Quarterly All Display Fab Utilization Report (一部実データ付きサンプルをお送りします) 最新版によると、Q2’22に始まったFPD生産ライン稼働率の低下は底を打ったものの、2023年上半期の回復はDSCCの当初予測より遅いという。2022年の減速は2008年以来最も深刻で、おそらく史上最悪のものだった。これはパンデミック後の需要減速とFPDサプライチェーンの過剰在庫が組み合わさった結果である。2022年下半期には稼働率の低下によって在庫は減少したものの、依然として高水準にとどまっており、これが業界の回復を妨げている。
FPDメーカー全社の合計TFT基板投入量はQ3’22に前期比20%減を記録、その後のQ4’22には前期比3%増、前年比21%減の6780万㎡となった。現四半期であるQ1’23は前期比2%減、前年比25%減の6640万㎡になる見通しだ。Q1は日数が2%少なく、旧正月休暇もあって多くの工場が稼働を縮小または停止して年次保守を実施するため、前期比2%減という数値は、Q2に稼働率が回復する前の小休止期間にしては、さほど大きな下落ではないように思われる。
本レポートには、すべてのFPD生産ライン (全部で100以上) の月間生産能力、TFT基板投入量、生産ライン稼働率の詳細データを収録しており、併せて提供されるエクセル式データベースには、FPDメーカー、国、TFT世代、バックプレーン、フロントプレーン、基板タイプの項目別に表示可能なピボットテーブルが含まれている。レポートには、Q1’19以降の実績と2023年上半期までの月別予測の稼働率データを収録している。
Display Fab Utilization Increasing in Q1’23 But Recovery Slower Than Expected
※ご参考※ 無料翻訳ツール (DeepL)
The slowdown in display fab utilization that started in Q2’22 has bottomed out but the recovery in the first part of 2023 is slower than we expected, according to the latest release of DSCC’s Quarterly All Display Fab Utilization Report (一部実データ付きサンプルをお送りします) issued last week. The 2022 downturn was the most severe since 2008, and arguably the most severe ever, resulting from the post-pandemic slowdown in demand combined with excessive inventory in the display supply chain. That inventory has been diminished by slower utilization in the second half of 2022, but it remains at elevated levels, hindering the industry’s recovery.
After a 20% sequential decline in Q3’22, total TFT input for all display makers in Q4’22 was up 3% Q/Q but down 21% Y/Y at 67.8M square meters. In the current Q1’23 we expect total TFT input to be down 2% Q/Q and down 25% Y/Y at 66.4M square meters. There are 2% fewer days in Q1, and the quarter includes the Lunar New Year holiday when many plants slow down or shut down for annual maintenance, so a 2% sequential decrease seems not so much as a downturn as a pause before UT% can recover in the second quarter.
The report details monthly capacity, TFT input, and utilization for every flat panel display fab in the industry, more than 100 fabs in all, and includes pivot tables to allow segmentation by the supplier, country, TFT fab generation, backplane, frontplane or substrate type. The report provides historical utilization back to Q1’18 and a forecast by month for the first half of 2023.
Fed by the pandemic demand surge, fab utilization was particularly strong in Taiwan and China in 2021, as shown in the first chart here. After an aborted slowdown in Q4’21, worldwide utilization in Q1’22 increased to 87% while macroeconomic and geopolitical shocks caused demand to plunge. Utilization fell 6% in Q2’22 and another 15% in Q3’22 to 65%, the lowest point since the financial crisis of 2008-2009. Utilization recovered slightly to 67% in Q4’22 and we expect utilization to stabilize at 67% in the first quarter before staging a modest recovery in Q2’23.
TFT Quarterly Fab Utilization by Region
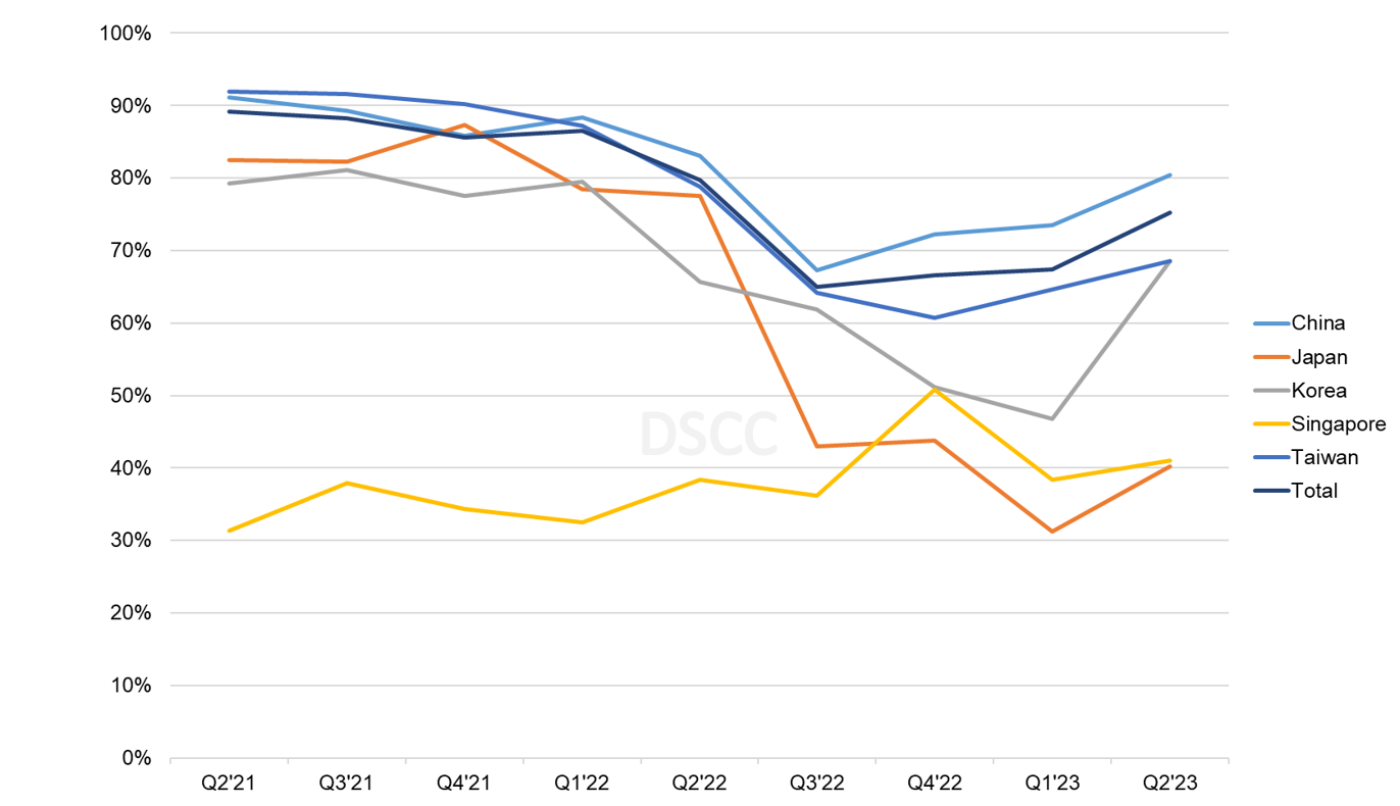
As shown in the chart, the slowdown was broad-based across all regions of production. The slowdown affected OLED production as well as LCD. Korea has a dramatically higher share of its capacity as OLED, while all other regions are dominated by LCD. With the shutdown of SDC’s T8 fab and LGD’s P5 and P7 fabs in 2022, now in Q1 2023, 56% of Korea capacity produces OLED panels, while the percentage of OLED in China is only 6% and it is negligible in all other regions.
The downturn for LCD fabs has a common cause – the sharp reduction in LCD panel prices and the inventory build-up. Although LCD capacity is not completely interchangeable, it is largely fungible, so a shortage in one gen size of capacity can be made up with another gen size, and similarly an oversupply in one area spills over onto other areas. OLED capacity is different in that there are four distinct classes of OLED capacity with little overlap between them:
- White OLED capacity for LGD, on Gen 8.5 lines with oxide TFT backplanes for OLED TV and monitor panels;
- QD-OLED capacity for SDC, also on Gen 8.5 lines with oxide TFT backplanes for OLED TV and monitor panels;
- Rigid OLED capacity, mostly for SDC but a few others, on Gen 5.5 and smaller lines with LTPS backplanes for smartphone, tablet and notebook panels;
- Flexible OLED capacity for many suppliers, primarily on Gen 6 lines with LPTS or LTPO backplanes for smartphone panels.
While the causes for the downturn vary for each class of capacity, they all share one factor – the slowdown of demand in electronic devices. None of these groups had a utilization over 70% in the second half of 2022.
Looking more closely at LCD, a view of utilization by manufacturer by month shows the dramatic slowdown in 2H 2022 for each of the top seven LCD makers, which have a combined 90% of the industry’s LCD capacity. The chart also shows that while all companies are recovering from the downturn, some are recovering faster than others.
The downturn appears particularly painful AUO and Sharp, each of which reduced utilization below 50% in Q3’22 and both companies have been slow to recover. AUO reported during Q3 that its average selling price (ASP) per square meter declined only 3% compared to Q2, which was much better than the 16% decline attributable to LCD TV panel prices, so it appears that AUO made the decision to hold the line on prices and turn away business rather than competing for sales below cost.
TFT LCD Monthly Fab Utilization by Manufacturer
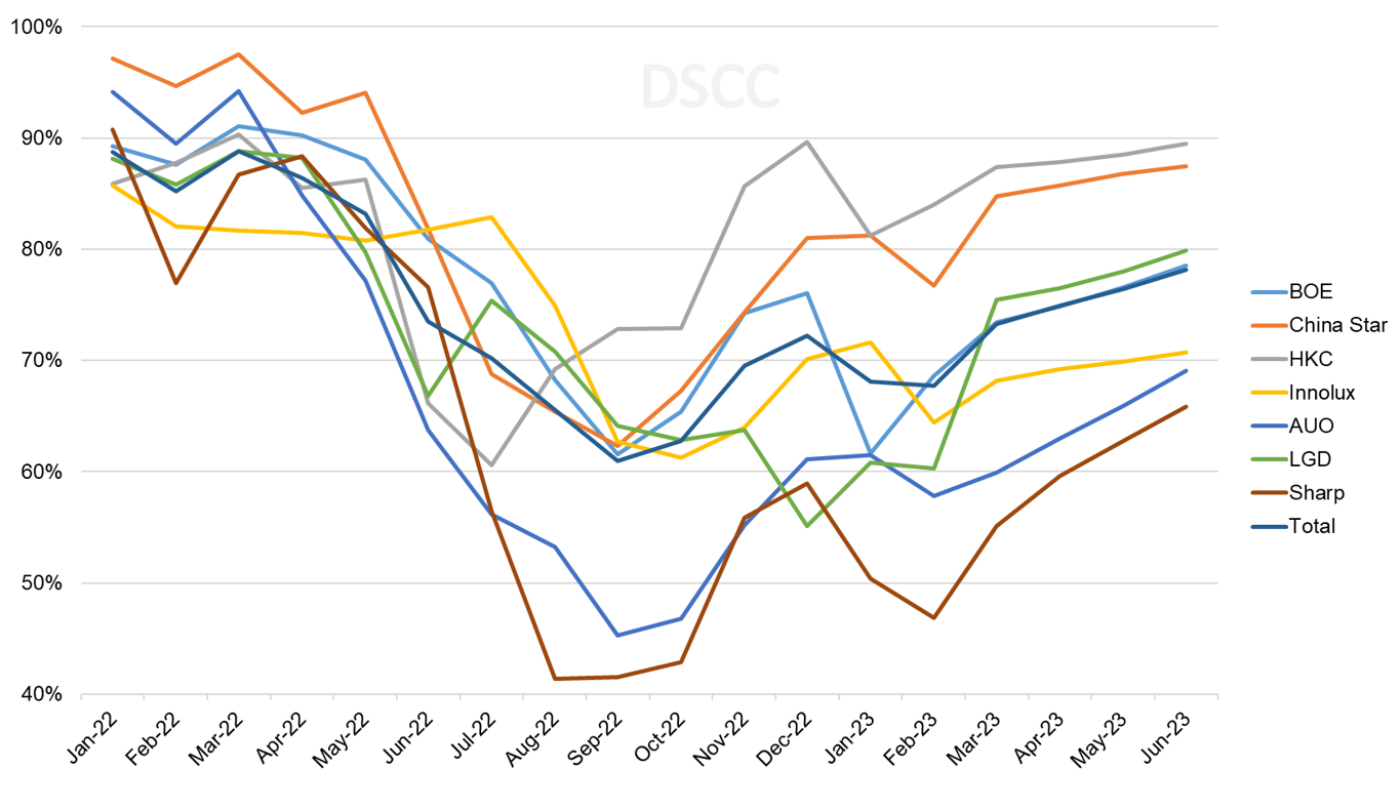
In contrast to AUO and Sharp, HKC recovered quickly from a brief slowdown and had average utilization in Q4 of 83%, far higher than the industry average of 68%. HKC had scheduled an initial public offering (IPO) for October 2022, but had the IPO suspended by the Shenzhen Stock Exchange. HKC did not provide the exchange with the required financial information, so we have no idea about the company’s inventory level, but they appear to be running close to full tilt to gain share from competitors in Taiwan, Japan and Korea.
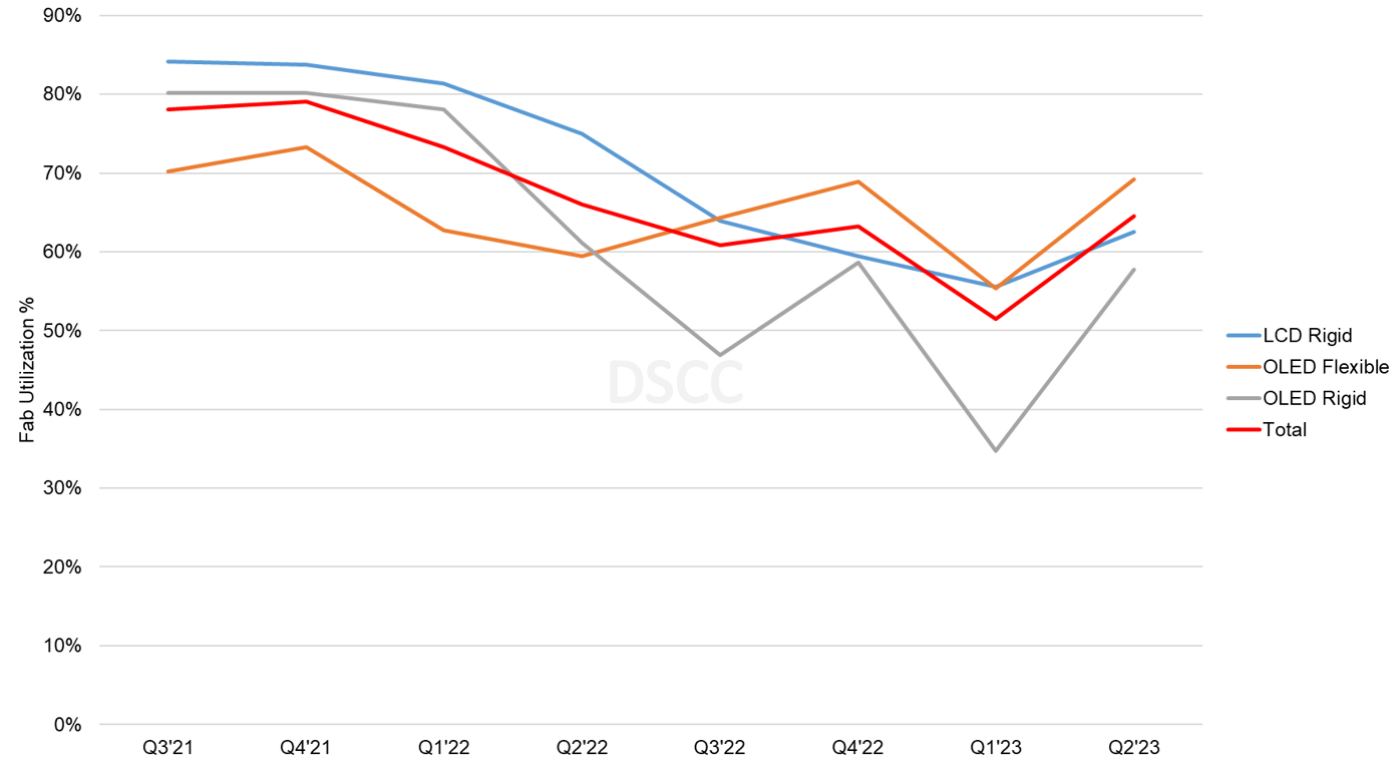
The Quarterly All Display Fab Utilization Report (一部実データ付きサンプルをお送りします), as its name implies, covers every display technology and application, but a separate DSCC report, the Quarterly OLED and Mobile/IT Fab Utilization Report (一部実データ付きサンプルをお送りします), also updated this week, provides a more narrow focus on OLED and LTPS LCD. The next chart here shows a view of utilization for LTPS LCD and OLED with Rigid and Flexible substrates. As compared to the larger-screen categories, where the downturn bottomed out in Q3/Q4’22, the slowdown in the Mobile IT sector has continued and appears to be hitting bottom in Q1’23. Rigid OLED has undergone a severe slowdown in because of weak demand for rigid OLED panels for smartphones. Flexible OLED continues to struggle with overcapacity, especially in China, and the LTPS LCD sector has struggled with the general slowdown in the smartphone market.
Quarterly TFT Utilization by Display Technology and Substrate
The industry’s capacity increases, which were a response to the unprecedented surge in demand during the pandemic, led to an oversupply which brought panel prices down precipitously to below cash costs. The excess inventory in the display supply chain, coupled with weak demand, has continued to put downward pricing pressure on display panels. With few prospects for increased demand in the near term, recovery is expected to be slow.
DSCC’s Quarterly All Display Fab Utilization Report (一部実データ付きサンプルをお送りします) covers capacity, TFT Input and utilization by month for every flat panel display fab in the industry, with pivot tables to allow segmentation by supplier, country, TFT fab generation, backplane, frontplane or substrate type. The report provides historical utilization back to Q1’19 and a forecast by month for the first half of 2023. DSCC Weekly readers interested in subscribing to the Quarterly All Display Fab Utilization Report should contact info@displaysupplychain.com.
本記事の出典調査レポート
Quarterly All Display Fab Utilization Report
一部実データ付きサンプルをご返送
ご案内手順
1) まずは「お問い合わせフォーム」経由のご連絡にて、ご紹介資料、国内販売価格、一部実データ付きサンプルをご返信します。2) その後、DSCCアジア代表・田村喜男アナリストによる「本レポートの強み~DSCC独自の分析手法とは」のご説明 (お電話またはWEB面談) の上、お客様のミッションやお悩みをお聞かせください。本レポートを主候補に、課題解決に向けた最適サービスをご提案させていただきます。 3) ご購入後も、掲載内容に関するご質問を国内お客様サポート窓口が承り、質疑応答ミーティングを通じた国内外アナリスト/コンサルタントとの積極的な交流をお手伝いします。
