FPD生産ライン稼働率~Q3の予想以上の低迷はQ4も継続
冒頭部和訳
DSCCが先週発刊した Quarterly All Display Fab Utilization Report (一部実データ付きサンプルをお送りします) 最新版によると、今年初めに予測されたFPD生産ライン稼働率の低迷は第3四半期にさらなる底に到達、その落ち込みは予測以上に深刻だったことが明らかになった。 FPD価格は丸1年間下落し過去最低に到達、FPDサプライチェーン全体で過剰在庫が積み上げられた結果、FPDメーカーは第2四半期に稼働率を下げ始め、第3四半期には稼働率低下に拍車がかかった。FPDメーカー全社の合計TFT投入量はQ2’22に前期比6%減となり、その後Q3’22には前期比20%減・前年比24%減の6610万㎡となったが、現四半期であるQ4’22では前期比横ばい・前年比23%減の6610万㎡となる見通しだ。
本レポートには、業界のすべてのFPD生産ライン (全部で100以上) の月間生産能力、TFT基板投入量、生産ライン稼働率の詳細データを収録しており、併せて提供されるExcelデータベースには、FPDメーカー、国、TFT世代、バックプレーン、フロントプレーン、基板タイプの項目別に表示可能なピボットテーブルが含まれている。レポートには、Q1’19以降の実績と2022年通年の月別予測の稼働率データを収録している。
Slowdown in Display Fab Utilization in Q3 Was Worse Than Expected and Continues in Q4
The slowdown in display fab utilization that we predicted earlier this year reached new depths in the third quarter and was even more severe than we expected, according to the latest release of DSCC’s Quarterly All Display Fab Utilization Report (一部実データ付きサンプルをお送りします) issued last week. After more than a full year of panel prices falling to reach all-time lows, and after the entire display supply chain built excessive inventory, panel makers started to reduce utilization in Q2 and the slowdown accelerated in Q3. After a 6% sequential decline in Q2’22, total TFT input for all display makers in the third quarter was down 20% Q/Q and 24% Y/Y at 66.1M square meters, and in the current Q4’22 we expect total TFT input to be flat Q/Q and down 23% Y/Y at 66.1M square meters.
The report details monthly capacity, TFT input, and utilization for every flat panel display fab in the industry, more than 100 fabs in all, and includes pivot tables to allow segmentation by the supplier, country, TFT fab generation, backplane, frontplane or substrate type. The report provides historical utilization back to Q1’19 and a forecast by month for the full year 2022.
Fed by the pandemic demand surge, fab utilization was particularly strong in Taiwan and China in 2021, as shown in the first chart here. After an aborted slowdown in Q4’21, worldwide utilization in Q1’22 increased to 87% at the same time that macroeconomic and geopolitical shocks caused demand to plunge. Utilization fell 7% in Q2’22 and another 15% in Q3’22 to 65%, the lowest point since the financial crisis of 2008-2009. We expect utilization to come in again at 65% in the fourth quarter before staging a modest recovery in Q1’23.
TFT Quarterly Fab Utilization by Region
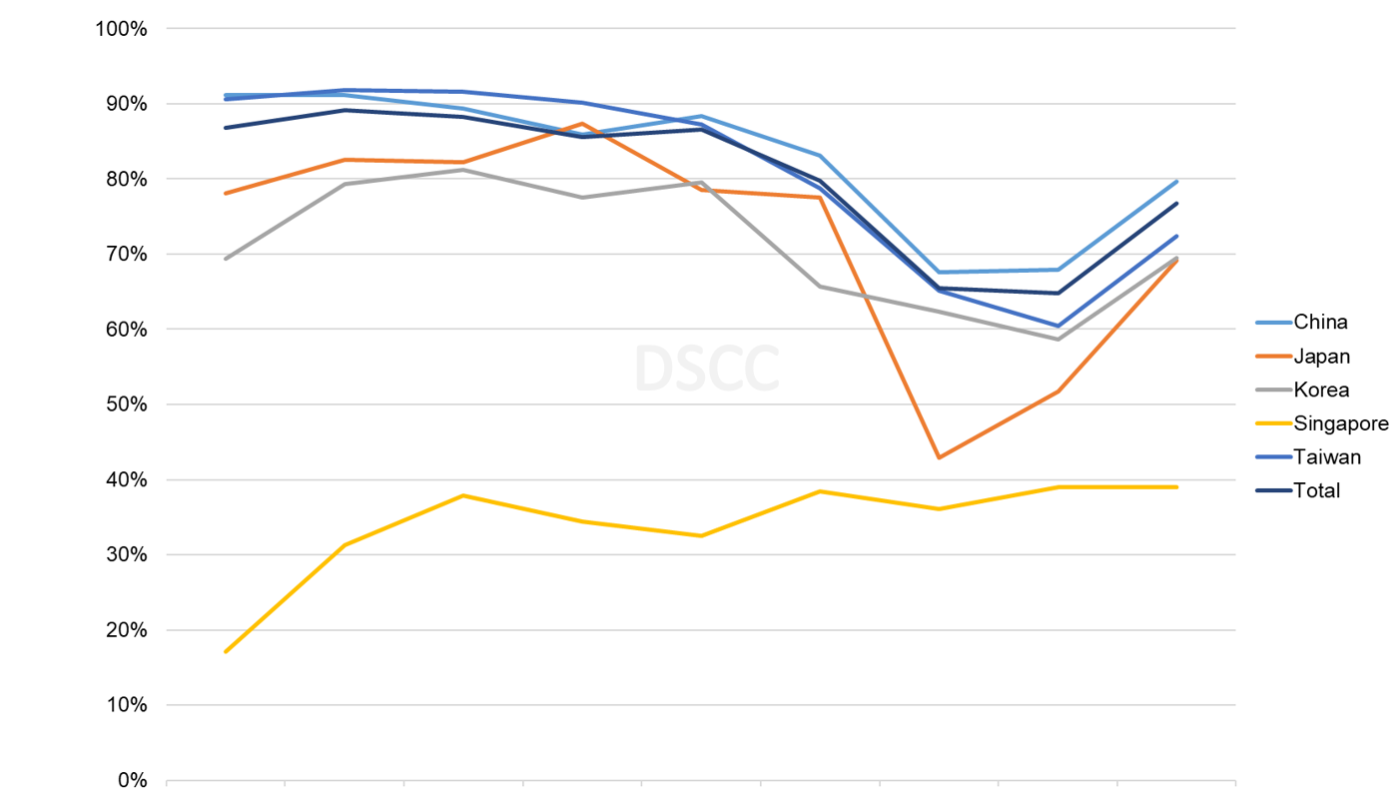
As shown in the chart, the slowdown is broad-based across all regions of production. The slowdown has affected OLED production as well as LCD. Korea has a dramatically higher share of its capacity as OLED, while all other regions are dominated by LCD. In Q3’22, 45% of Korea capacity produces OLED panels, while the percentage of OLED in China is only 5% and it is negligible in all other regions.
The downturn for LCD fabs has a common cause – the sharp reduction in LCD panel prices and the inventory build-up. Although LCD capacity is not completely interchangeable, it is largely fungible, so a shortage in one gen size of capacity can be made up with another gen size, and similarly an oversupply in one area spills over onto other areas. OLED capacity is different in that there are four distinct classes of OLED capacity with little overlap between them:
- White OLED capacity for LGD, on Gen 8.5 lines with oxide TFT backplanes for OLED TV and monitor panels;
- QD-OLED capacity for SDC, also on Gen 8.5 lines with oxide TFT backplanes for OLED TV and monitor panels;
- Rigid OLED capacity, mostly for SDC but a few others, on Gen 5.5 and smaller lines with LTPS backplanes for smartphone, tablet and notebook panels;
- Flexible OLED capacity for many suppliers, primarily on Gen 6 lines with LPTS or LTPO backplanes for smartphone panels.
While the causes for the downturn vary for each class of capacity, they all share in common one factor – the slowdown of demand in electronic devices. None of these groups has a capacity over 70% in the second half of 2022.
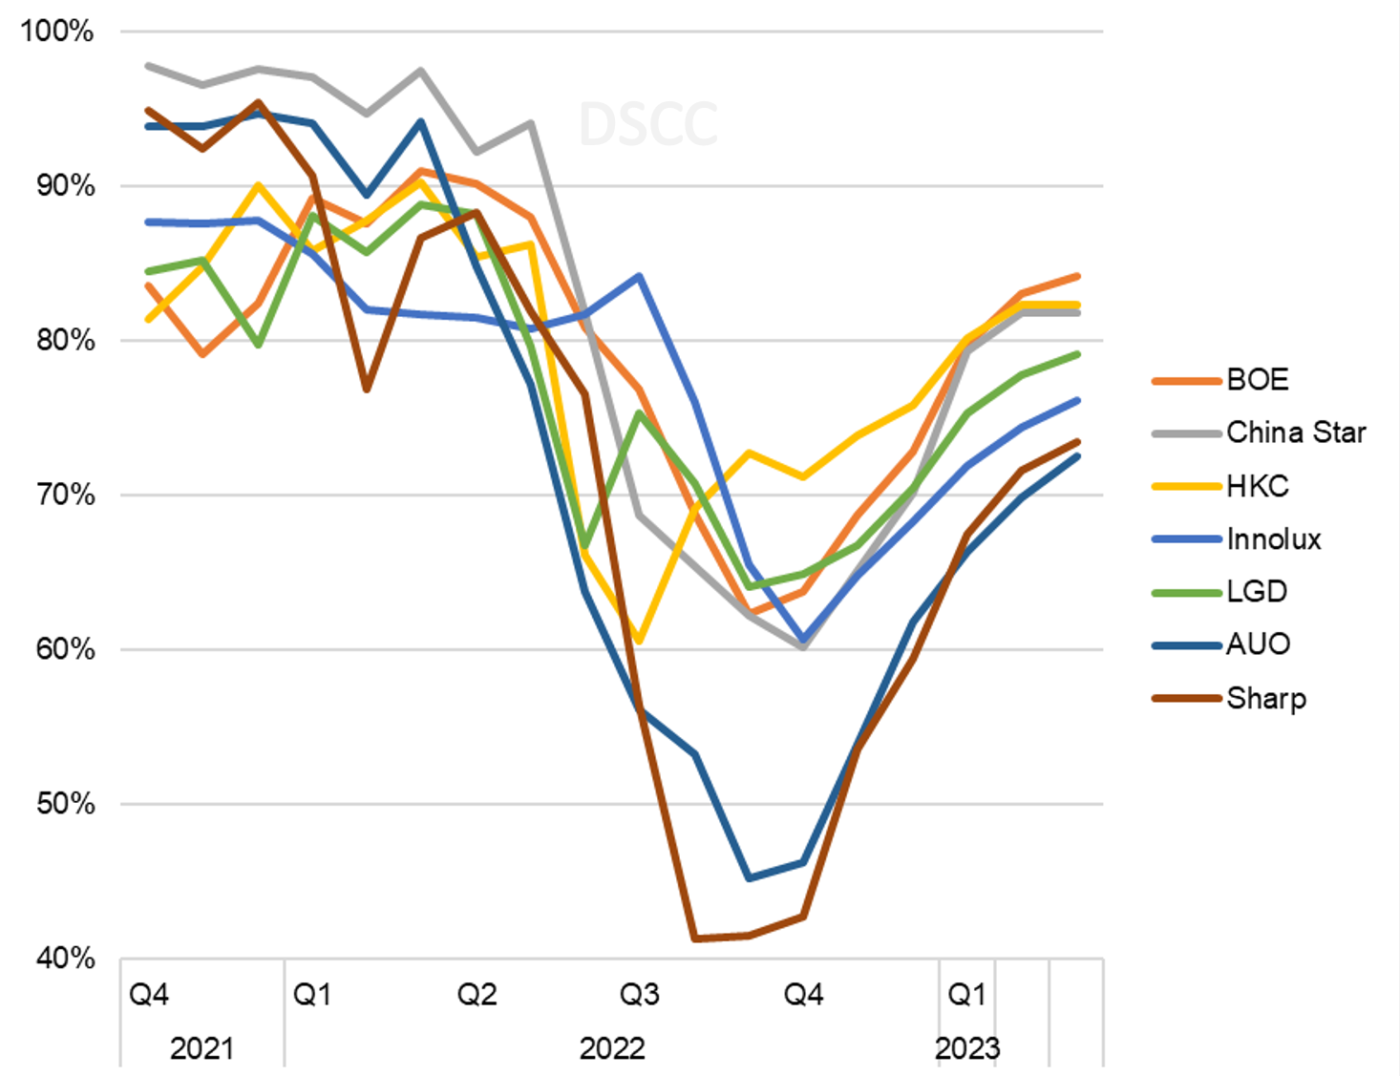
Looking more closely at LCD, a view of utilization by manufacturer by month shows the dramatic slowdown in Q3 for each of the top seven LCD makers, which have a combined 90% of the industry’s LCD capacity. The downturn appears particularly painful AUO and Sharp, each of which reduced utilization below 50%. AUO reported during Q3 that its average selling price (ASP) per square meter declined only 3% compared to Q2, which was much better than the 16% decline attributable to LCD TV panel prices, so it appears that AUO made the decision to hold the line on prices and turn away business rather than competing for sales below cost.
While in our previous update we expected a sharp slowdown by HKC, in this update we saw their utilization increase in August and September and we expect it will be higher than the industry average in Q4. HKC recently had its initial public offering (IPO), which had been scheduled for this month, suspended by the Shenzhen Stock Exchange. HKC has not provided the exchange with the required financial information. It is unclear whether HKC’s operations have been affected by the suspension of its IPO.
TFT LCD Monthly Fab Utilization by Manufacturer
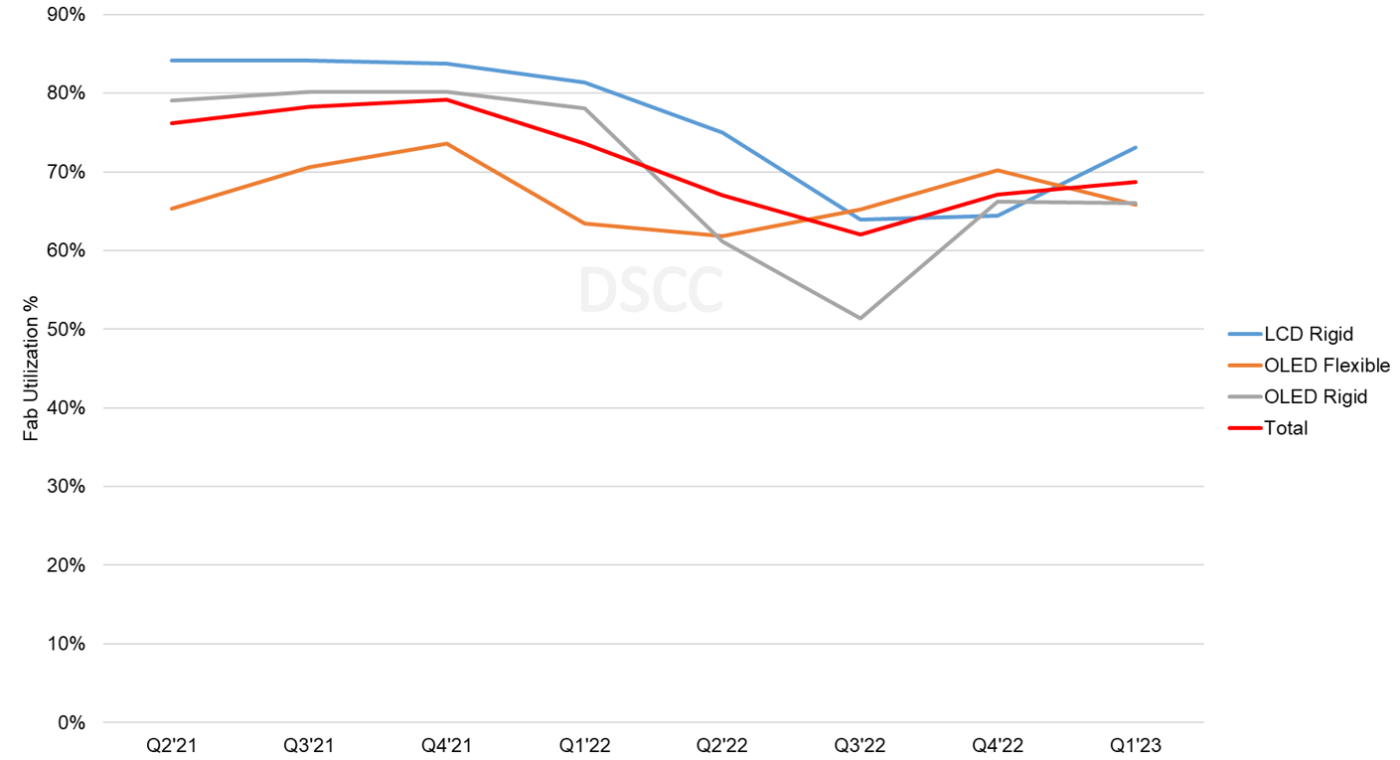
The Quarterly All Display Fab Utilization Report, as its name implies, covers every display technology and application, but a separate DSCC report, the Quarterly OLED and Mobile/IT Fab Utilization Report, also updated this week, provides a more narrow focus on OLED and LTPS LCD. The next chart here shows a view of utilization for LTPS LCD and OLED with Rigid and Flexible substrates. Although the slowdown in these categories is less sharp than in the large-screen LCD sector, utilization has been lower in 2022 than in 2021, and rigid OLED has undergone a severe slowdown in Q2/Q3 because of weak demand for rigid OLED panels for smartphones. Flexible OLED continues to struggle with overcapacity, especially in China, and the LTPS LCD sector has struggled with the general slowdown in the smartphone market.
Quarterly TFT Utilization by Display Technology and Substrate
The industry’s capacity increases, which were a response to the unprecedented surge in demand during the pandemic, led to an oversupply which brought panel prices down precipitously to below cash costs. The excess inventory in the display supply chain, coupled with weak demand, has continued to put downward pricing pressure on display panels. With few prospects for increased demand in the near term, recovery is expected to be slow.
DSCC’s Quarterly All Display Fab Utilization Report (一部実データ付きサンプルをお送りします) covers capacity, TFT Input and utilization by month for every flat panel display fab in the industry, with pivot tables to allow segmentation by supplier, country, TFT fab generation, backplane, frontplane or substrate type. The report provides historical utilization back to Q1 2018 and a forecast by month for 2022. DSCC Weekly readers interested in subscribing to the Quarterly All Display Fab Utilization Report should contact info@displaysupplychain.com.
本記事の出典調査レポート
Quarterly All Display Fab Utilization Report
一部実データ付きサンプルをご返送
ご案内手順
1) まずは「お問い合わせフォーム」経由のご連絡にて、ご紹介資料、国内販売価格、一部実データ付きサンプルをご返信します。2) その後、DSCCアジア代表・田村喜男アナリストによる「本レポートの強み~DSCC独自の分析手法とは」のご説明 (お電話またはWEB面談) の上、お客様のミッションやお悩みをお聞かせください。本レポートを主候補に、課題解決に向けた最適サービスをご提案させていただきます。 3) ご購入後も、掲載内容に関するご質問を国内お客様サポート窓口が承り、質疑応答ミーティングを通じた国内外アナリスト/コンサルタントとの積極的な交流をお手伝いします。
