米国の消費者物価指数とTV価格動向
冒頭部和訳
9月に入り、米国の消費者物価指数 (CPI) は過去40年間以上の期間で最も高い値から、ゆっくりではあるが着実な低下を続けているが、金融市場の懸念はCPIから不安定な食品とエネルギーの価格を除外した「コア」インフレ率の上昇に集中していた。一方、2021年後半に始まったTV用LCD価格の急激な下落は、9月にその傾向は約1ヵ月間止まったものの、その影響は引き続き小売価格へと波及している。
この分析は、米国労働統計局 (BLS) 発表の最新のCPIデータに基づいている。BLSは数百単位のカテゴリーのCPI統計を発表しており、現在のデータセットは1996年までさかのぼるが、CPIは1982年-1984年に対して指数化されている。CPIには300を超えるサブインデックス (下位指数) が含まれており、それぞれに経済全体に対するサブインデックスの重要度を示すウェイティング (重み付け) がなされている。たとえば、食料品はCPIの14%を構成しており、ガソリンのウェイティングは4%となっている。TVのウェイティングはわずか0.096%である。
US TV Inflation Takes a One-Month Pause as Overall Inflation Continues
In September 2022, headline inflation numbers in the US continued their slow but steady decrease from their highest point in more than 40 years, but the concern in financial markets centered on the rise of “core” inflation, which excludes more volatile food and energy costs. Meanwhile, the steep declines in LCD TV panel prices that started in the second half of 2021 are continuing to flow through to retail, although the downward trend took a one-month pause in September.
This analysis is based on the most recent data from the US Bureau of Labor Statistics (BLS) Consumer Price Index (CPI). The BLS publishes CPI statistics for hundreds of categories, and its current data set goes back to 1996, but the CPI is indexed to 1982-1984. The CPI includes more than 300 sub-indexes, each with a weighting that indicates the importance of the sub-index to the overall economy. For example, food items comprise 14% of the CPI, and gasoline is weighted at 4%. Televisions have a tiny weighting of only 0.096%.
The September 2022 overall CPI stood at 296.8, up slightly from August 2022 but up 8.2% from September 2021. This means that a standard basket of goods that could be purchased for $100 in 1982-1984 would cost $296.81 for a consumer today. The CPI for TVs in July 2022 was 1.232, which means that a (hypothetical) TV that cost $100 in 1982-1984 would cost $1.23 today. On a M/M basis TV prices were up 0.9%, the first M/M increase since prices peaked in August 2021.
The chart here shows the Y/Y change in the CPI, which readers may recognize as the more familiar headline definition of inflation, and in the CPI sub-index for TV. In the period from 1997-2021, the CPI for TV has spent nearly the entire flat panel display era below -10%. For a period of more than ten years from 2005 to 2017, the CPI for TV was always below -10% and often below -20%.
Y/Y % Change in US Consumer Price Index
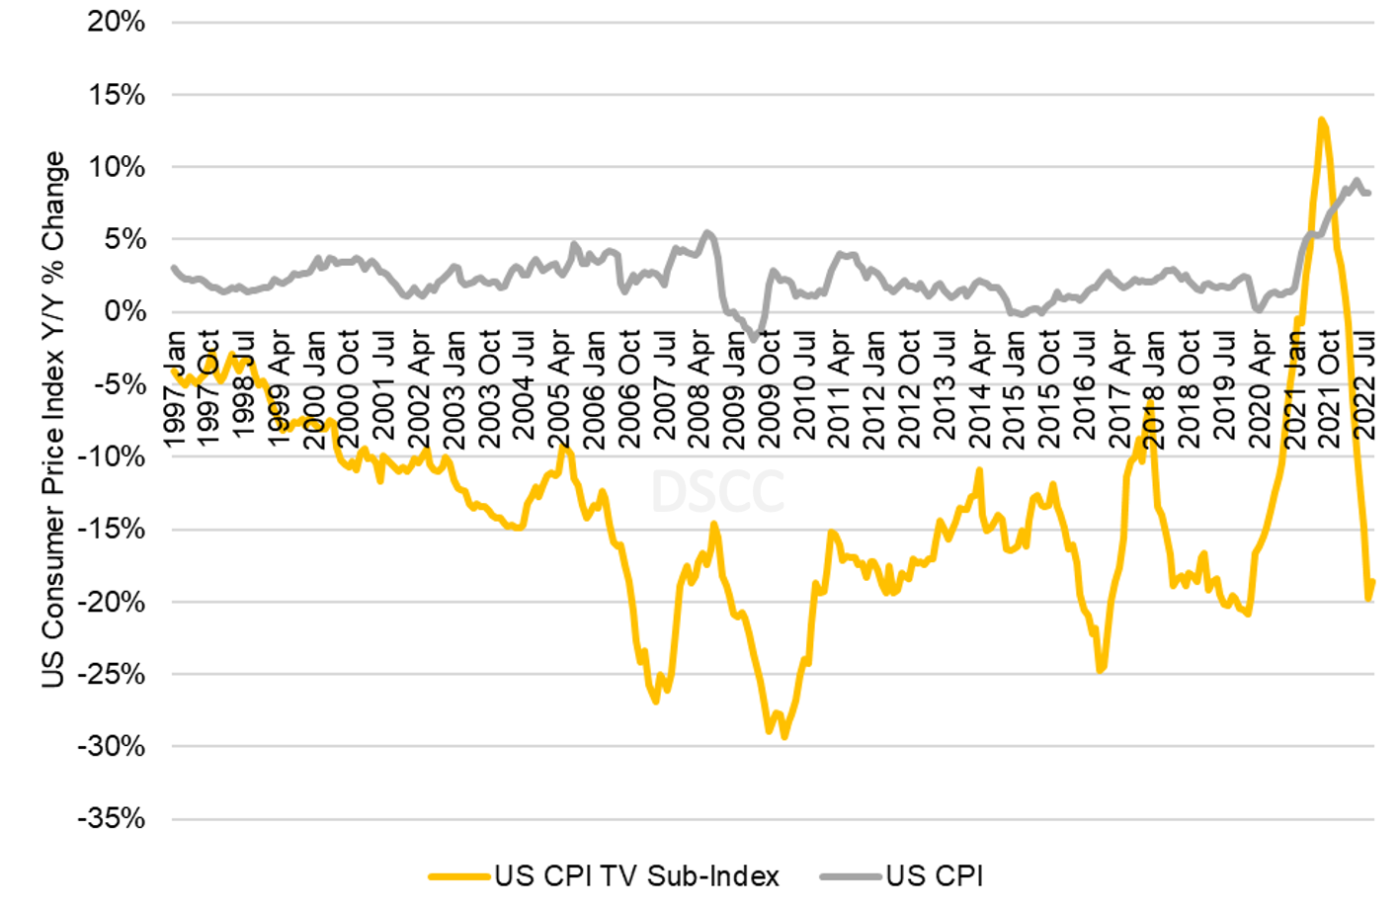
The general CPI in September 2022 increased by 8.2%, while the CPI sub-index for TVs in June 2022 decreased by 18.6% Y/Y, a slightly smaller Y/Y price drop than the 19.8% recorded in August 2022. TV inflation peaked in August 2021 at 13.3% which was the highest level ever, but it has dropped rapidly in the year since then. The September price increase of 0.9% represents a rate of +11% on an annualized basis if it would continue for 12 months, but it is much more likely that TV prices will decline in October, with special holiday promotions kicking in (see separate story).
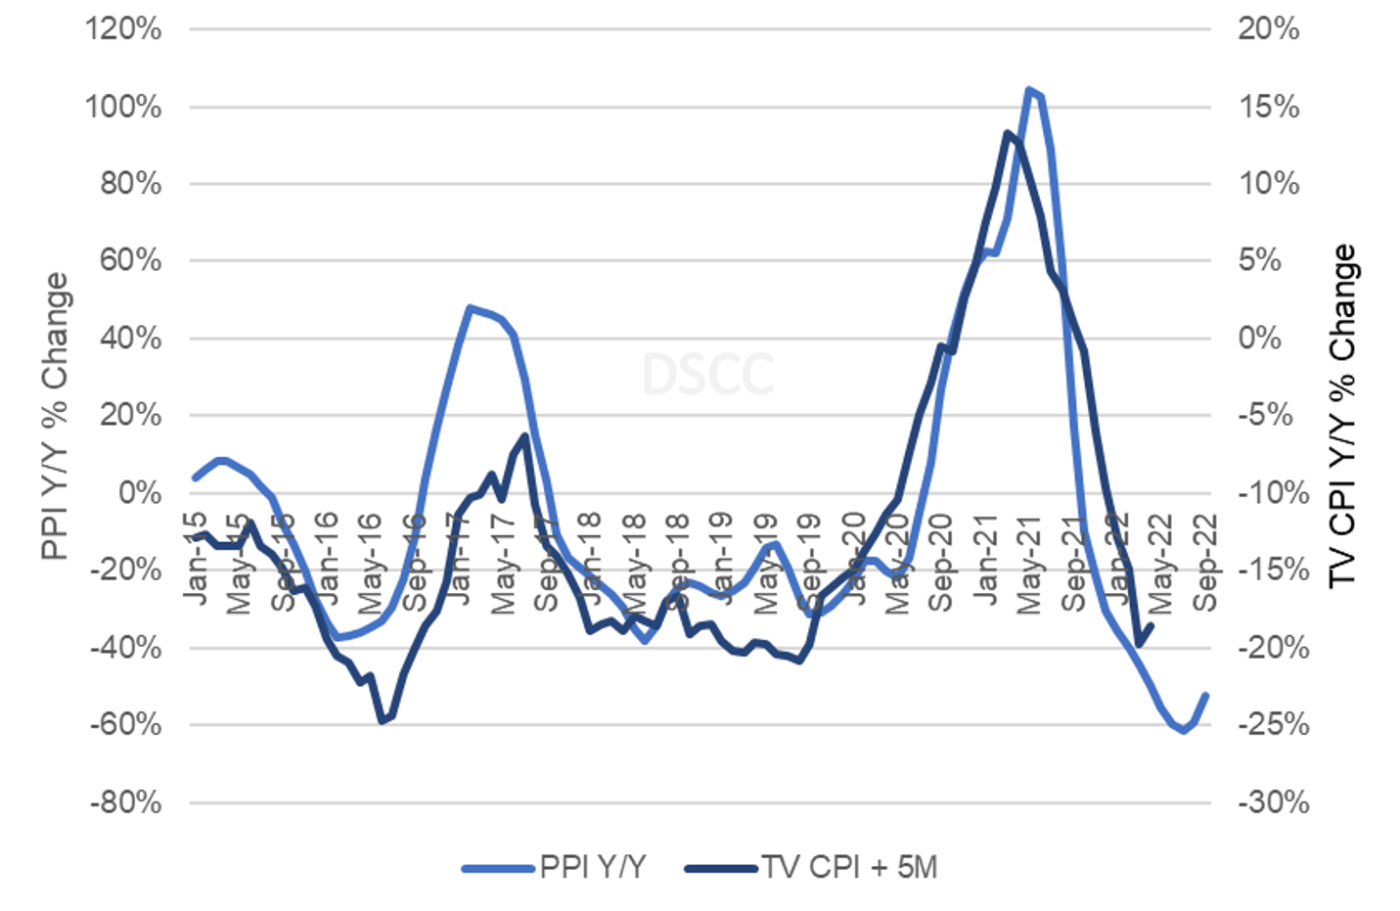
Based on our regression of TV inflation against LCD TV panel prices, we expect that US TV inflation will be even more negative in the fourth quarter of 2022; we expect that the US CPI index will drop below -20%, as indicated by the chart here.
Y/Y % Change in US TV Prices and LCD TV Panel Prices
Inflation for TV prices in the US is not expected to have a strong effect on demand, based on the historical example – past examples of TV deflation did not lead to a surge in demand in the US. However, now that a full year has passed since the economy started opening up, lower TV prices might help the US increase Y/Y sales numbers.
With inflation in many other sectors of the US economy, this holiday season looks like a good time to buy a new TV.
