TV用LCD価格が間断なく下落
冒頭部和訳
TV用LCD価格が引き続き下落しており、第2四半期に入ってキャッシュコストに近づきつつあるものの、価格下落ペースは加速している。需要がほぼ例外なく弱い状況の一方、供給量の急増が続いていることで、価格は継続的に押し下げされている。
1ヵ月前には、TV用LCD市場は落ち着きを取り戻しているようだと報告した。その落ち着きは壊れてしまったようで、FPDメーカーにとって望ましい状況ではない。価格は2021年中盤のピークから劇的に下落したが、需要が最もスローな季節になっても、供給は引き続き堅調である。当社の調査によると、一部のブランドは第1四半期に価格が安定する可能性があると考え、この期間を利用して低価格で買い込んだが、需要は引き続き弱く、現在は過剰在庫を抱えているとみられる。
下図はTV用LCD価格の推移および予測の最新情報だが、2020年中盤から2021年中盤までのFPD業界史上最大の価格上昇と、その後の2021年秋に見られた業界最速の価格下落の両方を示している。いずれのサイズのLCDも、11月以降は前年比で価格が下がっている。価格下落はQ1’22に入って緩和、平均価格下落率は12月の6.7%から1月には4.4%となり、2月は2.6%、3月は1.8%と横ばい傾向を示していた。
No Respite for LCD TV Panel Price Declines
LCD TV panel prices continue to decline, and the pace of price decreases is accelerating in the second quarter despite prices approaching cash costs. The combination of a continued surge in supply and near-universally weak demand continues to drive prices down.
A month ago, we reported that the LCD TV panel market appears to be in a sort of a lull. That lull seems to have broken, and not in favor of the panel makers. Prices declined dramatically from their peaks in mid-2021 but supply has continued to be robust while we face the slowest season for demand. Our sources indicate that some brands considered that prices might stabilize in Q1 and used the period to stock up on low prices but have faced continued weak demand and now hold excess inventory.
The first chart here highlights our latest TV panel price update, showing the both the biggest price increases in the history of the flat panel display industry, from mid-2020 to mid-2021 and then the fastest price decreases in the industry in the autumn of 2021. All sizes of panels have been at lower prices Y/Y since November. Price declines moderated in Q1’22, with the average M/M sequential price decrease flattening from 6.7% in December to 4.4% in January, 2.6% in February and 1.8% in March.
LCD TV Panel Prices July 2020 - September 2022
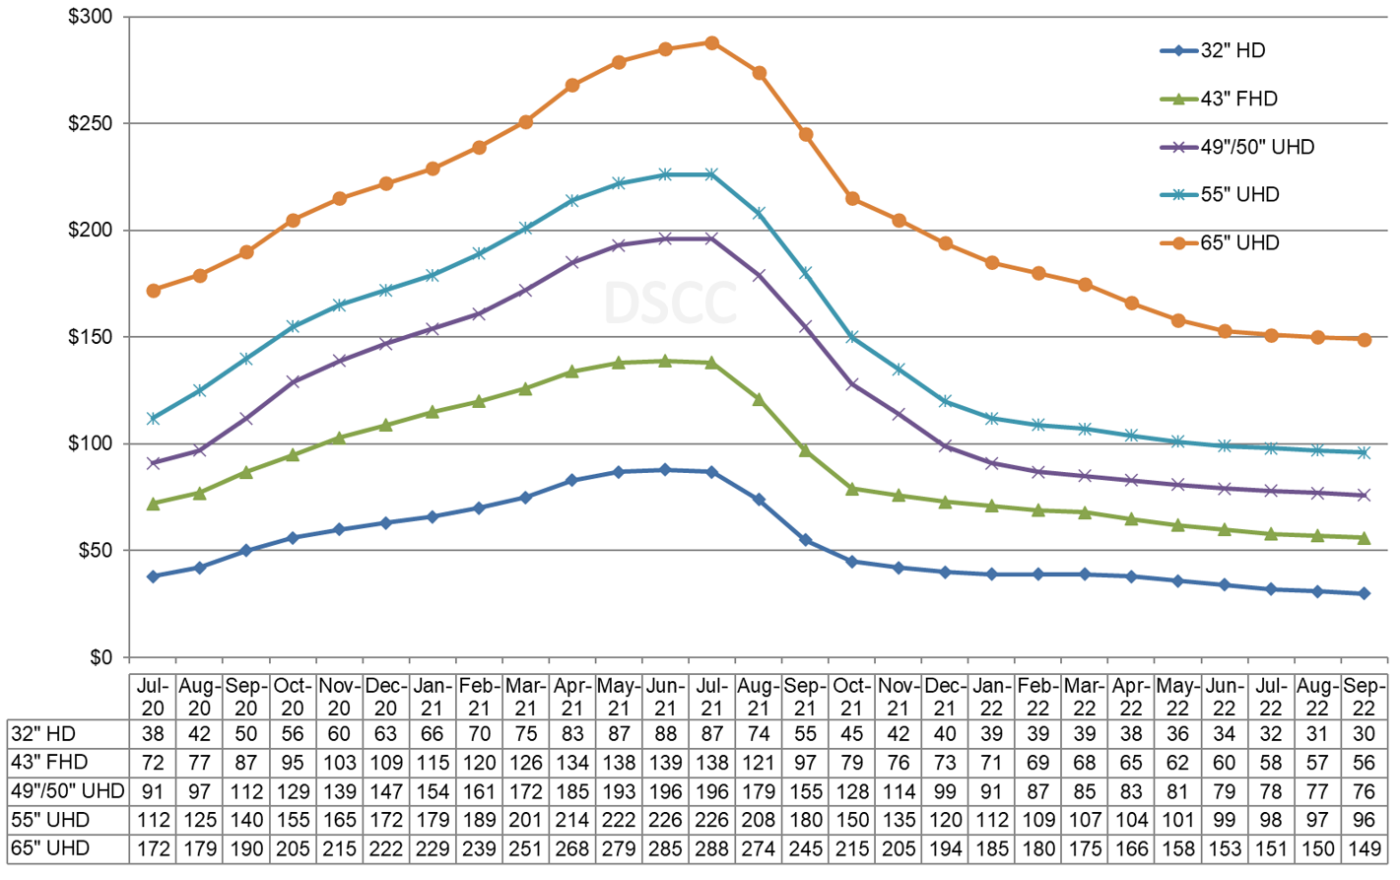
Price declines are accelerating in the second quarter, with the average M/M sequential decline increasing to 3.6% in April and 3.9% in May.
The fourth quarter of 2021 saw the biggest Q/Q price declines in the history of the flat panel display industry. Across the six sizes we track, the Q4 price declines averaged 32%. The first quarter of 2022 saw slower declines overall but the most severe declines were on 49”/50” and 55” panels which are efficiently produced on the many Gen 8.5 (and Gen 8.6) fabs built in China in the last five years. The average decline across the six sizes we track was 13%, but 55” prices declined 19% in Q1 and 49”/50” prices declined 22%. In the second quarter, the price declines are more evenly distributed; all falling within a range of 7% to 12% with an average decline of 9%.
As we look at pricing on an area basis, all sizes 55” and below seem to be converging to a narrow range with the Gen 8.5 sizes are at the bottom of the stack. In April 2022, 49”/50” panels are in a tie with 55” for the lowest priced panels on an area basis at $125 per square meter, but all the sizes below 65” are in a narrow range between $125 and $135.
Monthly Area Prices per Square Meter for TV Panels, January 2018 - September 2022
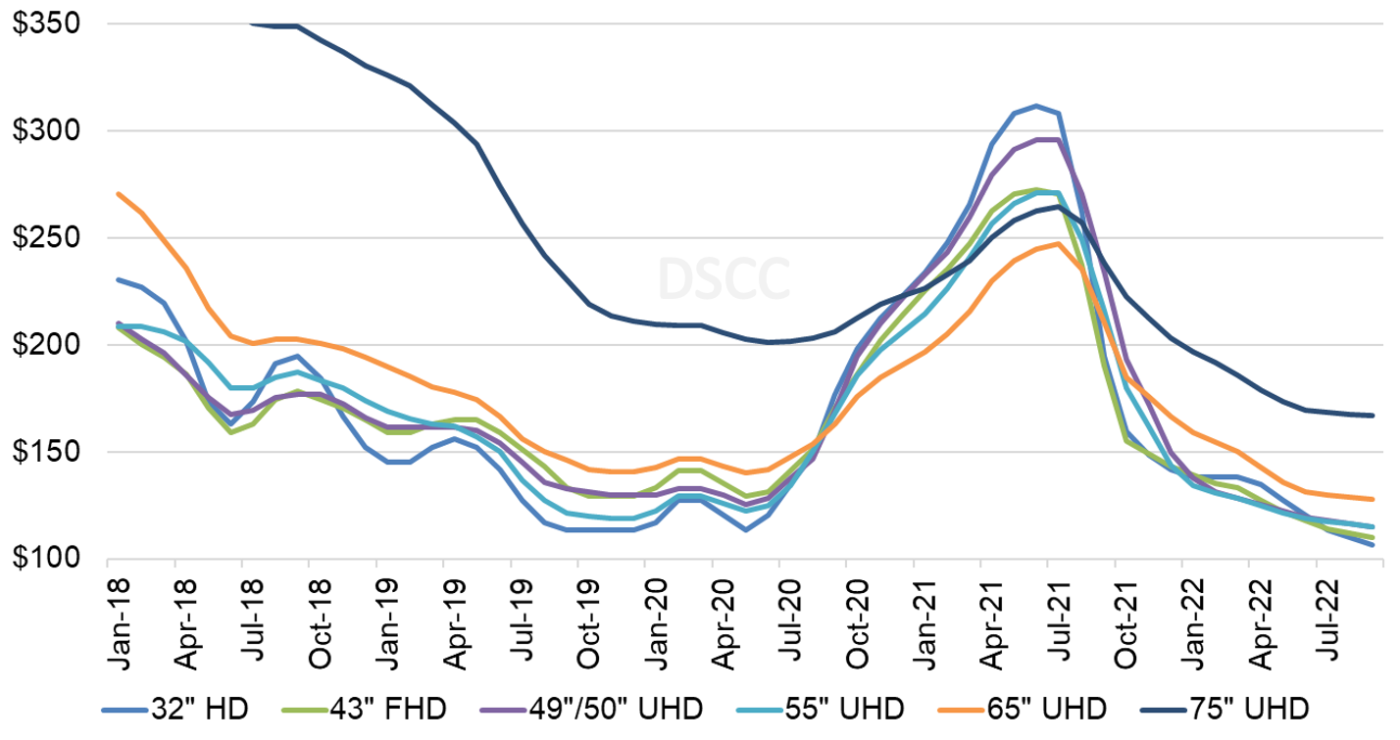
While prices have converged for all the smaller size panels, 65” and 75” panels continue to have a premium on an area basis, but the premium is shrinking. For April 2022, 65” panels sell at a premium of $18 or 14% over 55”, but the premium was 19% in March. The larger 75” panels have a premium of $54 or 43%, down from a 49% bonus in March. Panel makers with Gen 10.5 capacity (BOE, CSOT and Sharp SIO) remain at a relative advantage in the current oversupply environment, but the price competition is hitting them as well.
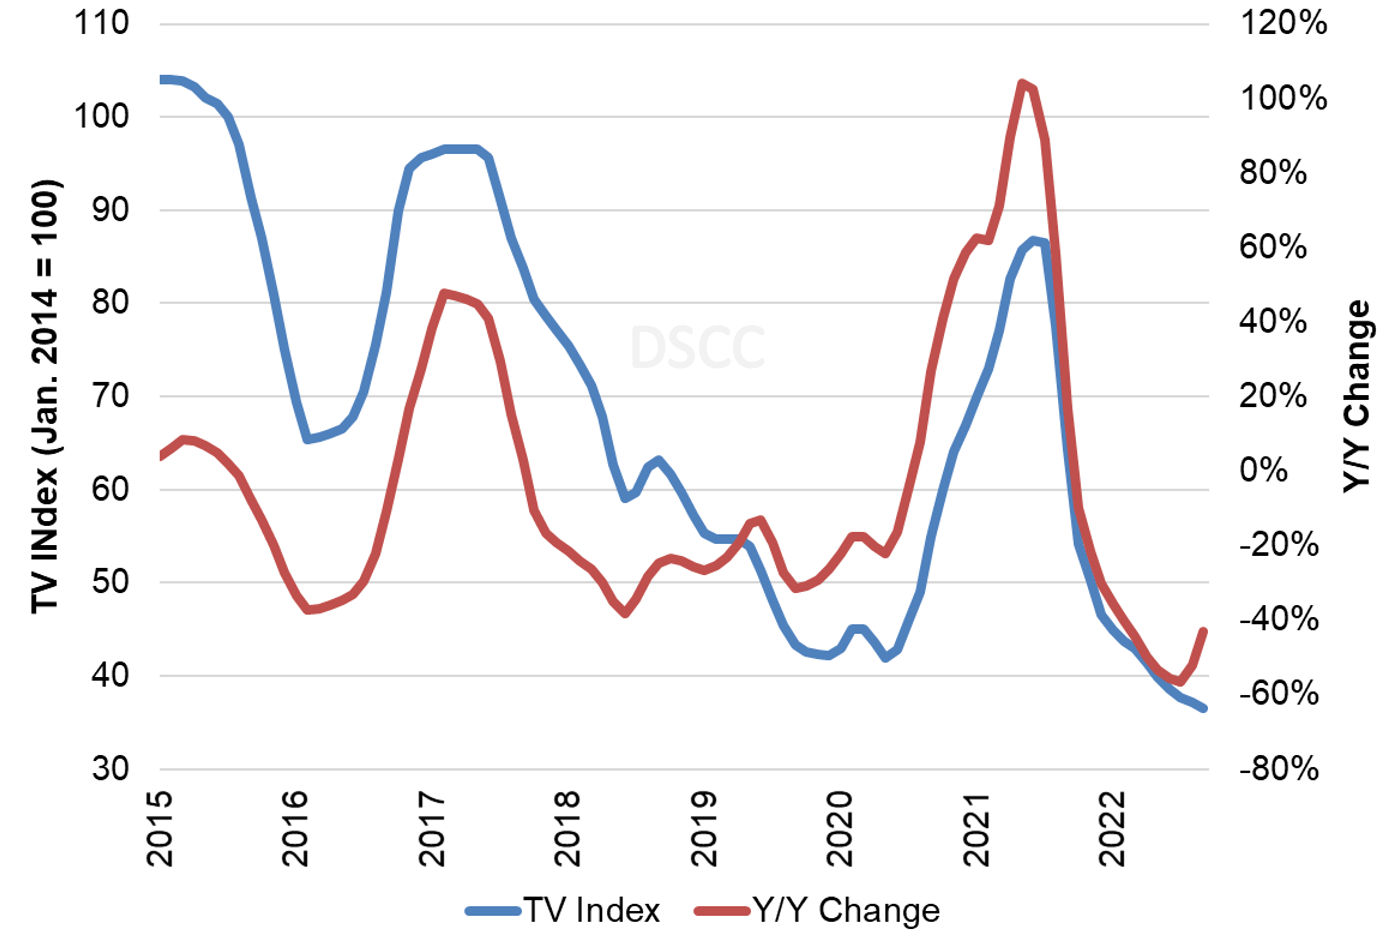
The last chart here shows our TV price index, set to 100 for prices in January 2014, and the Y/Y change of LCD TV panel prices. Our index increased from its all-time low of 42 in May 2020 to 87 in June 2021, but prices hit a new all-time low at 41.5 in April. This does not mean that each screen size also has an all-time low, because the index is based on an average; 75” panels already hit an all-time low in February and we expect 65” to fall to its all-time low in May. We now expect the index to continue to decline to 36.6 by September, 58% lower than the peak in June 2021.
TV Panel Price Index and Y/Y Change, January 2015 - September 2022
With the COVID-19 demand surge assisted by shortages in glass and DDICs, we saw a historic year of increases in panel prices, and panel makers post their most profitable quarter ever in the second quarter of 2021. Profits declined in Q3 but not by much, but profits plunged in Q4 as the panel price declines hit home. This week we have seen the first indications of earnings results for Q1 from AUO and LGD, and these companies both reported sharply lower profitability with LGD barely above breakeven.
