国内お問い合わせ窓口
info@displaysupplychain.co.jp
FOR IMMEDIATE RELEASE: 07/06/2021
Q2 OLED Supply/Demand Update
Bob O'Brien, Co-Founder, Principal AnalystAnn Arbor, MI USA -
[田村喜男の補足解説:モバイル用OLED供給過剰は徐々に緩和]
DSCCが発行するOLEDパネル需給バランス分析レポート Quarterly OLED Supply/Demand and Capital Spending Report (一部実データ付きサンプルをお送りします) では、パネルメーカー別の生産能力を基板投入量からパネル生産枚数まで詳細に分析している。
モバイルOLED用パネル生産能力は2017年から2020年の3年間で2倍に達したが、需要増加がこれに追い付かず、40%もの大きな供給過剰が2018年から3年間引き続いてきた。今後も生産能力の増加は引き続き、2020年から2023年の3年間でも50%増加する見通しだ。このような継続的な能力増加の大部分は、中国政府の補助金によるフレキシブルOLED投資によるものである。
一方モバイル用OLED需要は、IT需要が喚起されてスマホ以外の用途も拡大方向である (参照記事)。そしてスマホでも2020年から2022年にかけてAppleや中国ブランド向けのフレキシブルOLED需要が大きく増加している。OLEDライン稼働率は、2018-2020年の50%台後半に対して、2021年は60%台後半、2022-2023年は70%台前半までの改善を見込む。フレキシブルOLEDのみに注目すると、2018-2020年の43-54%に対して、2021年は60%、2022-2023年は60%台前半とまだ余力がある。
国別に見ると、韓国のみの同ライン稼働率は、2019年から2021年にかけて40%台半ば、60%台半ば、80%と大きく改善してきている。一方、中国の同ライン稼働率は2021年でも40%台にとどまっている。特にBOEに続く中国パネルメーカーがフレキシブルOLEDパネル価格をすでに$50-30まで引き下げており、これが中国スマホブランド向け需要増加につながり、今後のモバイルOLED供給過剰の緩和に寄与していくことになる。
アジア代表・田村喜男 (7月9日 13:30版)
---------------------
We have updated DSCC’s Quarterly OLED Supply/Demand and Capital Spending Report (一部実データ付きサンプルをお送りします) for Q2 2021, with DSCC’s latest capacity outlook for the industry and our forecast for OLED panel demand. As we have reported for more than a year now, OLED for smartphones (technically, for small & medium applications) continues to have a substantial oversupply which is expected to persist for years. We have revised our outlook for OLED TVs on both the supply and demand sides. We continue to expect a modest oversupply in 2021-2025 with utilization below 90%, but above 80% throughout the forecast period.
The report combines DSCC’s comprehensive view of OLED capacity with our equally thorough analysis of OLED demand and compares supply and demand for both smaller screens and large-gen sizes. DSCC’s OLED capacity outlook extends to 2025 and covers the capacity for 104 different phases of OLED capacity investments, over 13 different panel makers and details the supply capacity of the industry by manufacturer, by country, by substrate type (flexible/rigid), deposition type, backplane type, color type and form factor.
The report includes two separate views of capacity, DSCC’s “aggressive” capacity case, which includes all possible fabs, and our “conservative” case, which includes only fabs in our A, B and C groups. Group C fabs have equipment POs issued more than a year in the future but are considered high probability (>>50%). The conservative case excludes D group fabs, which are considered as less than 50% probable, and since even the conservative case leads to a conclusion that the industry will have oversupply for years, it must be considered as more likely.
In both smartphones and TVs, OLED capacity today is dominated by Korean panel makers Samsung and LGD, respectively. Capacity additions in China, including not only Chinese panel makers, but LGD’s addition in Guangzhou, have increased China’s share of capacity from 5% in 2017 to an expected 42% in 2021. Continued investments by both SDC and LGD will allow Korea to maintain its lead through 2024, but TV projects by both CSOT and BOE will mean that China’s capacity will narrowly overtake Korea in 2025.
While LGD will continue to lead in OLED TV capacity throughout our forecast, capacity additions by Samsung, BOE, and CSOT will reduce LGDs share of capacity from 100% in 2020 to 52% in 2025, as Samsung grows to 26% of industry capacity.
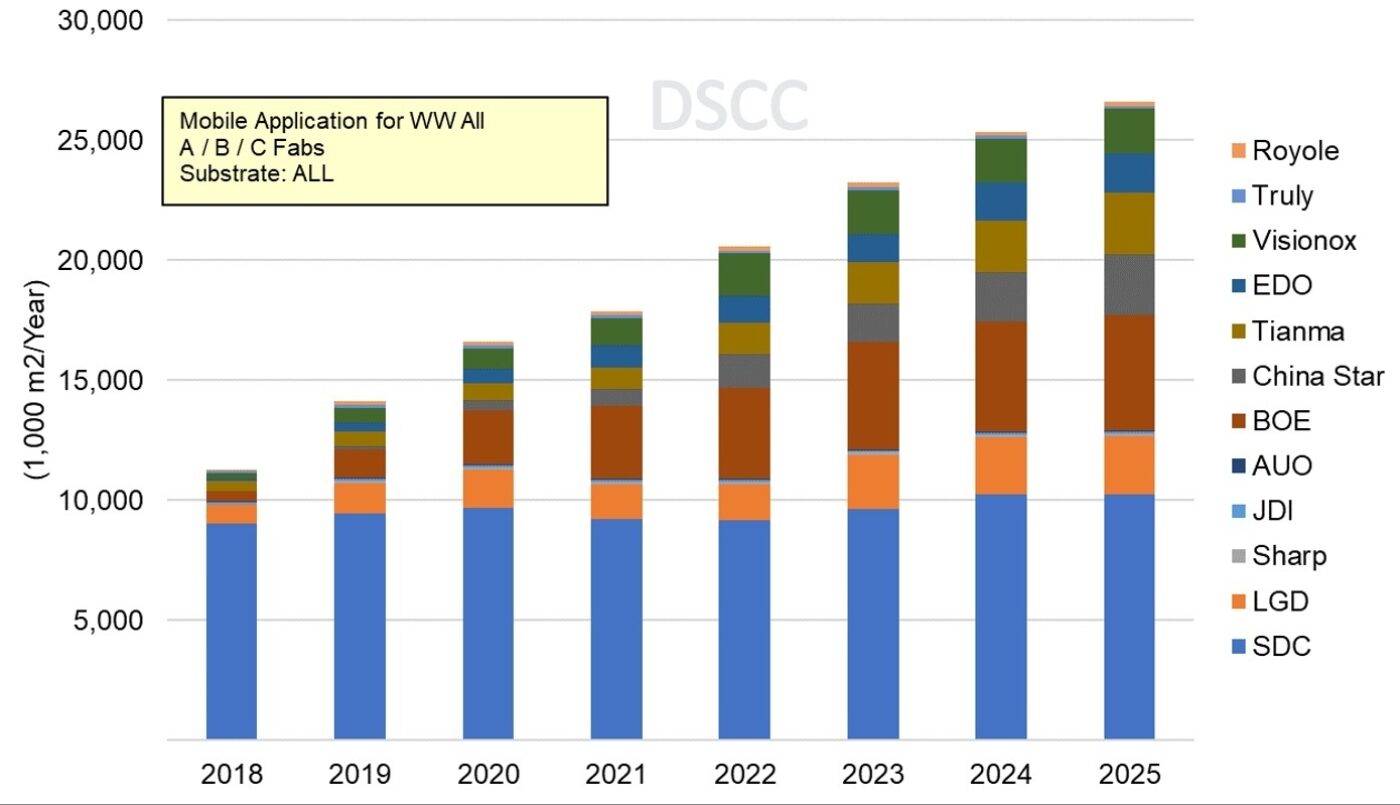
In Small/Medium OLED, Samsung’s share of capacity will continue its steady decline as their capacity sees modest reductions in 2020-2022 associated with the introduction of Y-OCTA, while Chinese panel makers aggressively add capacity. Samsung capacity share was from 88% in 2017, but already dropped to 58% in 2020 and will further decline to 39% in 2025. BOE passed LGD in 2020 to become the #2 supplier by capacity, and LGD will be passed by CSOT and Tianma in 2025 to fall to the #5 position.
OLED Input Area for Small/Medium Applications by Manufacturer, 2017-2025
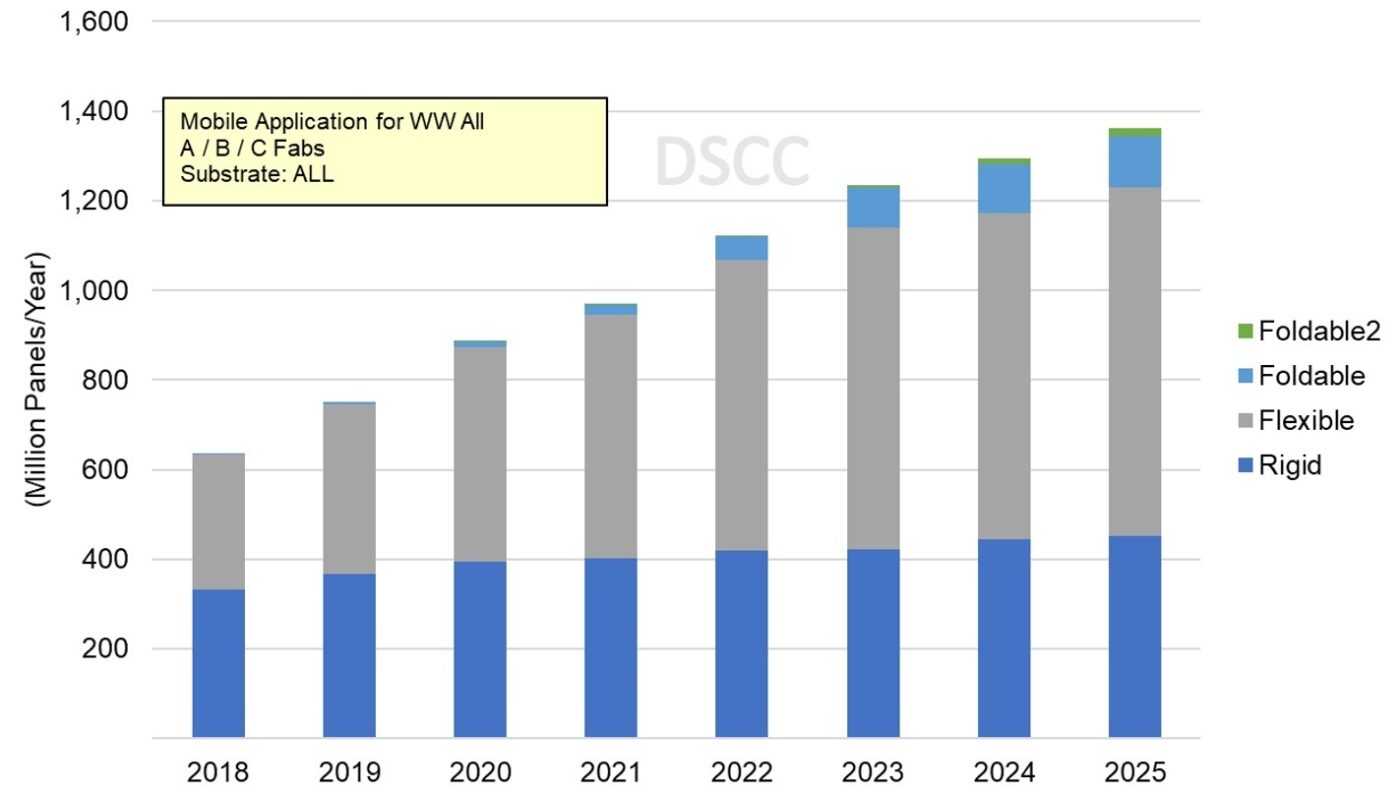
While input area is important, especially for materials suppliers, the supply/demand outlook is shaped by the product mix and yield. The report works through the details of fab ramps, yield curves, and product mix to estimate the total industry output as shown in the figure below. In the report, we segregate foldable products into two groups, with the Foldable2 group representing larger foldable products such as notebooks and tablets, while Foldable represents smartphones. Our report reflects the reality in the industry that yields on OLED smartphone products are lower than expected for all panel makers except Samsung Display. But our forecast anticipates continued yield improvements as panel makers progress through the experience curve.
OLED Smartphone Panel Output (Supply Capacity in Units) by Form Factor
The DSCC demand forecast includes 11 different applications, and the details are available in DSCC’s Quarterly OLED Shipment Report (一部実データ付きサンプルをお送りします) (see separate story this issue). The OLED Supply/Demand report includes a summary of our forecast by application.
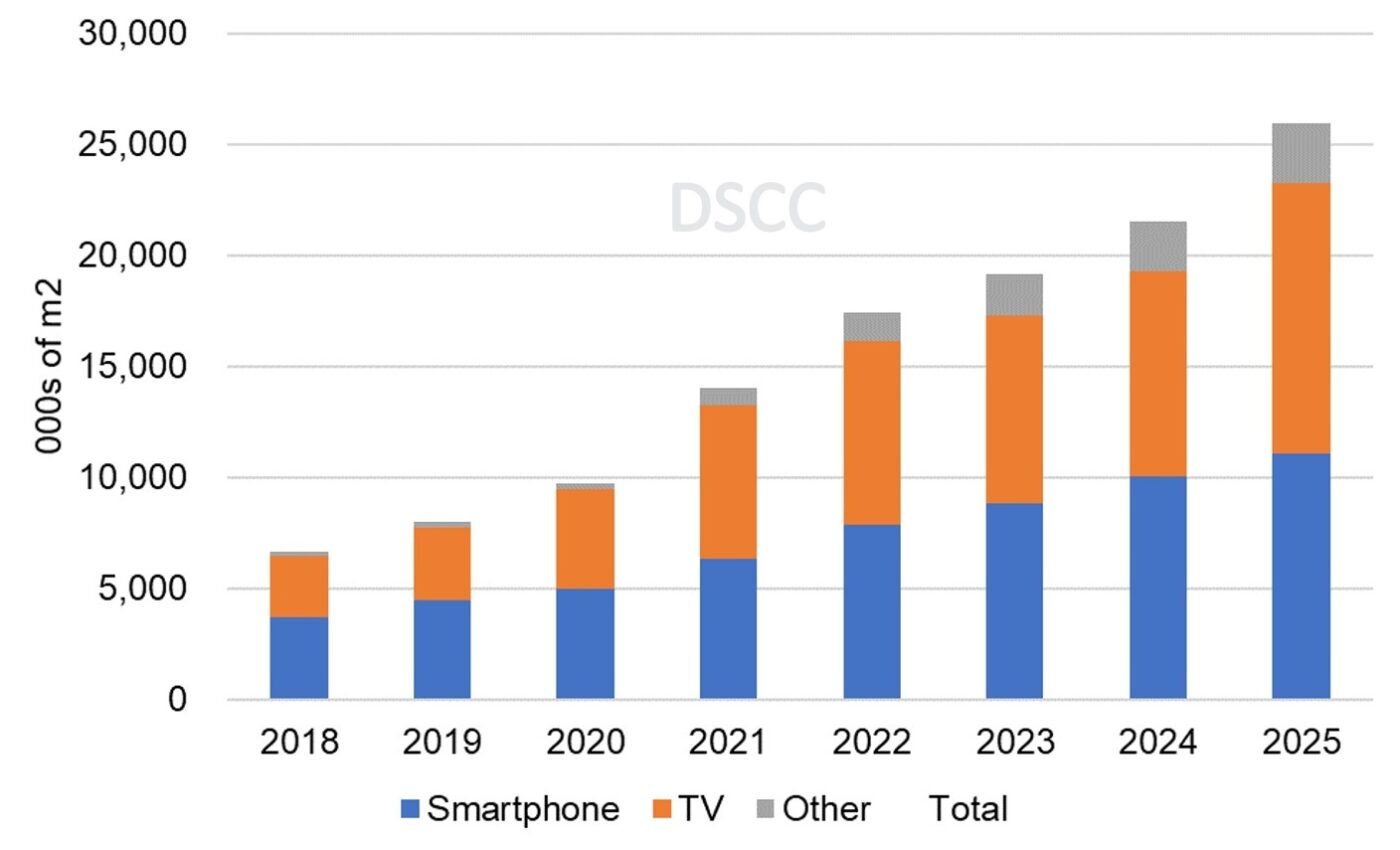
In working out the total supply/demand balance, we need to work in area terms, and our forecast for OLED display panel area by major application is shown in the next chart. While smartphones represented the largest display area in 2020, we expect TV to surpass smartphones in 2021 and eventually grow to 47% of all area demand by 2025. While the area demand for “all other” applications climb to 10% of the total, driven by IT applications (monitors, notebooks and tablets), and smartphones fall to 43% of OLED area demand.
OLED Panel Demand by Application, 2017 - 2025
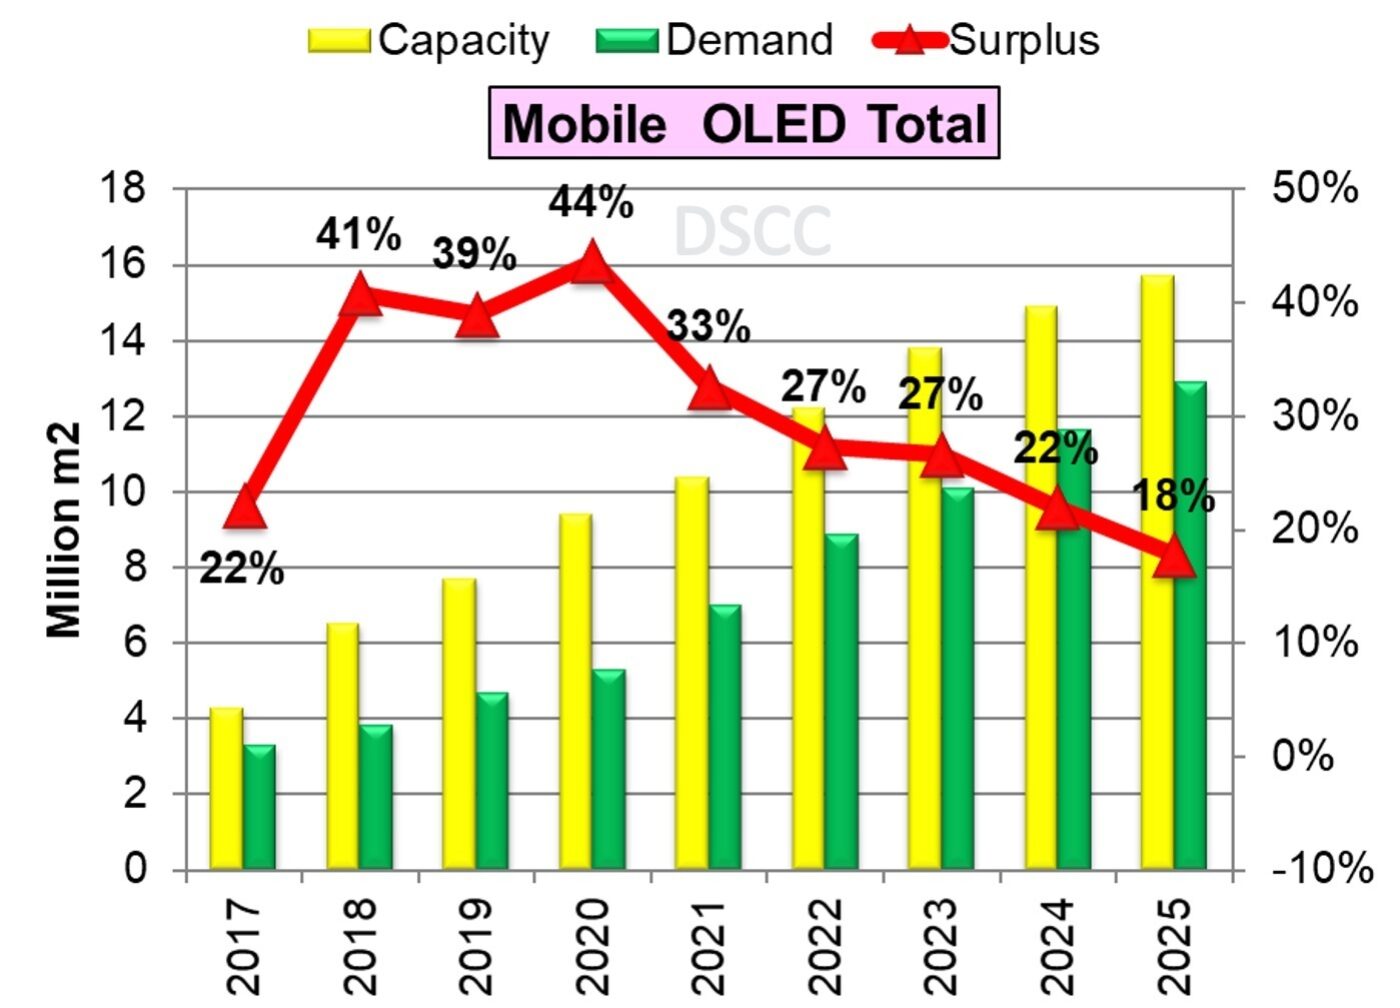
Now putting that together into the supply/demand picture, the final chart shows our outlook for smartphones for OLED panels, combining Rigid OLED and Flexible OLED. We expect OLED smartphone overcapacity to continue out to 2025, but the magnitude of the oversupply to diminish from 44% in 2020 to 18% in 2025. The picture for rigid OLED is better, and that for flexible is worse. But the dividing line between rigid and flexible will become blurry, as we expect BOE, LGD and perhaps other panel makers to make rigid panels for notebook PCs on flexible lines starting in 2022-2023.
OLED Supply/Demand for Smartphone Panels 2017-2025
On the TV side, we expect that LGD’s overall OLED TV fab utilization in 2021 will fall to 86%, up compared to 2020 but down compared to 90%+ capacity from 2016-2019. We expect UT% will remain in the range of 85%-90% throughout the forecast period, as LGD, SDC and later BOE and CSOT balance capacity increases with price reductions.
The DSCC Quarterly OLED Supply/Demand and Capital Spending Report (一部実データ付きサンプルをお送りします) gives a comprehensive perspective on the OLED industry. For more information about the report, please contact info@displaysupplychain.co.jp.
本記事の出典調査レポート
Quarterly OLED Supply/Demand and Capital Spending Report
一部実データ付きサンプルをご返送
ご案内手順
1) まずは「お問い合わせフォーム」経由のご要請にて「国内販売価格」を24時間以内にご返信します。 2) 続いて、レポート最新号に基づく「商品サンプル」を作成の上、ご返信します。 3) さらに、ご希望されるお客様には、DSCCアジア代表・田村喜男アナリストによる「本レポートの強み~DSCC独自の分析手法とは」のご説明 (お電話またはWEB面談) の上、お客様のミッションやお悩みをお聞かせください。本レポートを主候補に、課題解決に向けた最適サービスをご提案させていただきます。 4) ご購入後も、掲載内容に関するご質問を国内お客様サポート窓口が承り、質疑応答ミーティングを通じた国内外アナリスト/コンサルタントとの積極的な交流をお手伝いします。
About Counterpoint
https://www.displaysupplychain.co.jp/about
[一般のお客様:本記事の出典調査レポートのお引き合い]
上記「国内お問い合わせ窓口」にて承ります。会社名・部署名・お名前、および対象レポート名またはブログタイトルをお書き添えの上、メール送信をお願い申し上げます。和文概要資料、商品サンプル、国内販売価格を返信させていただきます。
[報道関係者様:本記事の日本語解説&データ入手のご要望]
上記「国内お問い合わせ窓口」にて承ります。媒体名・お名前・ご要望内容、および必要回答日時をお書き添えの上、メール送信をお願い申し上げます。記者様の締切時刻までに、国内アナリストが最大限・迅速にサポートさせていただきます。